
|
|||||
|
 | |
| |
| |
| |
| |
| |
|
Gene: ABL1 |
Gene summary for ABL1 |
| Gene information | Species | Human | Gene symbol | ABL1 | Gene ID | 25 |
| Gene name | ABL proto-oncogene 1, non-receptor tyrosine kinase | |
| Gene Alias | ABL | |
| Cytomap | 9q34.12 | |
| Gene Type | protein-coding | GO ID | GO:0000165 | UniProtAcc | A0A024R8E2 |
Top |
Malignant transformation analysis |
| Identification of the aberrant gene expression in precancerous and cancerous lesions by comparing the gene expression of stem-like cells in diseased tissues with normal stem cells |
| Entrez ID | Symbol | Replicates | Species | Organ | Tissue | Adj P-value | Log2FC | Malignancy |
| 25 | ABL1 | CCI_1 | Human | Cervix | CC | 3.65e-03 | 4.29e-01 | 0.528 |
| 25 | ABL1 | CCI_2 | Human | Cervix | CC | 1.23e-15 | 1.46e+00 | 0.5249 |
| 25 | ABL1 | CCI_3 | Human | Cervix | CC | 5.43e-11 | 8.43e-01 | 0.516 |
| 25 | ABL1 | HTA11_3410_2000001011 | Human | Colorectum | AD | 5.45e-06 | -2.61e-01 | 0.0155 |
| 25 | ABL1 | HTA11_347_2000001011 | Human | Colorectum | AD | 3.74e-10 | 7.10e-01 | -0.1954 |
| 25 | ABL1 | HTA11_1391_2000001011 | Human | Colorectum | AD | 2.74e-05 | 5.56e-01 | -0.059 |
| 25 | ABL1 | HTA11_99999970781_79442 | Human | Colorectum | MSS | 2.15e-02 | -2.31e-01 | 0.294 |
| 25 | ABL1 | HTA11_99999965062_69753 | Human | Colorectum | MSI-H | 1.88e-11 | 1.04e+00 | 0.3487 |
| 25 | ABL1 | HTA11_99999965104_69814 | Human | Colorectum | MSS | 4.10e-02 | 5.06e-01 | 0.281 |
| 25 | ABL1 | HTA11_99999974143_84620 | Human | Colorectum | MSS | 1.26e-08 | -3.89e-01 | 0.3005 |
| 25 | ABL1 | F007 | Human | Colorectum | FAP | 8.30e-05 | -5.27e-01 | 0.1176 |
| 25 | ABL1 | A002-C-010 | Human | Colorectum | FAP | 3.54e-02 | -2.92e-01 | 0.242 |
| 25 | ABL1 | A001-C-207 | Human | Colorectum | FAP | 8.06e-04 | -3.91e-01 | 0.1278 |
| 25 | ABL1 | A015-C-203 | Human | Colorectum | FAP | 5.12e-44 | -6.47e-01 | -0.1294 |
| 25 | ABL1 | A015-C-204 | Human | Colorectum | FAP | 2.97e-06 | -4.62e-01 | -0.0228 |
| 25 | ABL1 | A014-C-040 | Human | Colorectum | FAP | 6.87e-08 | -7.09e-01 | -0.1184 |
| 25 | ABL1 | A002-C-201 | Human | Colorectum | FAP | 1.03e-15 | -5.34e-01 | 0.0324 |
| 25 | ABL1 | A002-C-203 | Human | Colorectum | FAP | 7.93e-09 | -3.71e-01 | 0.2786 |
| 25 | ABL1 | A001-C-119 | Human | Colorectum | FAP | 4.15e-12 | -6.95e-01 | -0.1557 |
| 25 | ABL1 | A001-C-108 | Human | Colorectum | FAP | 2.78e-33 | -6.03e-01 | -0.0272 |
| Page: 1 2 3 4 |
| Tissue | Expression Dynamics | Abbreviation |
| Cervix |  | CC: Cervix cancer |
| HSIL_HPV: HPV-infected high-grade squamous intraepithelial lesions | ||
| N_HPV: HPV-infected normal cervix | ||
| Colorectum (GSE201348) |  | FAP: Familial adenomatous polyposis |
| CRC: Colorectal cancer | ||
| Colorectum (HTA11) |  | AD: Adenomas |
| SER: Sessile serrated lesions | ||
| MSI-H: Microsatellite-high colorectal cancer | ||
| MSS: Microsatellite stable colorectal cancer | ||
| Endometrium | 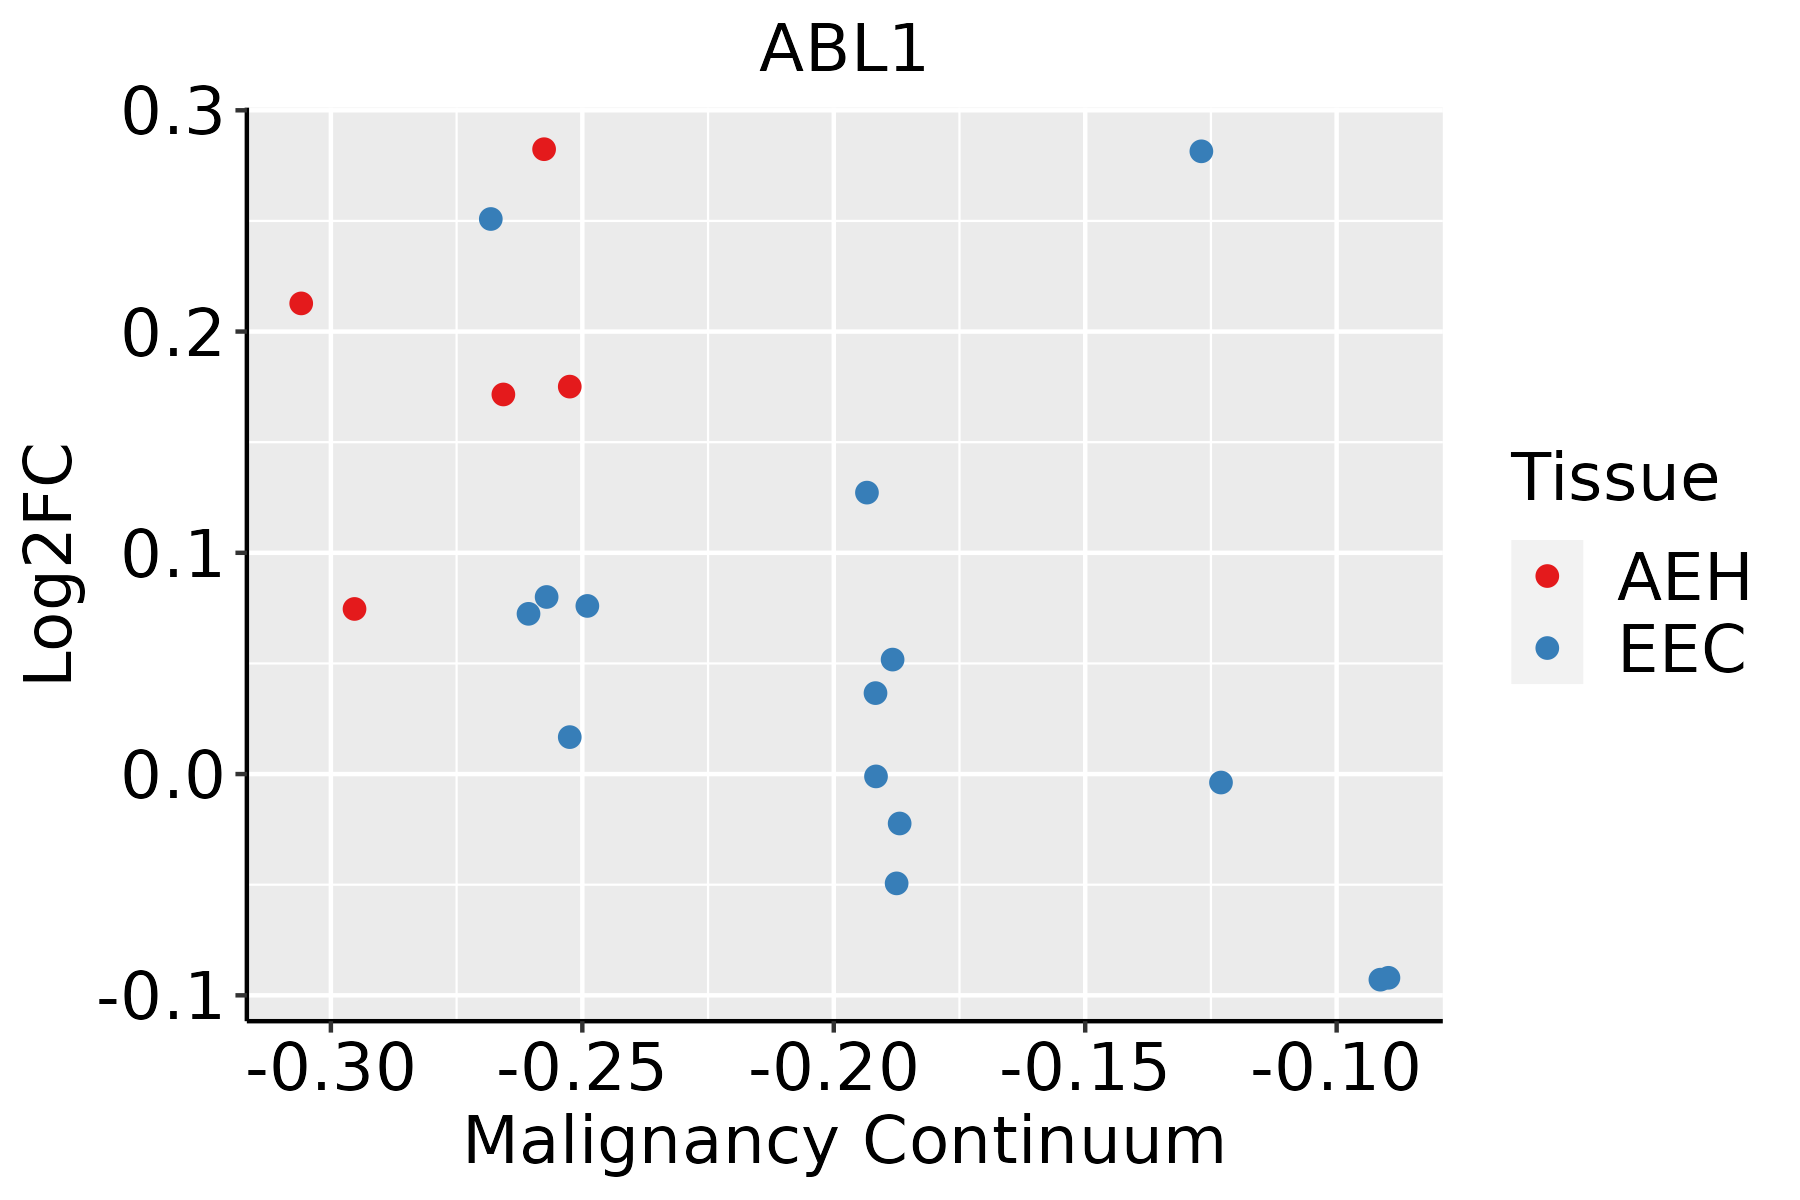 | AEH: Atypical endometrial hyperplasia |
| EEC: Endometrioid Cancer | ||
| Thyroid | 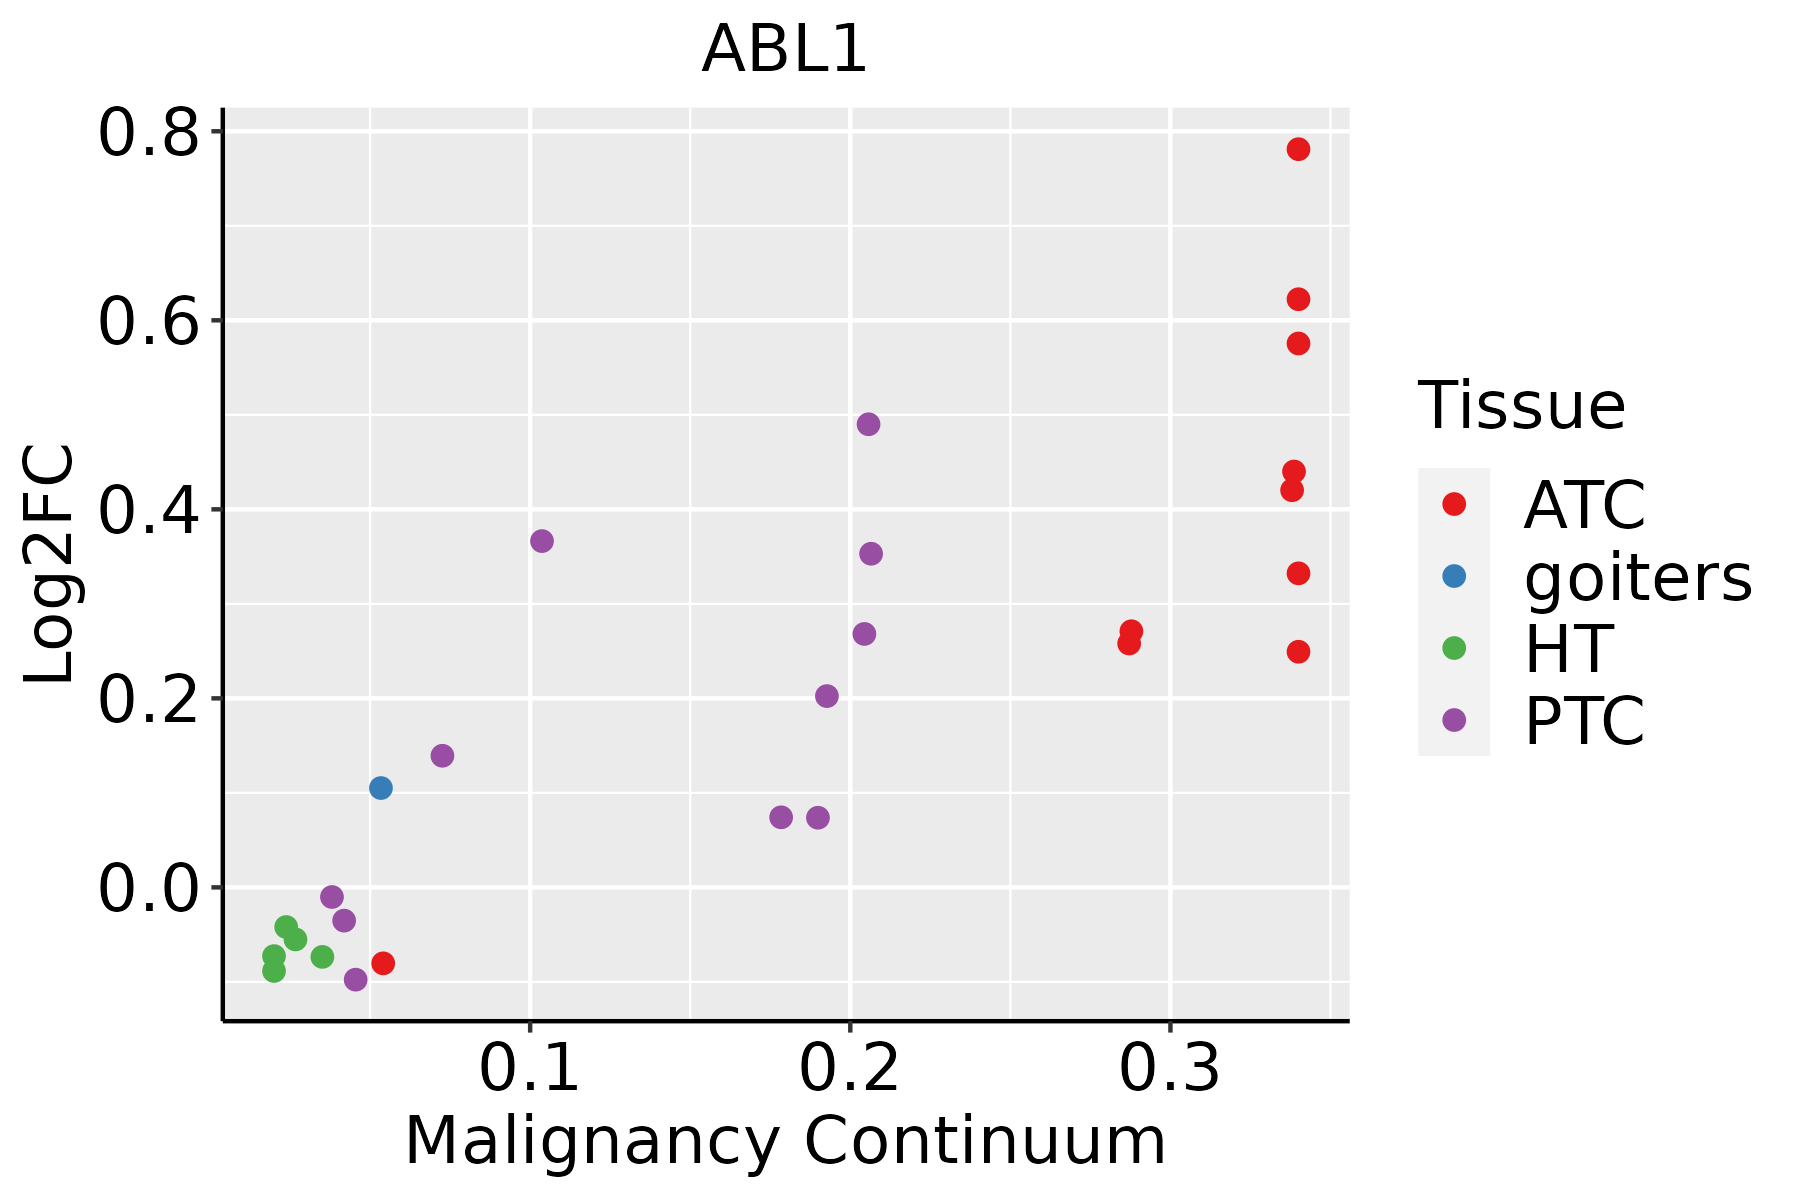 | ATC: Anaplastic thyroid cancer |
| HT: Hashimoto's thyroiditis | ||
| PTC: Papillary thyroid cancer |
| ∗log2FC in expression of this searched gene in stem-like cells from each diseased tissue sample relative to stem-like cells in normal samples in each tissue plotted against the malignancy continuum. Samples are colored based on if they are from different disease stage. |
Top |
Malignant transformation related pathway analysis |
| Find out the enriched GO biological processes and KEGG pathways involved in transition from healthy to precancer to cancer |
| Tissue | Disease Stage | Enriched GO biological Processes |
| Colorectum | AD |  |
| Colorectum | SER |  |
| Colorectum | MSS |  |
| Colorectum | MSI-H |  |
| Colorectum | FAP |  |
| ∗Top 15 enriched GO BP terms are showed in the bar plot of each disease state in each tissue. Each row represents a significant GO biological process which is colored according to the -log10(p.adjust). |
| Page: 1 2 3 4 5 6 7 8 9 |
| GO ID | Tissue | Disease Stage | Description | Gene Ratio | Bg Ratio | pvalue | p.adjust | Count |
| GO:00457852 | Colorectum | MSS | positive regulation of cell adhesion | 110/3467 | 437/18723 | 2.94e-04 | 3.87e-03 | 110 |
| GO:00015582 | Colorectum | MSS | regulation of cell growth | 105/3467 | 414/18723 | 2.97e-04 | 3.90e-03 | 105 |
| GO:00719002 | Colorectum | MSS | regulation of protein serine/threonine kinase activity | 93/3467 | 359/18723 | 2.98e-04 | 3.91e-03 | 93 |
| GO:00064692 | Colorectum | MSS | negative regulation of protein kinase activity | 60/3467 | 212/18723 | 3.08e-04 | 4.02e-03 | 60 |
| GO:00901322 | Colorectum | MSS | epithelium migration | 93/3467 | 360/18723 | 3.30e-04 | 4.24e-03 | 93 |
| GO:00106312 | Colorectum | MSS | epithelial cell migration | 92/3467 | 357/18723 | 3.87e-04 | 4.86e-03 | 92 |
| GO:00467772 | Colorectum | MSS | protein autophosphorylation | 63/3467 | 227/18723 | 3.96e-04 | 4.91e-03 | 63 |
| GO:00074092 | Colorectum | MSS | axonogenesis | 105/3467 | 418/18723 | 4.32e-04 | 5.23e-03 | 105 |
| GO:00425422 | Colorectum | MSS | response to hydrogen peroxide | 44/3467 | 146/18723 | 4.40e-04 | 5.30e-03 | 44 |
| GO:00320921 | Colorectum | MSS | positive regulation of protein binding | 29/3467 | 85/18723 | 4.44e-04 | 5.32e-03 | 29 |
| GO:19012142 | Colorectum | MSS | regulation of neuron death | 83/3467 | 319/18723 | 5.28e-04 | 5.99e-03 | 83 |
| GO:00615642 | Colorectum | MSS | axon development | 115/3467 | 467/18723 | 5.33e-04 | 6.00e-03 | 115 |
| GO:00106322 | Colorectum | MSS | regulation of epithelial cell migration | 77/3467 | 292/18723 | 5.39e-04 | 6.04e-03 | 77 |
| GO:00901302 | Colorectum | MSS | tissue migration | 93/3467 | 365/18723 | 5.42e-04 | 6.06e-03 | 93 |
| GO:00351481 | Colorectum | MSS | tube formation | 44/3467 | 148/18723 | 6.06e-04 | 6.68e-03 | 44 |
| GO:01501162 | Colorectum | MSS | regulation of cell-substrate junction organization | 25/3467 | 71/18723 | 6.31e-04 | 6.94e-03 | 25 |
| GO:00017631 | Colorectum | MSS | morphogenesis of a branching structure | 55/3467 | 196/18723 | 6.70e-04 | 7.25e-03 | 55 |
| GO:00480412 | Colorectum | MSS | focal adhesion assembly | 29/3467 | 87/18723 | 6.84e-04 | 7.37e-03 | 29 |
| GO:00106342 | Colorectum | MSS | positive regulation of epithelial cell migration | 50/3467 | 176/18723 | 8.50e-04 | 8.75e-03 | 50 |
| GO:00018381 | Colorectum | MSS | embryonic epithelial tube formation | 37/3467 | 121/18723 | 8.95e-04 | 9.13e-03 | 37 |
| Page: 1 2 3 4 5 6 7 8 9 10 11 12 13 14 15 16 17 18 19 20 21 22 23 24 25 26 27 28 29 30 31 32 33 34 35 36 37 38 39 40 41 42 43 44 45 46 47 48 49 50 51 52 53 54 55 56 57 58 59 60 61 62 63 64 65 66 67 68 69 70 71 72 73 74 75 76 77 78 79 80 |
| Pathway ID | Tissue | Disease Stage | Description | Gene Ratio | Bg Ratio | pvalue | p.adjust | qvalue | Count |
| hsa0520820 | Cervix | CC | Chemical carcinogenesis - reactive oxygen species | 92/1267 | 223/8465 | 4.71e-22 | 5.09e-20 | 3.01e-20 | 92 |
| hsa0513020 | Cervix | CC | Pathogenic Escherichia coli infection | 63/1267 | 197/8465 | 9.28e-10 | 2.00e-08 | 1.19e-08 | 63 |
| hsa0541620 | Cervix | CC | Viral myocarditis | 27/1267 | 60/8465 | 2.43e-08 | 3.57e-07 | 2.11e-07 | 27 |
| hsa0401210 | Cervix | CC | ErbB signaling pathway | 28/1267 | 85/8465 | 2.40e-05 | 1.82e-04 | 1.08e-04 | 28 |
| hsa043609 | Cervix | CC | Axon guidance | 47/1267 | 182/8465 | 8.13e-05 | 5.38e-04 | 3.18e-04 | 47 |
| hsa0472214 | Cervix | CC | Neurotrophin signaling pathway | 32/1267 | 119/8465 | 5.01e-04 | 2.42e-03 | 1.43e-03 | 32 |
| hsa0522014 | Cervix | CC | Chronic myeloid leukemia | 21/1267 | 76/8465 | 3.08e-03 | 1.19e-02 | 7.03e-03 | 21 |
| hsa040142 | Cervix | CC | Ras signaling pathway | 51/1267 | 236/8465 | 3.55e-03 | 1.34e-02 | 7.91e-03 | 51 |
| hsa041106 | Cervix | CC | Cell cycle | 36/1267 | 157/8465 | 4.94e-03 | 1.67e-02 | 9.86e-03 | 36 |
| hsa05208110 | Cervix | CC | Chemical carcinogenesis - reactive oxygen species | 92/1267 | 223/8465 | 4.71e-22 | 5.09e-20 | 3.01e-20 | 92 |
| hsa05130110 | Cervix | CC | Pathogenic Escherichia coli infection | 63/1267 | 197/8465 | 9.28e-10 | 2.00e-08 | 1.19e-08 | 63 |
| hsa05416110 | Cervix | CC | Viral myocarditis | 27/1267 | 60/8465 | 2.43e-08 | 3.57e-07 | 2.11e-07 | 27 |
| hsa0401213 | Cervix | CC | ErbB signaling pathway | 28/1267 | 85/8465 | 2.40e-05 | 1.82e-04 | 1.08e-04 | 28 |
| hsa0436012 | Cervix | CC | Axon guidance | 47/1267 | 182/8465 | 8.13e-05 | 5.38e-04 | 3.18e-04 | 47 |
| hsa0472215 | Cervix | CC | Neurotrophin signaling pathway | 32/1267 | 119/8465 | 5.01e-04 | 2.42e-03 | 1.43e-03 | 32 |
| hsa0522015 | Cervix | CC | Chronic myeloid leukemia | 21/1267 | 76/8465 | 3.08e-03 | 1.19e-02 | 7.03e-03 | 21 |
| hsa0401411 | Cervix | CC | Ras signaling pathway | 51/1267 | 236/8465 | 3.55e-03 | 1.34e-02 | 7.91e-03 | 51 |
| hsa0411013 | Cervix | CC | Cell cycle | 36/1267 | 157/8465 | 4.94e-03 | 1.67e-02 | 9.86e-03 | 36 |
| hsa05130 | Colorectum | AD | Pathogenic Escherichia coli infection | 79/2092 | 197/8465 | 1.05e-06 | 1.36e-05 | 8.65e-06 | 79 |
| hsa051301 | Colorectum | AD | Pathogenic Escherichia coli infection | 79/2092 | 197/8465 | 1.05e-06 | 1.36e-05 | 8.65e-06 | 79 |
| Page: 1 2 |
Top |
Cell-cell communication analysis |
| Identification of potential cell-cell interactions between two cell types and their ligand-receptor pairs for different disease states |
| Ligand | Receptor | LRpair | Pathway | Tissue | Disease Stage |
| Page: 1 |
Top |
Single-cell gene regulatory network inference analysis |
| Find out the significant the regulons (TFs) and the target genes of each regulon across cell types for different disease states |
| TF | Cell Type | Tissue | Disease Stage | Target Gene | RSS | Regulon Activity |
| ∗The dot plots of a searched regulon are shown for all cell subpopulations in each disease state of each tissue based on the regulon specific score inferred using pySCENIC and by calculating the average expression. |
| Page: 1 |
Top |
Somatic mutation of malignant transformation related genes |
| Annotation of somatic variants for genes involved in malignant transformation |
| Hugo Symbol | Variant Class | Variant Classification | dbSNP RS | HGVSc | HGVSp | HGVSp Short | SWISSPROT | BIOTYPE | SIFT | PolyPhen | Tumor Sample Barcode | Tissue | Histology | Sex | Age | Stage | Therapy Types | Drugs | Outcome |
| ABL1 | SNV | Missense_Mutation | c.1375N>C | p.Tyr459His | p.Y459H | P00519 | protein_coding | deleterious(0) | probably_damaging(0.999) | TCGA-A8-A094-01 | Breast | breast invasive carcinoma | Female | >=65 | I/II | Unknown | Unknown | SD | |
| ABL1 | SNV | Missense_Mutation | c.1819N>C | p.Glu607Gln | p.E607Q | P00519 | protein_coding | deleterious_low_confidence(0.02) | benign(0.315) | TCGA-AC-A23H-01 | Breast | breast invasive carcinoma | Female | >=65 | I/II | Unknown | Unknown | PD | |
| ABL1 | SNV | Missense_Mutation | rs780527035 | c.119N>G | p.Asn40Ser | p.N40S | P00519 | protein_coding | deleterious_low_confidence(0) | probably_damaging(0.97) | TCGA-AC-A3EH-01 | Breast | breast invasive carcinoma | Female | >=65 | III/IV | Unknown | Unknown | SD |
| ABL1 | SNV | Missense_Mutation | c.1503C>A | p.Asp501Glu | p.D501E | P00519 | protein_coding | tolerated(0.52) | benign(0.003) | TCGA-BH-A0B3-01 | Breast | breast invasive carcinoma | Female | <65 | I/II | Chemotherapy | cyclophosphamide | SD | |
| ABL1 | SNV | Missense_Mutation | c.268N>A | p.Asp90Asn | p.D90N | P00519 | protein_coding | deleterious(0.01) | probably_damaging(0.952) | TCGA-E2-A1LB-01 | Breast | breast invasive carcinoma | Female | <65 | I/II | Chemotherapy | cytoxan | SD | |
| ABL1 | SNV | Missense_Mutation | novel | c.1471A>T | p.Met491Leu | p.M491L | P00519 | protein_coding | deleterious(0) | possibly_damaging(0.792) | TCGA-E9-A54X-01 | Breast | breast invasive carcinoma | Female | >=65 | I/II | Unknown | Unknown | SD |
| ABL1 | insertion | Frame_Shift_Ins | novel | c.1125_1126insA | p.Asn377LysfsTer24 | p.N377Kfs*24 | P00519 | protein_coding | TCGA-AC-A23H-01 | Breast | breast invasive carcinoma | Female | >=65 | I/II | Unknown | Unknown | PD | ||
| ABL1 | deletion | Frame_Shift_Del | c.2409delC | p.Arg804GlyfsTer3 | p.R804Gfs*3 | P00519 | protein_coding | TCGA-AN-A0AK-01 | Breast | breast invasive carcinoma | Female | >=65 | I/II | Unknown | Unknown | SD | |||
| ABL1 | insertion | Nonsense_Mutation | novel | c.104_105insCCTGGCCTCGTTGTGGAGCGGCTCGTAATCCATCAT | p.Gly35_Gly36insLeuAlaSerLeuTrpSerGlySerTerSerIleMet | p.G35_G36insLASLWSGS*SIM | P00519 | protein_coding | TCGA-B6-A0IA-01 | Breast | breast invasive carcinoma | Female | <65 | I/II | Unknown | Unknown | SD | ||
| ABL1 | deletion | Frame_Shift_Del | novel | c.3216_3225delNNNNNNNNNN | p.Ser1073TrpfsTer12 | p.S1073Wfs*12 | P00519 | protein_coding | TCGA-B6-A2IU-01 | Breast | breast invasive carcinoma | Female | <65 | I/II | Unknown | Unknown | PD |
| Page: 1 2 3 4 5 6 7 8 9 10 |
Top |
Related drugs of malignant transformation related genes |
| Identification of chemicals and drugs interact with genes involved in malignant transfromation |
| (DGIdb 4.0) |
| Entrez ID | Symbol | Category | Interaction Types | Drug Claim Name | Drug Name | PMIDs |
| 25 | ABL1 | ENZYME, TYROSINE KINASE, TUMOR SUPPRESSOR, KINASE, CLINICALLY ACTIONABLE, DRUGGABLE GENOME, DRUG RESISTANCE | DASATINIB | DASATINIB | ||
| 25 | ABL1 | ENZYME, TYROSINE KINASE, TUMOR SUPPRESSOR, KINASE, CLINICALLY ACTIONABLE, DRUGGABLE GENOME, DRUG RESISTANCE | PAZOPANIB | PAZOPANIB | ||
| 25 | ABL1 | ENZYME, TYROSINE KINASE, TUMOR SUPPRESSOR, KINASE, CLINICALLY ACTIONABLE, DRUGGABLE GENOME, DRUG RESISTANCE | GENISTEIN | GENISTEIN | 9349317 | |
| 25 | ABL1 | ENZYME, TYROSINE KINASE, TUMOR SUPPRESSOR, KINASE, CLINICALLY ACTIONABLE, DRUGGABLE GENOME, DRUG RESISTANCE | inhibitor | 249565818 | ||
| 25 | ABL1 | ENZYME, TYROSINE KINASE, TUMOR SUPPRESSOR, KINASE, CLINICALLY ACTIONABLE, DRUGGABLE GENOME, DRUG RESISTANCE | Nilotinib | NILOTINIB | ||
| 25 | ABL1 | ENZYME, TYROSINE KINASE, TUMOR SUPPRESSOR, KINASE, CLINICALLY ACTIONABLE, DRUGGABLE GENOME, DRUG RESISTANCE | inhibitor | NILOTINIB | NILOTINIB | |
| 25 | ABL1 | ENZYME, TYROSINE KINASE, TUMOR SUPPRESSOR, KINASE, CLINICALLY ACTIONABLE, DRUGGABLE GENOME, DRUG RESISTANCE | vincristine | VINCRISTINE | ||
| 25 | ABL1 | ENZYME, TYROSINE KINASE, TUMOR SUPPRESSOR, KINASE, CLINICALLY ACTIONABLE, DRUGGABLE GENOME, DRUG RESISTANCE | NILOTINIB | NILOTINIB | ||
| 25 | ABL1 | ENZYME, TYROSINE KINASE, TUMOR SUPPRESSOR, KINASE, CLINICALLY ACTIONABLE, DRUGGABLE GENOME, DRUG RESISTANCE | Asciminib | ASCIMINIB | ||
| 25 | ABL1 | ENZYME, TYROSINE KINASE, TUMOR SUPPRESSOR, KINASE, CLINICALLY ACTIONABLE, DRUGGABLE GENOME, DRUG RESISTANCE | AZD0530 | SARACATINIB |
| Page: 1 2 3 4 5 6 7 8 9 10 11 12 13 14 15 16 17 18 |

Copyright 2023-Present -The University of Texas Health Science Center at Houston |