
|
|||||
|
 | |
| |
| |
| |
| |
| |
|
Gene: F3 |
Gene summary for F3 |
| Gene information | Species | Human | Gene symbol | F3 | Gene ID | 2152 |
| Gene name | coagulation factor III, tissue factor | |
| Gene Alias | CD142 | |
| Cytomap | 1p21.3 | |
| Gene Type | protein-coding | GO ID | GO:0001525 | UniProtAcc | P13726 |
Top |
Malignant transformation analysis |
| Identification of the aberrant gene expression in precancerous and cancerous lesions by comparing the gene expression of stem-like cells in diseased tissues with normal stem cells |
| Entrez ID | Symbol | Replicates | Species | Organ | Tissue | Adj P-value | Log2FC | Malignancy |
| 2152 | F3 | CA_HPV_2 | Human | Cervix | CC | 2.21e-04 | 3.30e-01 | 0.0391 |
| 2152 | F3 | CCI_1 | Human | Cervix | CC | 4.25e-04 | 7.51e-01 | 0.528 |
| 2152 | F3 | Tumor | Human | Cervix | CC | 2.51e-08 | 3.34e-01 | 0.1241 |
| 2152 | F3 | sample3 | Human | Cervix | CC | 1.32e-32 | 7.49e-01 | 0.1387 |
| 2152 | F3 | H2 | Human | Cervix | HSIL_HPV | 5.58e-23 | 6.21e-01 | 0.0632 |
| 2152 | F3 | L1 | Human | Cervix | CC | 4.16e-03 | 3.84e-01 | 0.0802 |
| 2152 | F3 | T1 | Human | Cervix | CC | 3.80e-04 | 2.82e-01 | 0.0918 |
| 2152 | F3 | T2 | Human | Cervix | CC | 4.70e-03 | 3.29e-01 | 0.0709 |
| 2152 | F3 | T3 | Human | Cervix | CC | 3.43e-27 | 7.34e-01 | 0.1389 |
| 2152 | F3 | LZE4T | Human | Esophagus | ESCC | 4.67e-04 | -1.98e-01 | 0.0811 |
| 2152 | F3 | LZE8T | Human | Esophagus | ESCC | 3.73e-02 | 2.27e-01 | 0.067 |
| 2152 | F3 | LZE20T | Human | Esophagus | ESCC | 1.08e-05 | 1.04e+00 | 0.0662 |
| 2152 | F3 | LZE24T | Human | Esophagus | ESCC | 8.28e-12 | 1.22e+00 | 0.0596 |
| 2152 | F3 | LZE21T | Human | Esophagus | ESCC | 6.51e-06 | 4.12e-01 | 0.0655 |
| 2152 | F3 | P5T-E | Human | Esophagus | ESCC | 6.01e-12 | 6.22e-01 | 0.1327 |
| 2152 | F3 | P8T-E | Human | Esophagus | ESCC | 3.03e-74 | 1.85e+00 | 0.0889 |
| 2152 | F3 | P9T-E | Human | Esophagus | ESCC | 1.42e-03 | 4.90e-01 | 0.1131 |
| 2152 | F3 | P10T-E | Human | Esophagus | ESCC | 7.83e-07 | -2.19e-02 | 0.116 |
| 2152 | F3 | P11T-E | Human | Esophagus | ESCC | 2.87e-07 | 1.55e+00 | 0.1426 |
| 2152 | F3 | P12T-E | Human | Esophagus | ESCC | 6.72e-55 | 1.65e+00 | 0.1122 |
| Page: 1 2 3 4 5 6 |
| Tissue | Expression Dynamics | Abbreviation |
| Cervix | 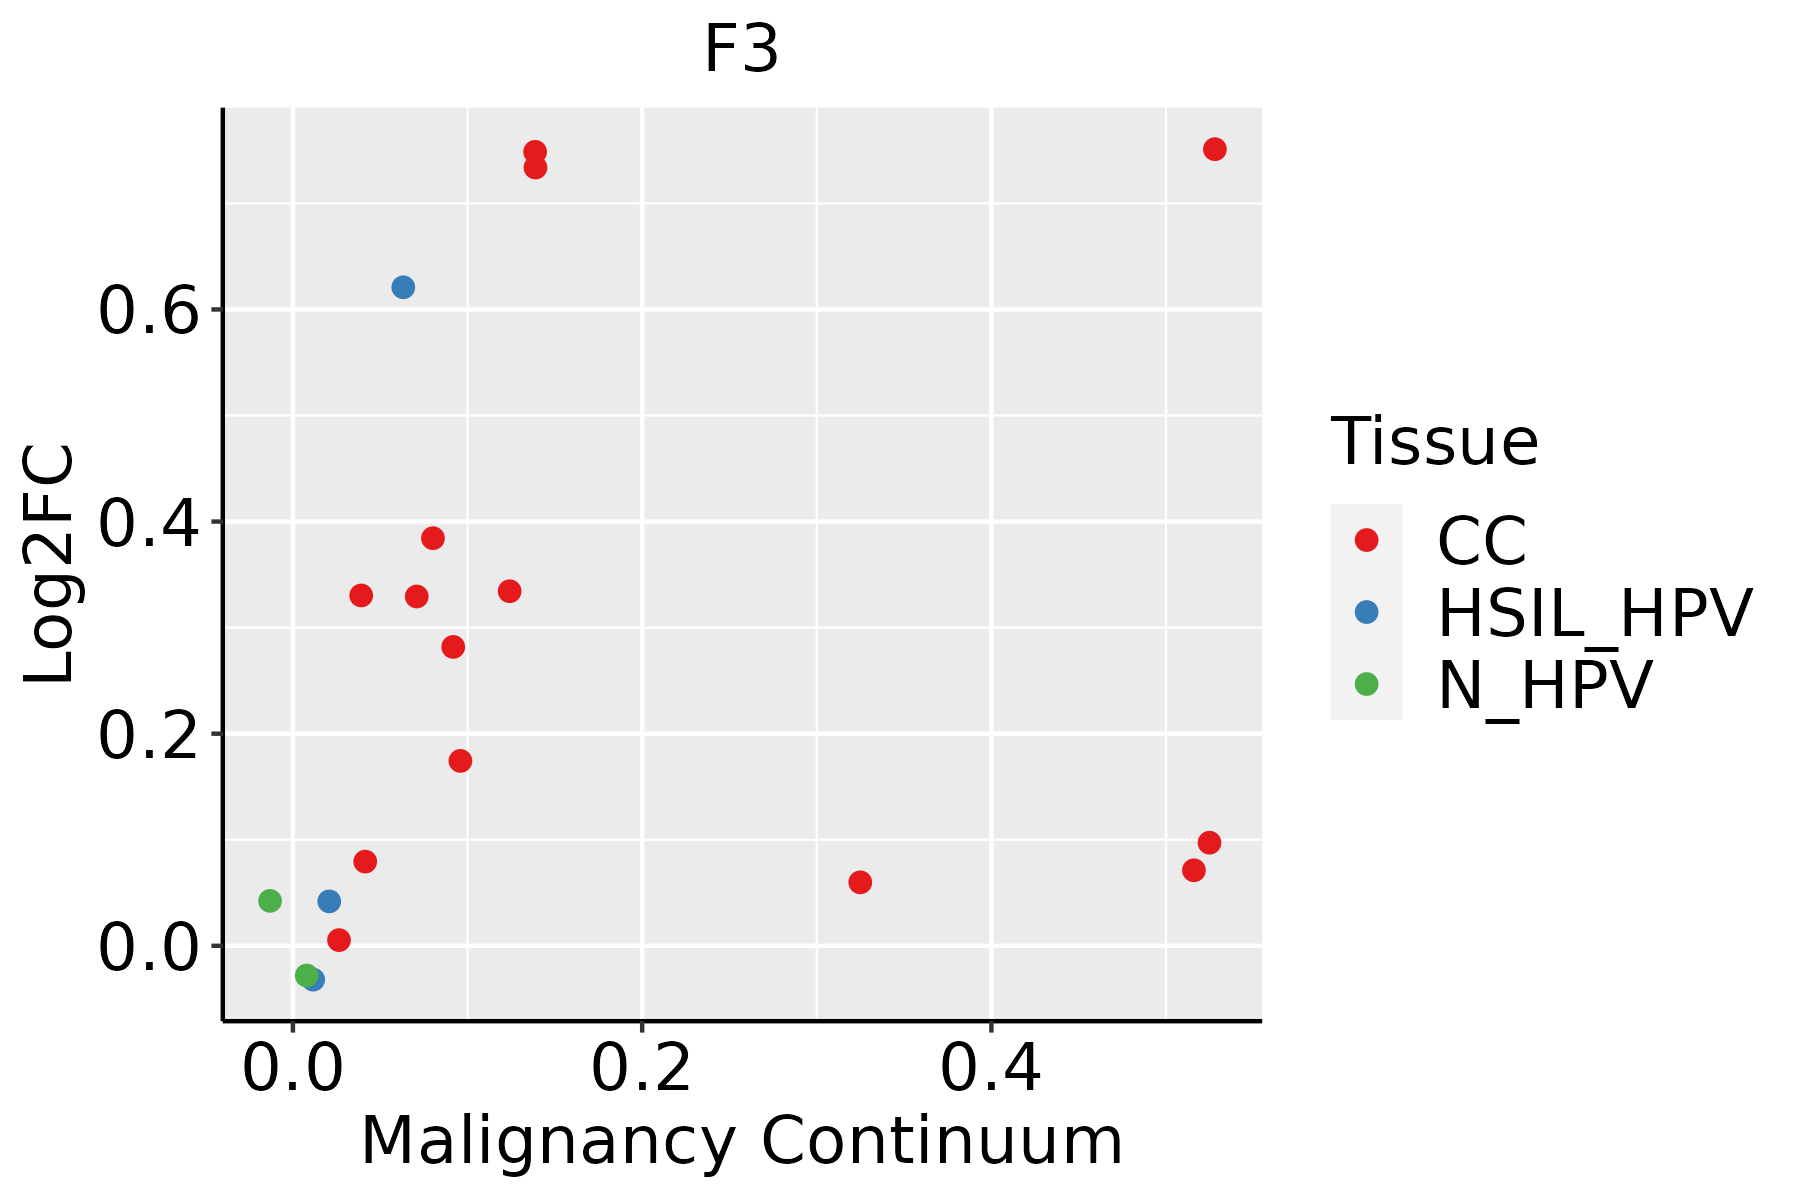 | CC: Cervix cancer |
| HSIL_HPV: HPV-infected high-grade squamous intraepithelial lesions | ||
| N_HPV: HPV-infected normal cervix | ||
| Esophagus | 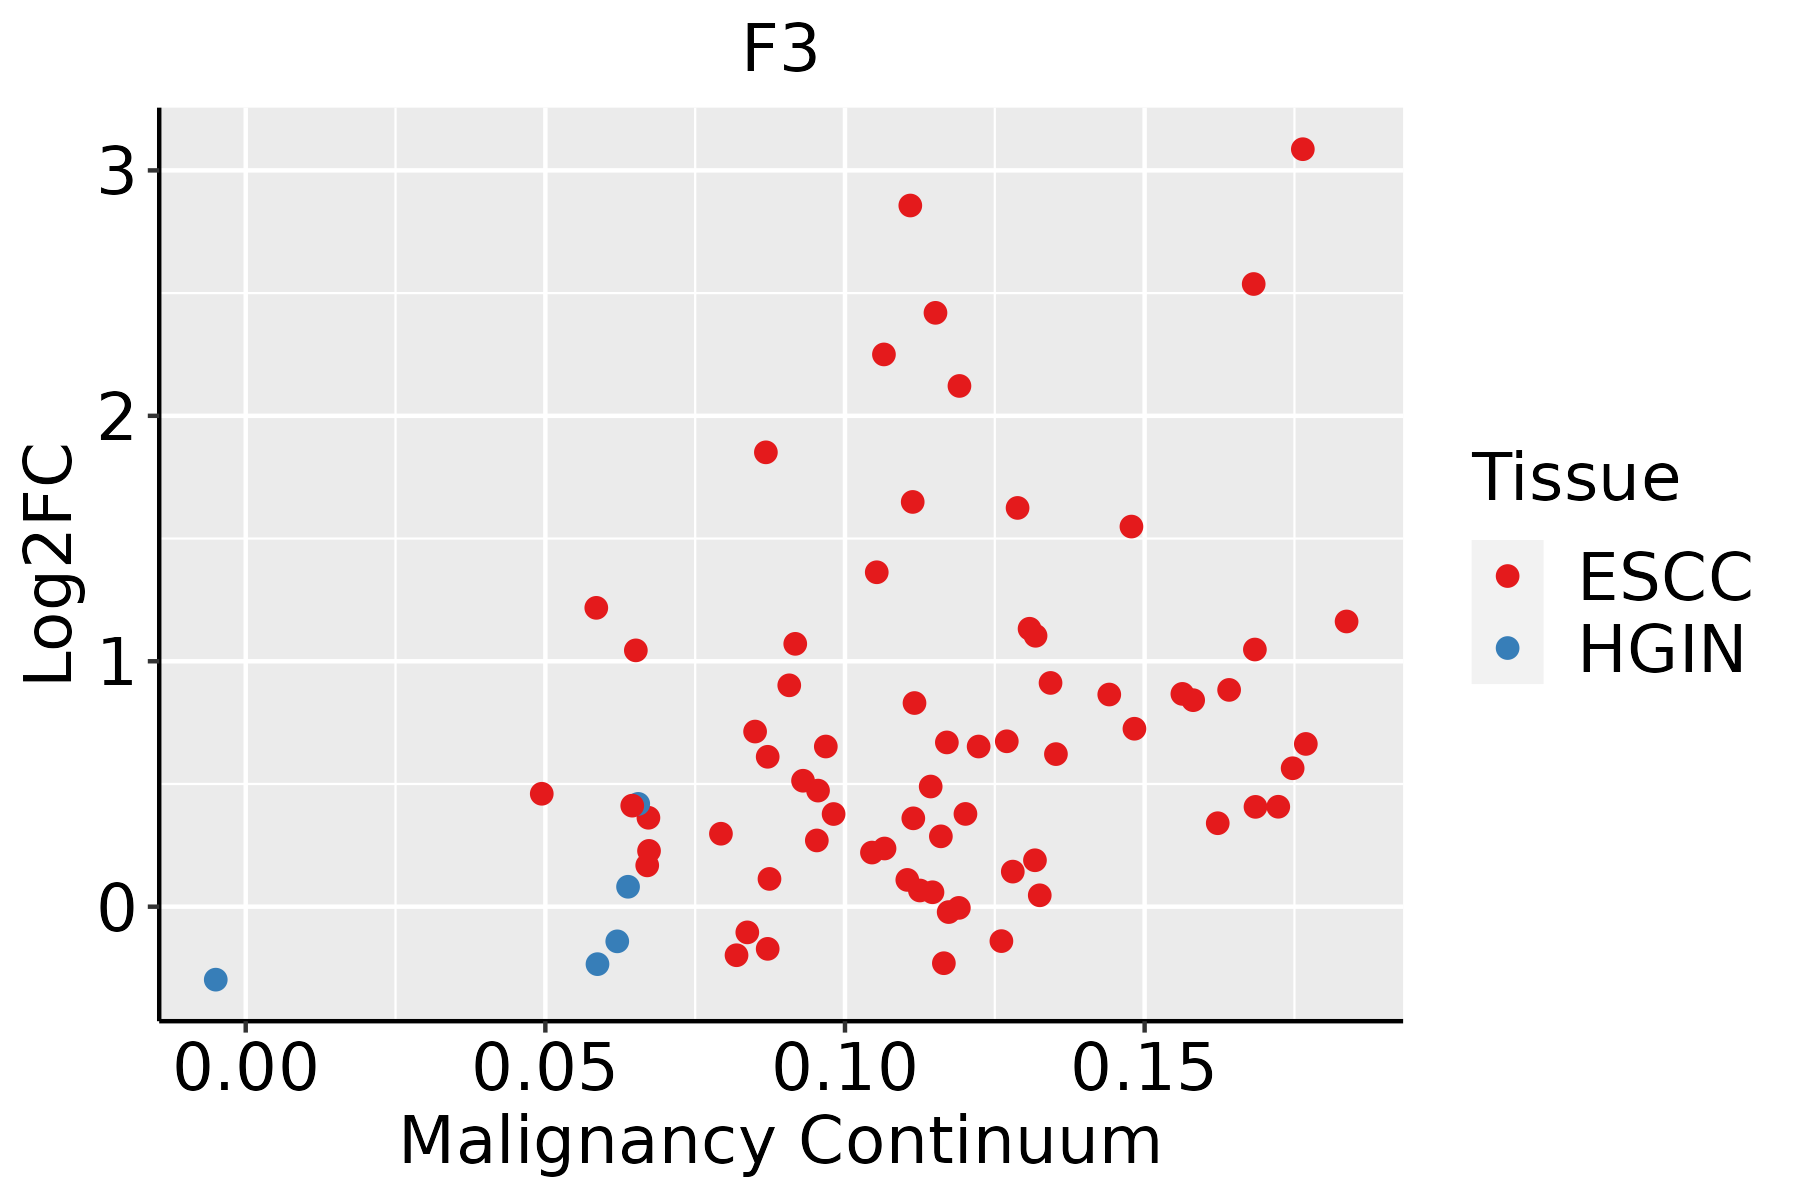 | ESCC: Esophageal squamous cell carcinoma |
| HGIN: High-grade intraepithelial neoplasias | ||
| LGIN: Low-grade intraepithelial neoplasias | ||
| Oral Cavity |  | EOLP: Erosive Oral lichen planus |
| LP: leukoplakia | ||
| NEOLP: Non-erosive oral lichen planus | ||
| OSCC: Oral squamous cell carcinoma | ||
| Prostate | 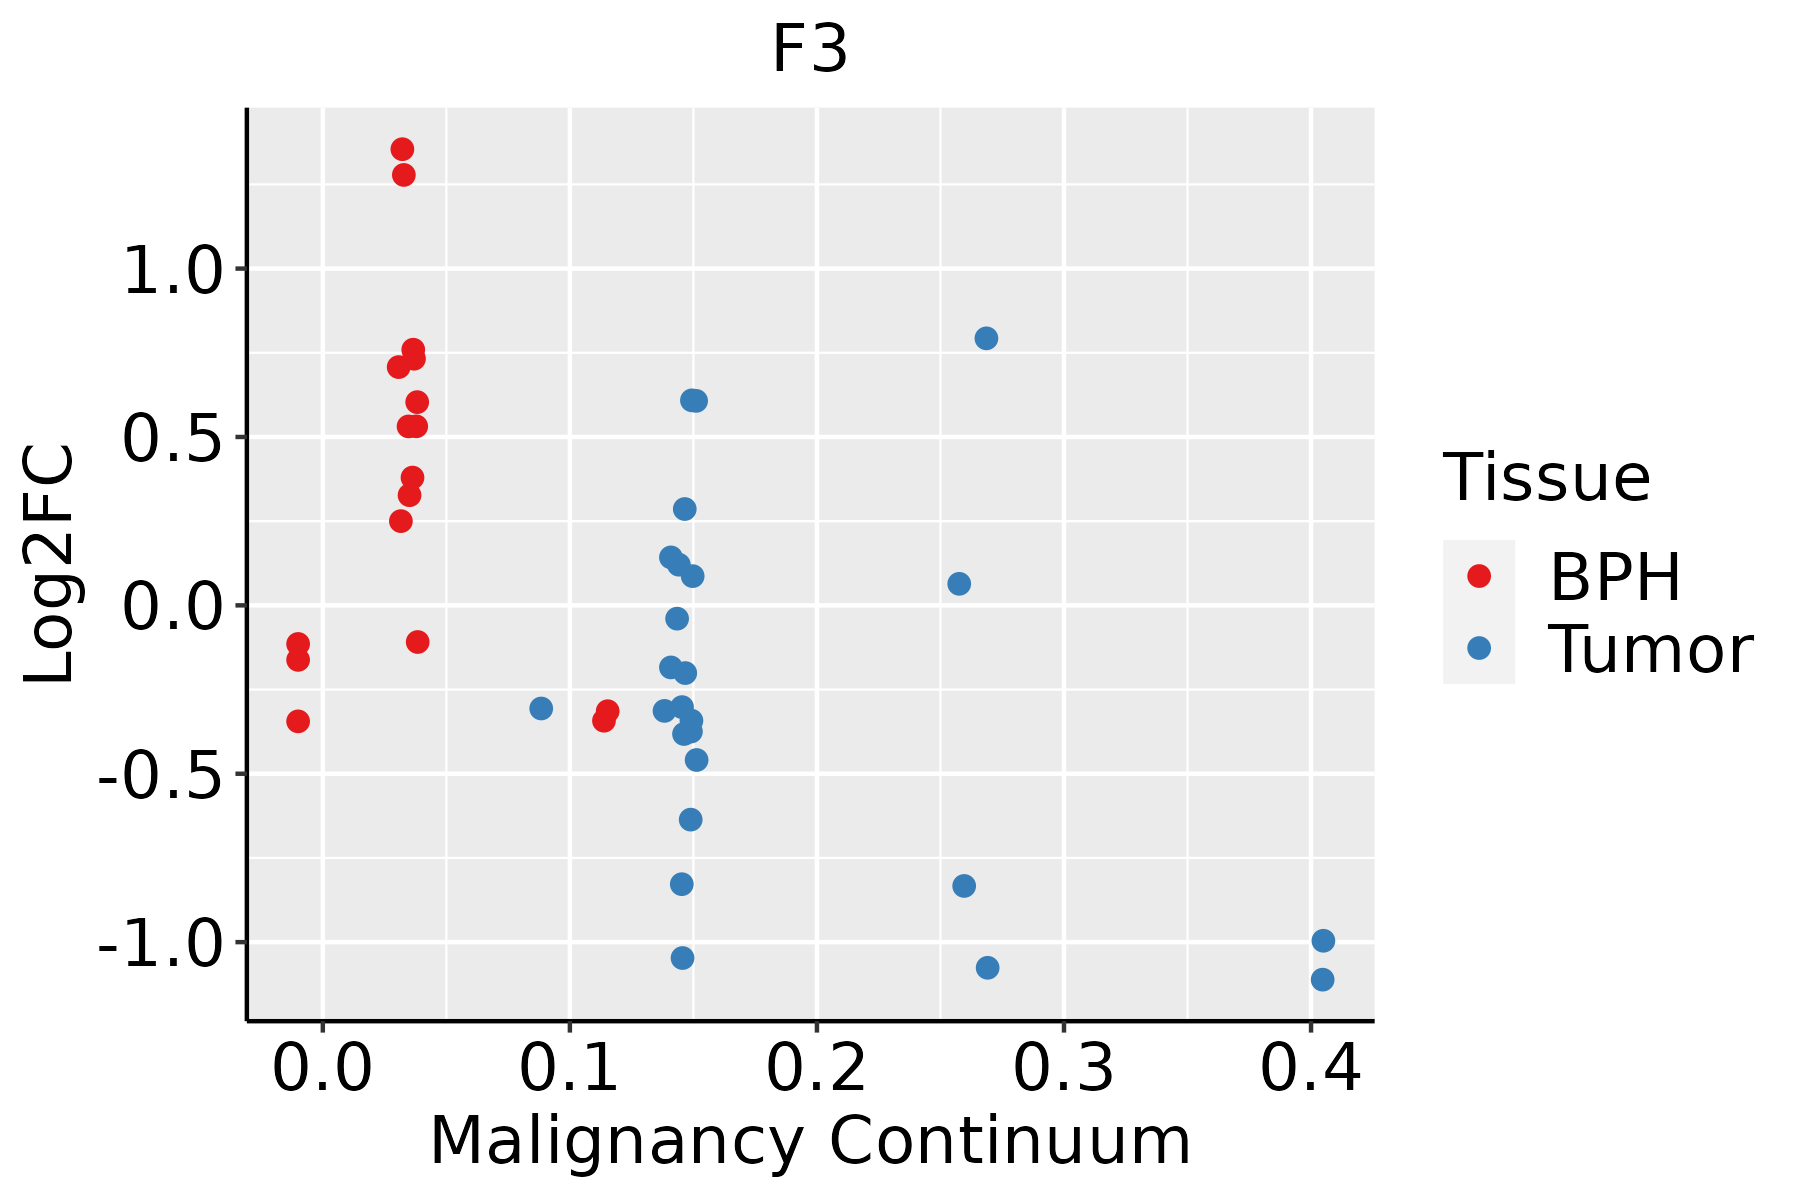 | BPH: Benign Prostatic Hyperplasia |
| Skin | 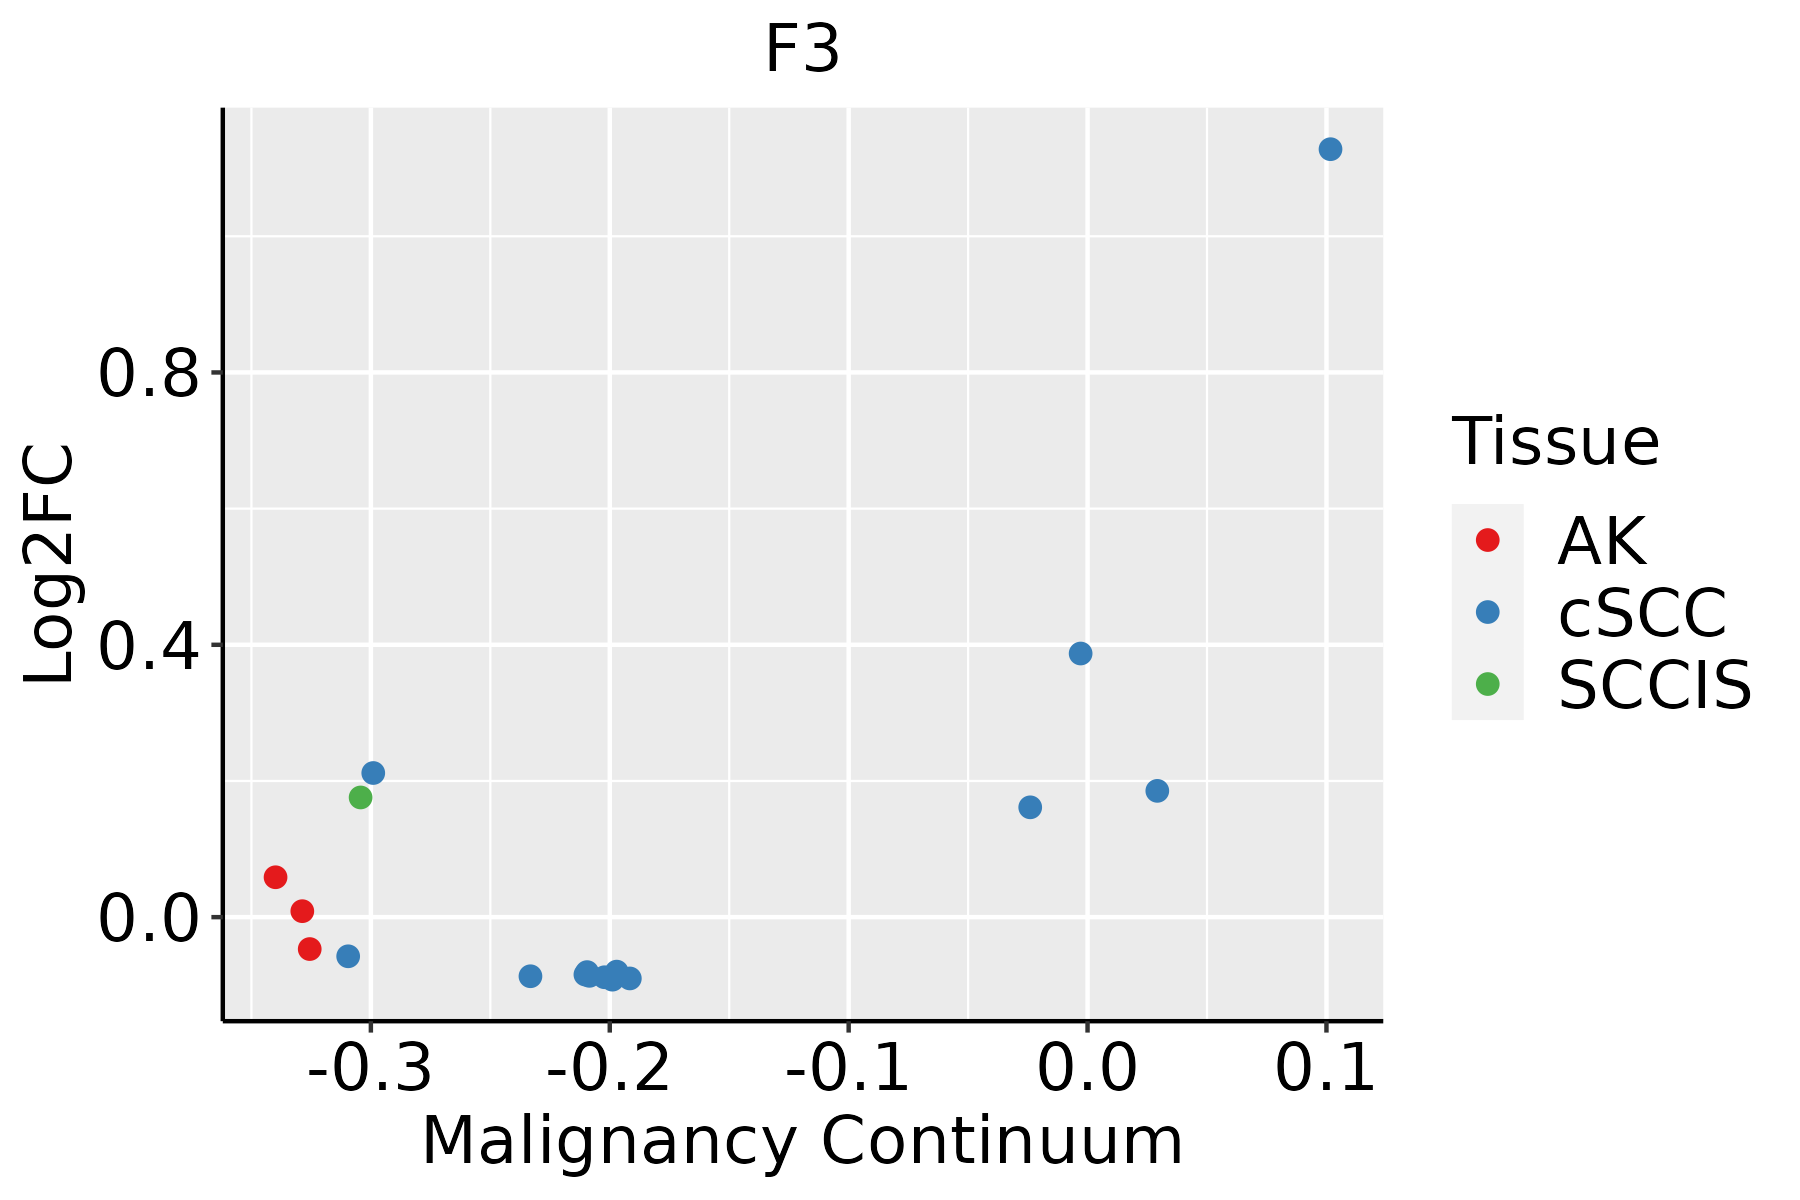 | AK: Actinic keratosis |
| cSCC: Cutaneous squamous cell carcinoma | ||
| SCCIS:squamous cell carcinoma in situ | ||
| Thyroid | 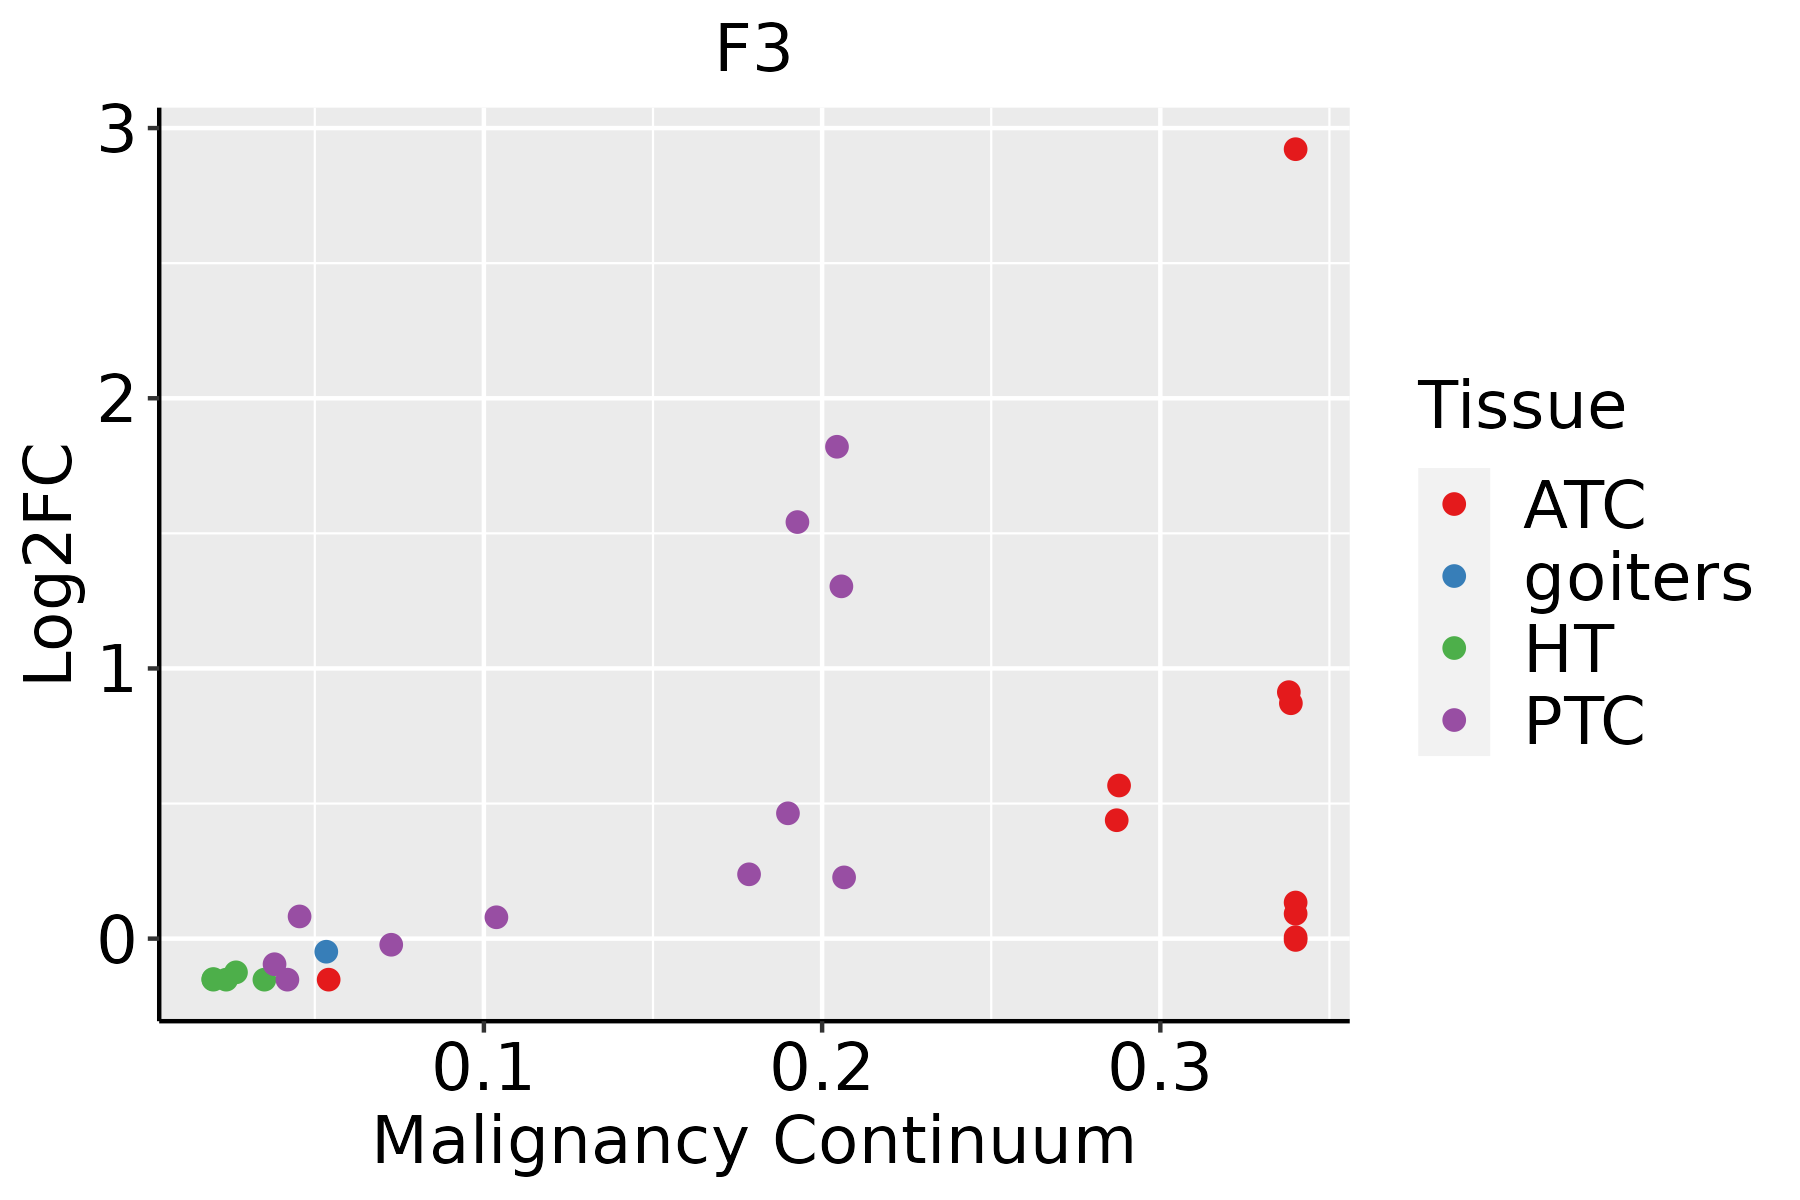 | ATC: Anaplastic thyroid cancer |
| HT: Hashimoto's thyroiditis | ||
| PTC: Papillary thyroid cancer |
| ∗log2FC in expression of this searched gene in stem-like cells from each diseased tissue sample relative to stem-like cells in normal samples in each tissue plotted against the malignancy continuum. Samples are colored based on if they are from different disease stage. |
Top |
Malignant transformation related pathway analysis |
| Find out the enriched GO biological processes and KEGG pathways involved in transition from healthy to precancer to cancer |
| Tissue | Disease Stage | Enriched GO biological Processes |
| Colorectum | AD |  |
| Colorectum | SER |  |
| Colorectum | MSS |  |
| Colorectum | MSI-H |  |
| Colorectum | FAP |  |
| ∗Top 15 enriched GO BP terms are showed in the bar plot of each disease state in each tissue. Each row represents a significant GO biological process which is colored according to the -log10(p.adjust). |
| Page: 1 2 3 4 5 6 7 8 9 |
| GO ID | Tissue | Disease Stage | Description | Gene Ratio | Bg Ratio | pvalue | p.adjust | Count |
| GO:007135616 | Prostate | BPH | cellular response to tumor necrosis factor | 60/3107 | 229/18723 | 1.42e-04 | 1.26e-03 | 60 |
| GO:004506910 | Prostate | BPH | regulation of viral genome replication | 28/3107 | 85/18723 | 1.65e-04 | 1.43e-03 | 28 |
| GO:19017997 | Prostate | BPH | negative regulation of proteasomal protein catabolic process | 19/3107 | 49/18723 | 1.70e-04 | 1.46e-03 | 19 |
| GO:19909282 | Prostate | BPH | response to amino acid starvation | 19/3107 | 49/18723 | 1.70e-04 | 1.46e-03 | 19 |
| GO:00084063 | Prostate | BPH | gonad development | 58/3107 | 221/18723 | 1.73e-04 | 1.48e-03 | 58 |
| GO:00434106 | Prostate | BPH | positive regulation of MAPK cascade | 110/3107 | 480/18723 | 1.81e-04 | 1.53e-03 | 110 |
| GO:00070525 | Prostate | BPH | mitotic spindle organization | 36/3107 | 120/18723 | 1.83e-04 | 1.54e-03 | 36 |
| GO:00147066 | Prostate | BPH | striated muscle tissue development | 91/3107 | 384/18723 | 1.90e-04 | 1.57e-03 | 91 |
| GO:00341982 | Prostate | BPH | cellular response to amino acid starvation | 18/3107 | 46/18723 | 2.19e-04 | 1.78e-03 | 18 |
| GO:00080888 | Prostate | BPH | axo-dendritic transport | 25/3107 | 75/18723 | 2.94e-04 | 2.28e-03 | 25 |
| GO:005087817 | Prostate | BPH | regulation of body fluid levels | 89/3107 | 379/18723 | 3.08e-04 | 2.37e-03 | 89 |
| GO:00506796 | Prostate | BPH | positive regulation of epithelial cell proliferation | 54/3107 | 207/18723 | 3.33e-04 | 2.52e-03 | 54 |
| GO:00451373 | Prostate | BPH | development of primary sexual characteristics | 58/3107 | 227/18723 | 3.67e-04 | 2.71e-03 | 58 |
| GO:00075483 | Prostate | BPH | sex differentiation | 68/3107 | 276/18723 | 3.75e-04 | 2.76e-03 | 68 |
| GO:00510906 | Prostate | BPH | regulation of DNA-binding transcription factor activity | 100/3107 | 440/18723 | 4.71e-04 | 3.37e-03 | 100 |
| GO:00072547 | Prostate | BPH | JNK cascade | 45/3107 | 167/18723 | 4.74e-04 | 3.39e-03 | 45 |
| GO:00018199 | Prostate | BPH | positive regulation of cytokine production | 105/3107 | 467/18723 | 5.18e-04 | 3.66e-03 | 105 |
| GO:00903075 | Prostate | BPH | mitotic spindle assembly | 22/3107 | 65/18723 | 5.23e-04 | 3.68e-03 | 22 |
| GO:19904405 | Prostate | BPH | positive regulation of transcription from RNA polymerase II promoter in response to endoplasmic reticulum stress | 7/3107 | 11/18723 | 6.10e-04 | 4.16e-03 | 7 |
| GO:00070516 | Prostate | BPH | spindle organization | 48/3107 | 184/18723 | 6.91e-04 | 4.60e-03 | 48 |
| Pathway ID | Tissue | Disease Stage | Description | Gene Ratio | Bg Ratio | pvalue | p.adjust | qvalue | Count |
| hsa049336 | Cervix | CC | AGE-RAGE signaling pathway in diabetic complications | 25/1267 | 100/8465 | 5.64e-03 | 1.88e-02 | 1.11e-02 | 25 |
| hsa0493313 | Cervix | CC | AGE-RAGE signaling pathway in diabetic complications | 25/1267 | 100/8465 | 5.64e-03 | 1.88e-02 | 1.11e-02 | 25 |
| hsa0493310 | Esophagus | ESCC | AGE-RAGE signaling pathway in diabetic complications | 72/4205 | 100/8465 | 4.15e-06 | 2.28e-05 | 1.17e-05 | 72 |
| hsa0493317 | Esophagus | ESCC | AGE-RAGE signaling pathway in diabetic complications | 72/4205 | 100/8465 | 4.15e-06 | 2.28e-05 | 1.17e-05 | 72 |
| hsa049339 | Oral cavity | OSCC | AGE-RAGE signaling pathway in diabetic complications | 69/3704 | 100/8465 | 2.61e-07 | 1.65e-06 | 8.41e-07 | 69 |
| hsa0493316 | Oral cavity | OSCC | AGE-RAGE signaling pathway in diabetic complications | 69/3704 | 100/8465 | 2.61e-07 | 1.65e-06 | 8.41e-07 | 69 |
| hsa049338 | Prostate | BPH | AGE-RAGE signaling pathway in diabetic complications | 36/1718 | 100/8465 | 1.82e-04 | 1.02e-03 | 6.30e-04 | 36 |
| hsa0493315 | Prostate | BPH | AGE-RAGE signaling pathway in diabetic complications | 36/1718 | 100/8465 | 1.82e-04 | 1.02e-03 | 6.30e-04 | 36 |
| hsa0493322 | Prostate | Tumor | AGE-RAGE signaling pathway in diabetic complications | 33/1791 | 100/8465 | 3.79e-03 | 1.36e-02 | 8.46e-03 | 33 |
| hsa0493332 | Prostate | Tumor | AGE-RAGE signaling pathway in diabetic complications | 33/1791 | 100/8465 | 3.79e-03 | 1.36e-02 | 8.46e-03 | 33 |
| Page: 1 |
Top |
Cell-cell communication analysis |
| Identification of potential cell-cell interactions between two cell types and their ligand-receptor pairs for different disease states |
| Ligand | Receptor | LRpair | Pathway | Tissue | Disease Stage |
| CSF3 | CSF3R | CSF3_CSF3R | CSF3 | Breast | Healthy |
| CSF3 | CSF3R | CSF3_CSF3R | CSF3 | Cervix | ADJ |
| CSF3 | CSF3R | CSF3_CSF3R | CSF3 | Cervix | CC |
| CSF3 | CSF3R | CSF3_CSF3R | CSF3 | Cervix | Healthy |
| CSF3 | CSF3R | CSF3_CSF3R | CSF3 | Endometrium | EEC |
| CSF3 | CSF3R | CSF3_CSF3R | CSF3 | Esophagus | ESCC |
| CSF3 | CSF3R | CSF3_CSF3R | CSF3 | HNSCC | ADJ |
| CSF3 | CSF3R | CSF3_CSF3R | CSF3 | HNSCC | OSCC |
| CSF3 | CSF3R | CSF3_CSF3R | CSF3 | HNSCC | Precancer |
| CSF3 | CSF3R | CSF3_CSF3R | CSF3 | Prostate | BPH |
| CSF3 | CSF3R | CSF3_CSF3R | CSF3 | Prostate | Healthy |
| Page: 1 |
Top |
Single-cell gene regulatory network inference analysis |
| Find out the significant the regulons (TFs) and the target genes of each regulon across cell types for different disease states |
| TF | Cell Type | Tissue | Disease Stage | Target Gene | RSS | Regulon Activity |
| ∗The dot plots of a searched regulon are shown for all cell subpopulations in each disease state of each tissue based on the regulon specific score inferred using pySCENIC and by calculating the average expression. |
| Page: 1 |
Top |
Somatic mutation of malignant transformation related genes |
| Annotation of somatic variants for genes involved in malignant transformation |
| Hugo Symbol | Variant Class | Variant Classification | dbSNP RS | HGVSc | HGVSp | HGVSp Short | SWISSPROT | BIOTYPE | SIFT | PolyPhen | Tumor Sample Barcode | Tissue | Histology | Sex | Age | Stage | Therapy Types | Drugs | Outcome |
| F3 | SNV | Missense_Mutation | novel | c.404N>G | p.Tyr135Cys | p.Y135C | P13726 | protein_coding | deleterious(0) | probably_damaging(0.974) | TCGA-5M-AAT6-01 | Colorectum | colon adenocarcinoma | Female | <65 | III/IV | Unknown | Unknown | PD |
| F3 | SNV | Missense_Mutation | c.521N>A | p.Ser174Asn | p.S174N | P13726 | protein_coding | deleterious(0.02) | possibly_damaging(0.772) | TCGA-AA-3858-01 | Colorectum | colon adenocarcinoma | Male | >=65 | I/II | Unknown | Unknown | SD | |
| F3 | SNV | Missense_Mutation | novel | c.127A>G | p.Asn43Asp | p.N43D | P13726 | protein_coding | deleterious(0.04) | possibly_damaging(0.479) | TCGA-AG-A002-01 | Colorectum | rectum adenocarcinoma | Male | <65 | I/II | Unknown | Unknown | SD |
| F3 | SNV | Missense_Mutation | c.529G>T | p.Asp177Tyr | p.D177Y | P13726 | protein_coding | deleterious(0) | probably_damaging(0.964) | TCGA-EI-6513-01 | Colorectum | rectum adenocarcinoma | Male | <65 | III/IV | Unknown | Unknown | SD | |
| F3 | deletion | In_Frame_Del | c.326_328delCCT | p.Ser109del | p.S109del | P13726 | protein_coding | TCGA-AG-A02N-01 | Colorectum | rectum adenocarcinoma | Male | >=65 | I/II | Chemotherapy | folinic | CR | |||
| F3 | SNV | Missense_Mutation | rs187119941 | c.475G>A | p.Val159Ile | p.V159I | P13726 | protein_coding | tolerated(0.33) | benign(0.04) | TCGA-A5-A0R7-01 | Endometrium | uterine corpus endometrioid carcinoma | Female | <65 | I/II | Unknown | Unknown | SD |
| F3 | SNV | Missense_Mutation | c.242N>T | p.Cys81Phe | p.C81F | P13726 | protein_coding | deleterious(0) | probably_damaging(1) | TCGA-AP-A0LM-01 | Endometrium | uterine corpus endometrioid carcinoma | Female | <65 | III/IV | Chemotherapy | cisplatin | SD | |
| F3 | SNV | Missense_Mutation | rs759484806 | c.421G>A | p.Gly141Arg | p.G141R | P13726 | protein_coding | deleterious(0) | probably_damaging(0.996) | TCGA-AX-A2HD-01 | Endometrium | uterine corpus endometrioid carcinoma | Female | >=65 | III/IV | Unknown | Unknown | SD |
| F3 | SNV | Missense_Mutation | novel | c.509A>C | p.Asn170Thr | p.N170T | P13726 | protein_coding | deleterious(0) | benign(0) | TCGA-B5-A3FC-01 | Endometrium | uterine corpus endometrioid carcinoma | Female | <65 | I/II | Unknown | Unknown | SD |
| F3 | SNV | Missense_Mutation | novel | c.334G>A | p.Ala112Thr | p.A112T | P13726 | protein_coding | tolerated(0.45) | benign(0.062) | TCGA-B5-A3FC-01 | Endometrium | uterine corpus endometrioid carcinoma | Female | <65 | I/II | Unknown | Unknown | SD |
| Page: 1 2 3 |
Top |
Related drugs of malignant transformation related genes |
| Identification of chemicals and drugs interact with genes involved in malignant transfromation |
| (DGIdb 4.0) |
| Entrez ID | Symbol | Category | Interaction Types | Drug Claim Name | Drug Name | PMIDs |
| 2152 | F3 | DRUGGABLE GENOME, CELL SURFACE | ALT-836 | |||
| 2152 | F3 | DRUGGABLE GENOME, CELL SURFACE | MORAb-066 | |||
| 2152 | F3 | DRUGGABLE GENOME, CELL SURFACE | TT-173 | |||
| 2152 | F3 | DRUGGABLE GENOME, CELL SURFACE | simvastatin | SIMVASTATIN | 19027114 |
| Page: 1 |

Copyright 2023-Present -The University of Texas Health Science Center at Houston |