| Tissue | Expression Dynamics | Abbreviation |
| Colorectum (GSE201348) |  | FAP: Familial adenomatous polyposis |
| CRC: Colorectal cancer |
| Colorectum (HTA11) |  | AD: Adenomas |
| SER: Sessile serrated lesions |
| MSI-H: Microsatellite-high colorectal cancer |
| MSS: Microsatellite stable colorectal cancer |
| Esophagus | 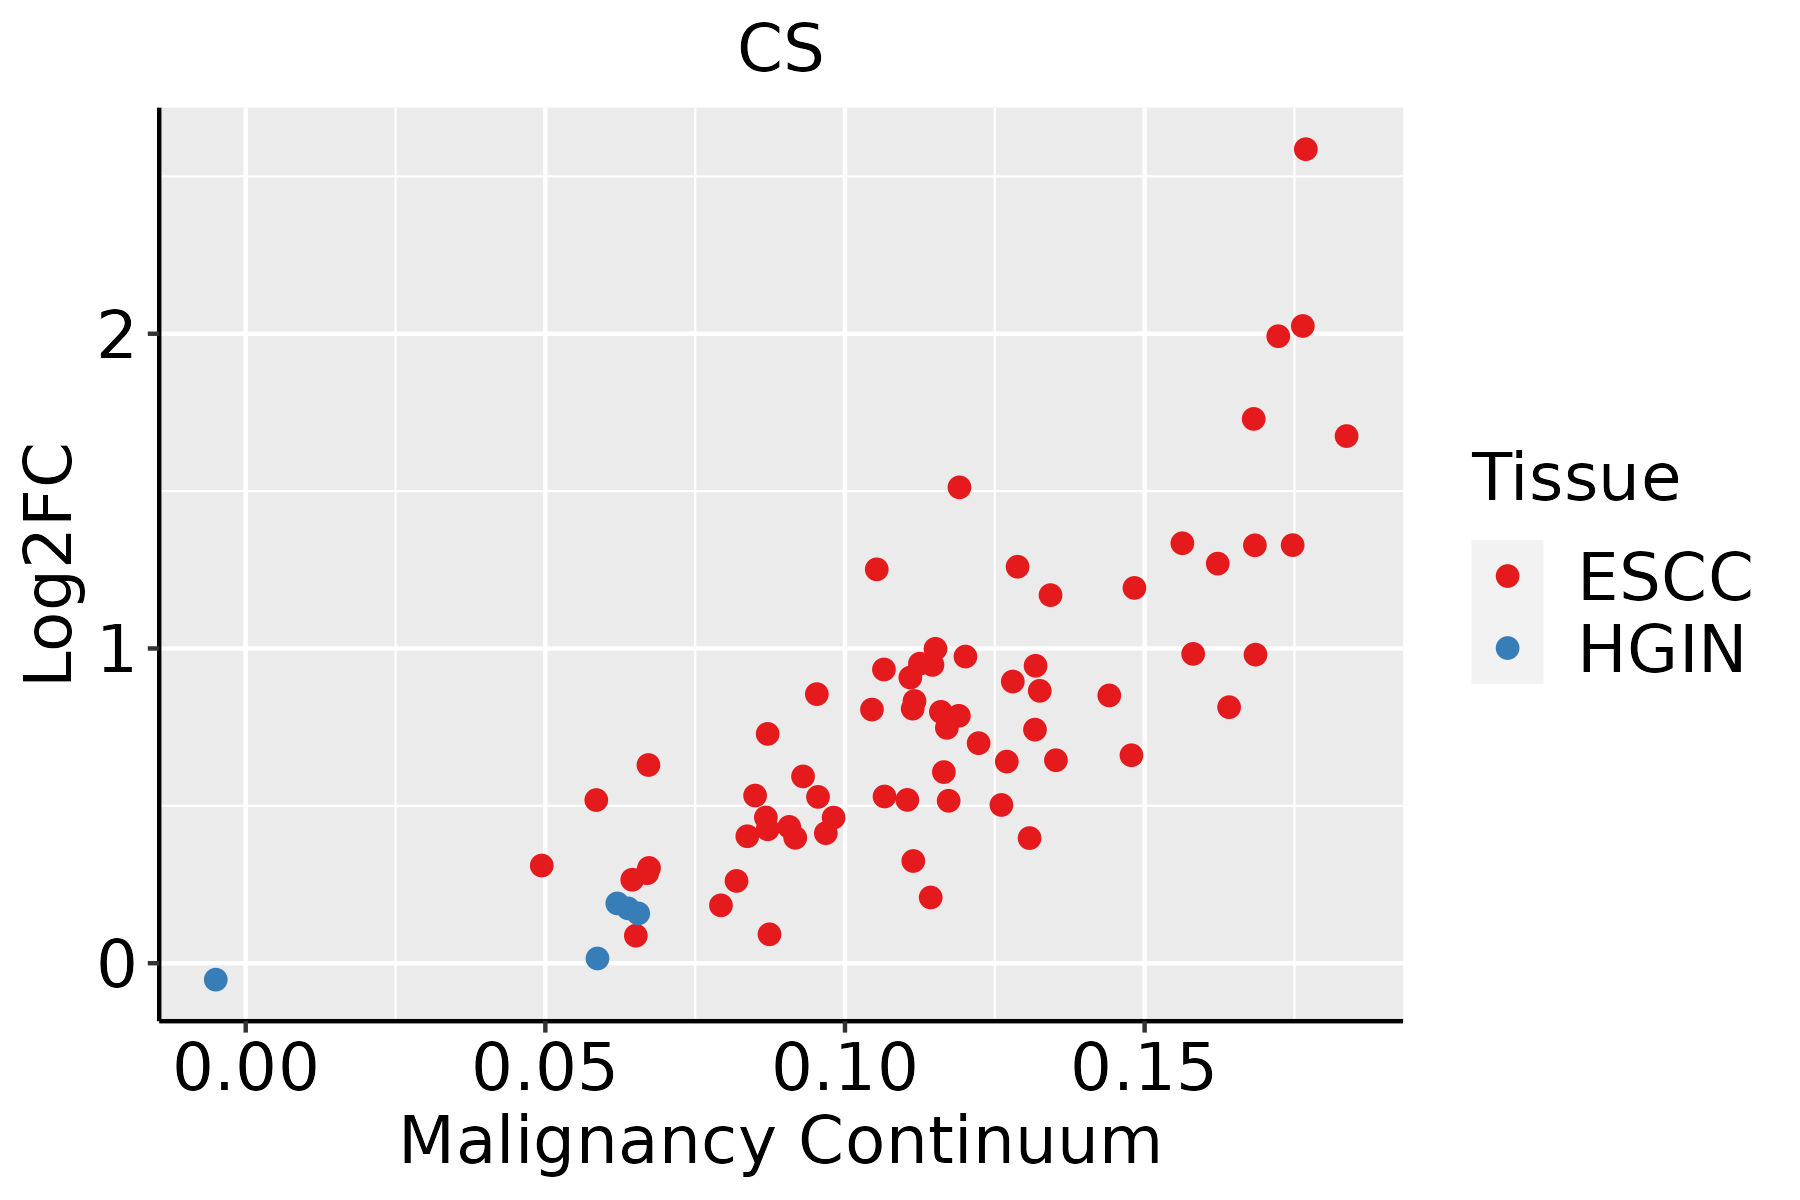 | ESCC: Esophageal squamous cell carcinoma |
| HGIN: High-grade intraepithelial neoplasias |
| LGIN: Low-grade intraepithelial neoplasias |
| Liver | 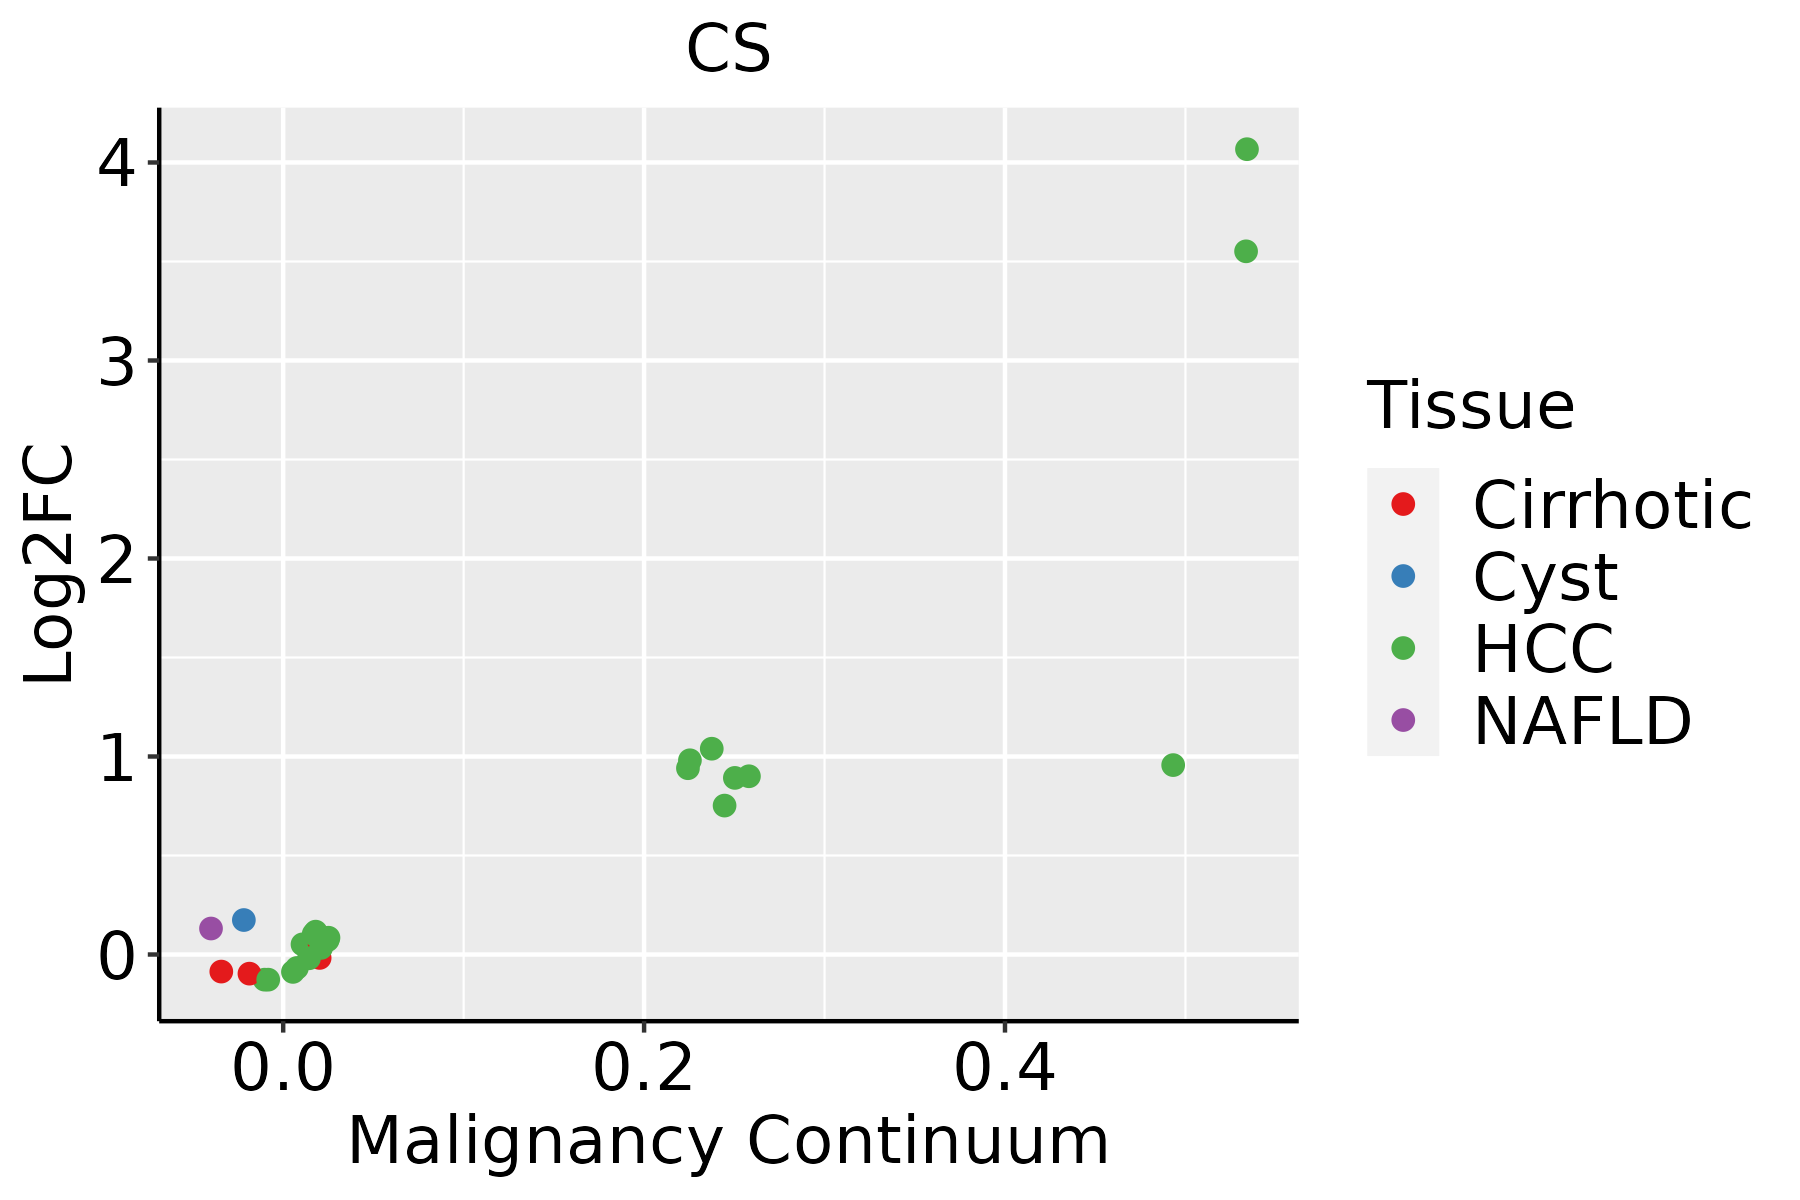 | HCC: Hepatocellular carcinoma |
| NAFLD: Non-alcoholic fatty liver disease |
| Oral Cavity | 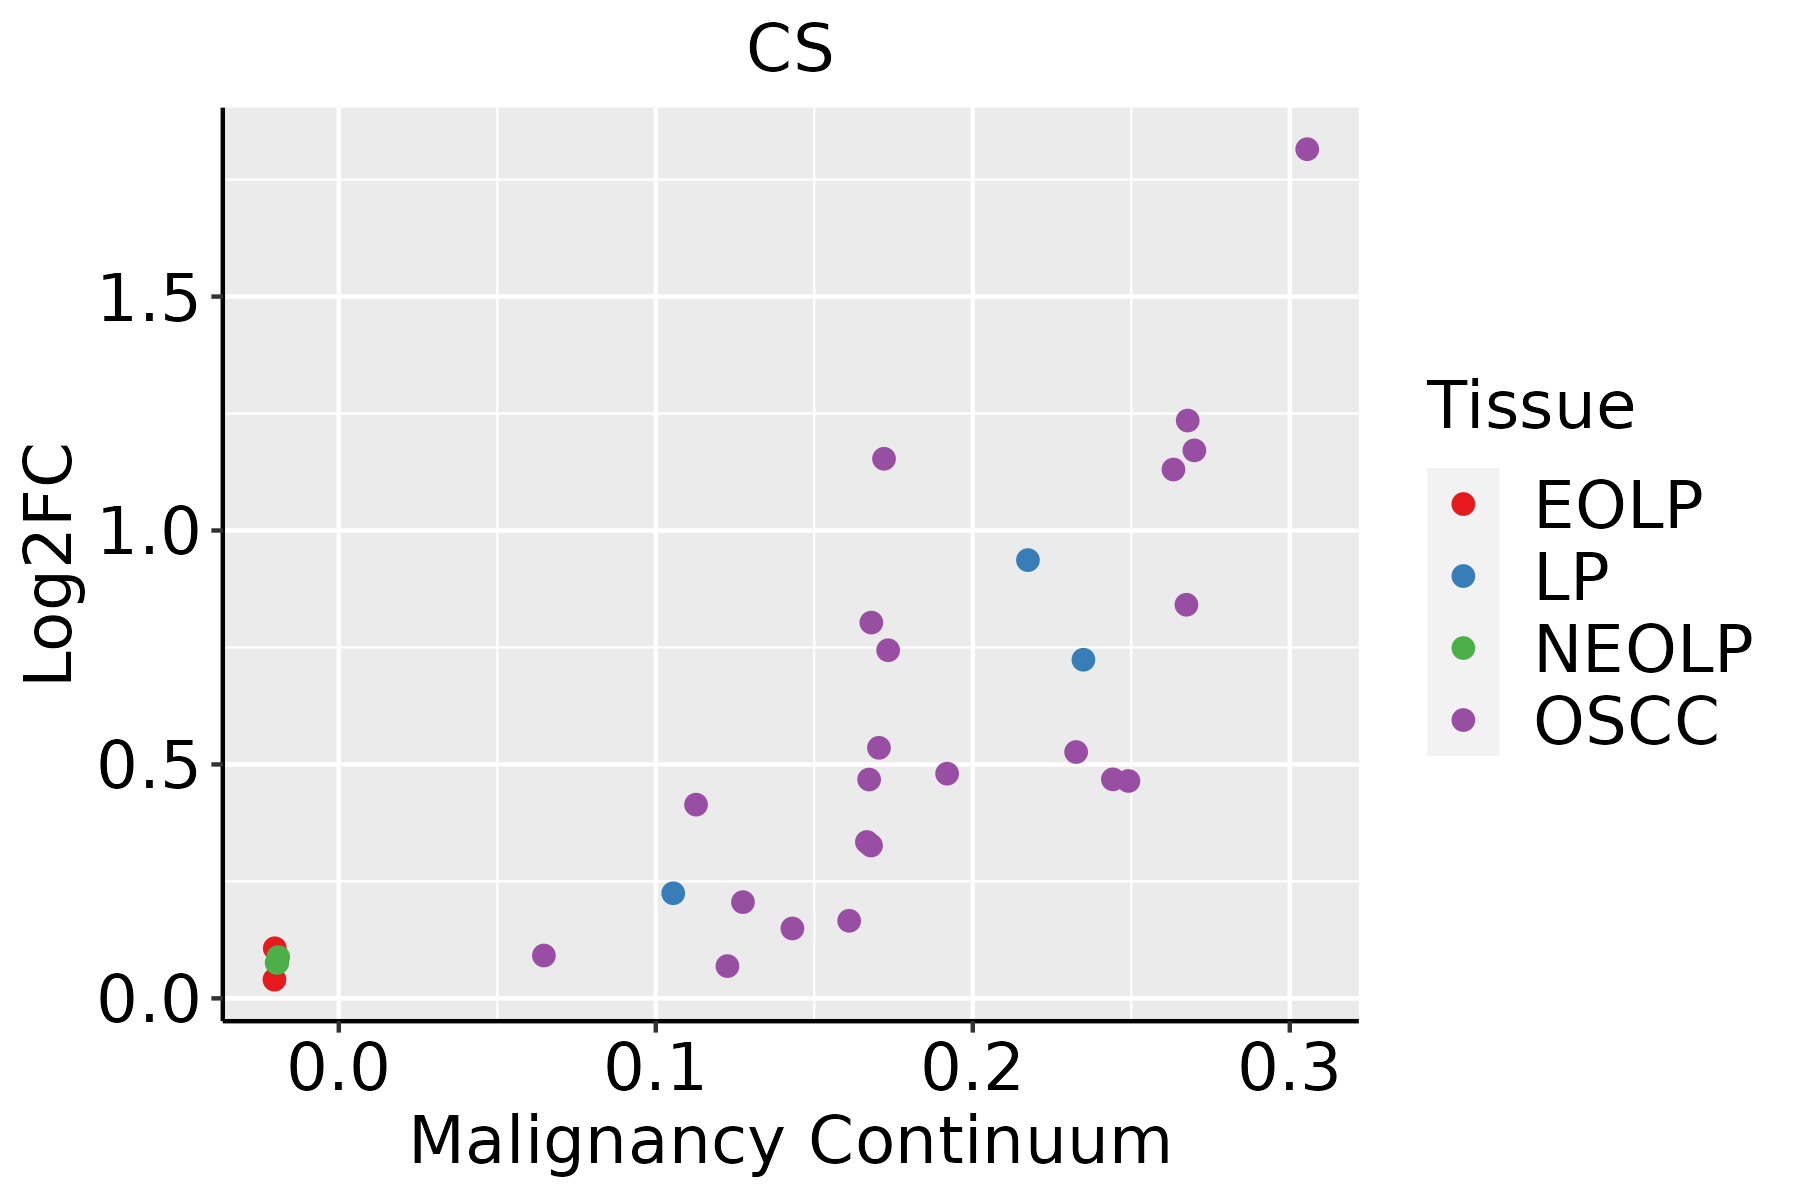 | EOLP: Erosive Oral lichen planus |
| LP: leukoplakia |
| NEOLP: Non-erosive oral lichen planus |
| OSCC: Oral squamous cell carcinoma |
| Skin | 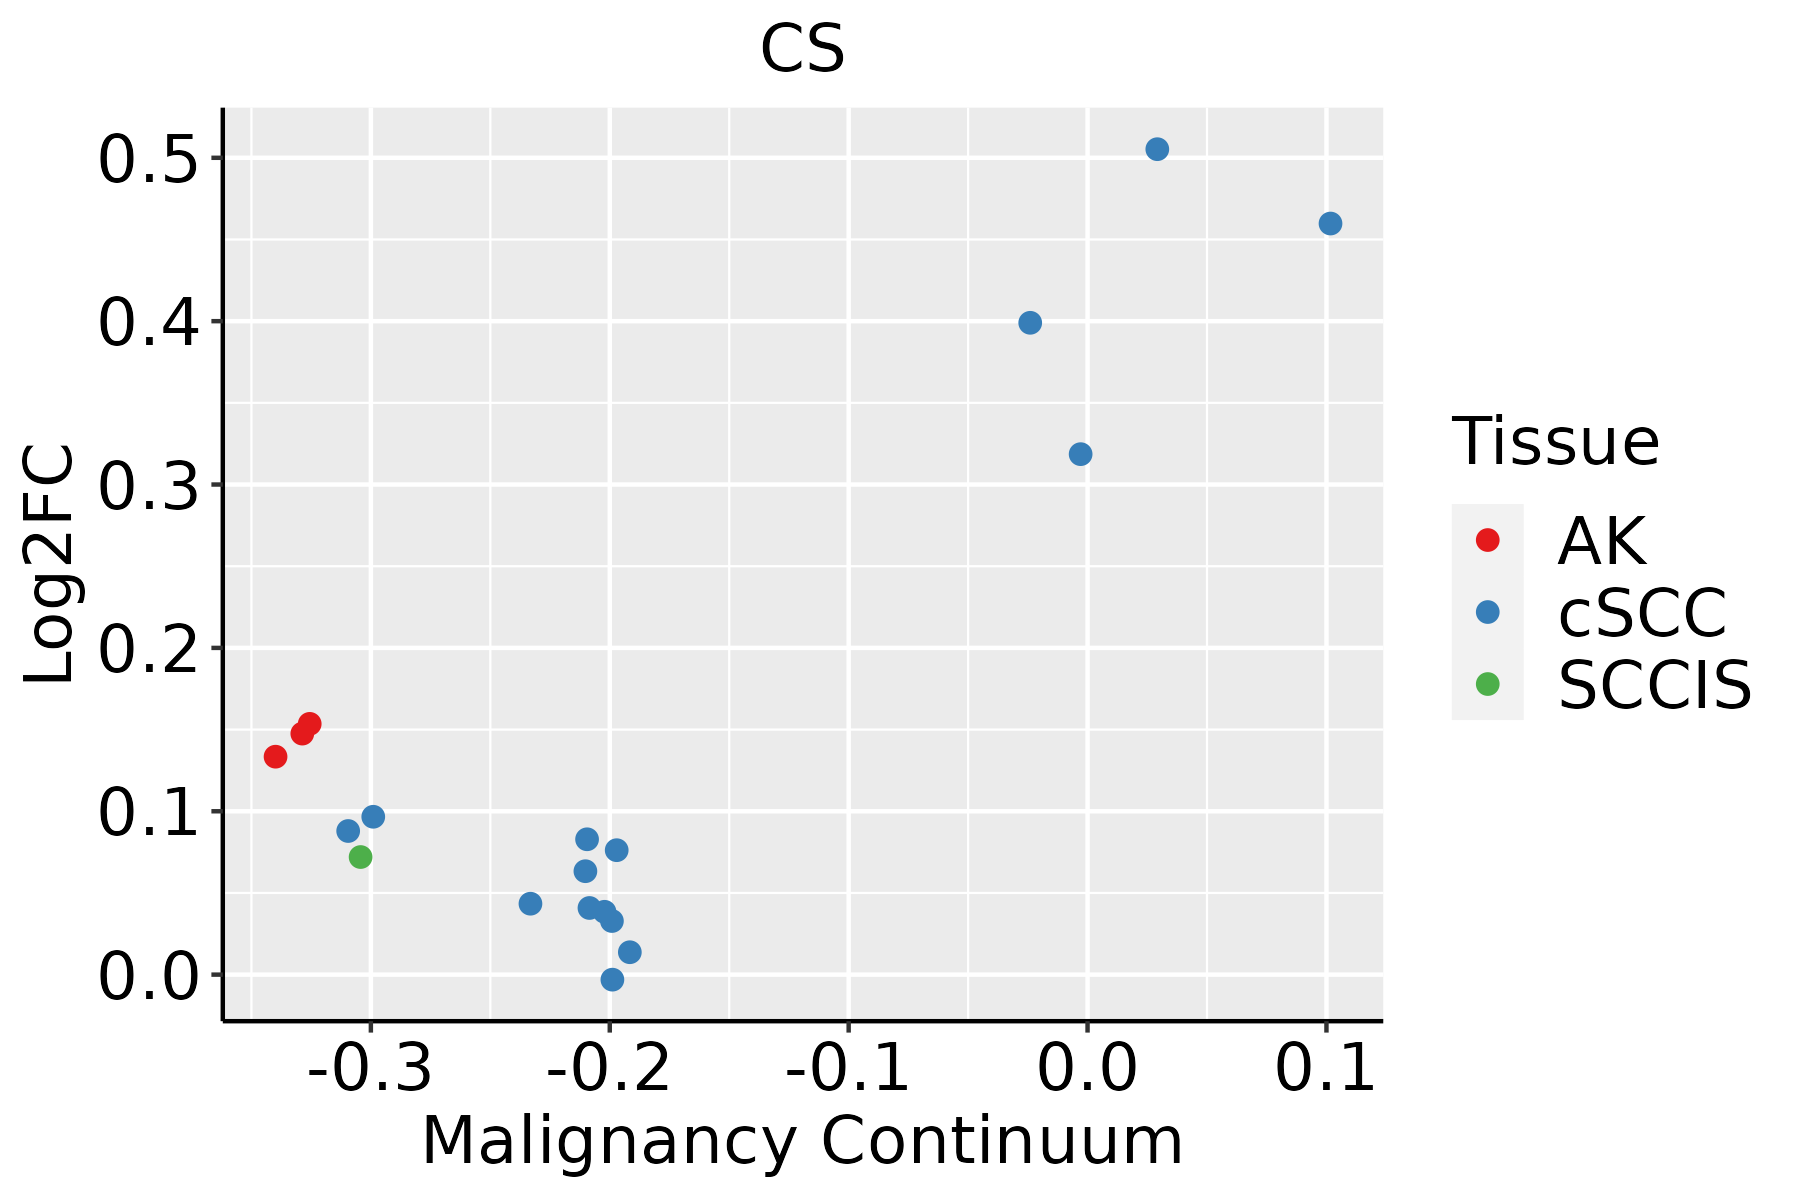 | AK: Actinic keratosis |
| cSCC: Cutaneous squamous cell carcinoma |
| SCCIS:squamous cell carcinoma in situ |
| Thyroid |  | ATC: Anaplastic thyroid cancer |
| HT: Hashimoto's thyroiditis |
| PTC: Papillary thyroid cancer |
| GO ID | Tissue | Disease Stage | Description | Gene Ratio | Bg Ratio | pvalue | p.adjust | Count |
| GO:0140354 | Liver | HCC | lipid import into cell | 14/7958 | 17/18723 | 9.39e-04 | 5.47e-03 | 14 |
| GO:007132612 | Liver | HCC | cellular response to monosaccharide stimulus | 85/7958 | 154/18723 | 9.78e-04 | 5.68e-03 | 85 |
| GO:0006379 | Liver | HCC | mRNA cleavage | 17/7958 | 22/18723 | 9.84e-04 | 5.70e-03 | 17 |
| GO:004521622 | Liver | HCC | cell-cell junction organization | 107/7958 | 200/18723 | 1.06e-03 | 6.11e-03 | 107 |
| GO:005087822 | Liver | HCC | regulation of body fluid levels | 191/7958 | 379/18723 | 1.06e-03 | 6.11e-03 | 191 |
| GO:00353371 | Liver | HCC | fatty-acyl-CoA metabolic process | 26/7958 | 38/18723 | 1.11e-03 | 6.33e-03 | 26 |
| GO:004586021 | Liver | HCC | positive regulation of protein kinase activity | 194/7958 | 386/18723 | 1.16e-03 | 6.54e-03 | 194 |
| GO:000663911 | Liver | HCC | acylglycerol metabolic process | 72/7958 | 128/18723 | 1.16e-03 | 6.54e-03 | 72 |
| GO:007132212 | Liver | HCC | cellular response to carbohydrate stimulus | 89/7958 | 163/18723 | 1.19e-03 | 6.62e-03 | 89 |
| GO:006049112 | Liver | HCC | regulation of cell projection assembly | 101/7958 | 188/18723 | 1.20e-03 | 6.69e-03 | 101 |
| GO:00109217 | Liver | HCC | regulation of phosphatase activity | 50/7958 | 84/18723 | 1.22e-03 | 6.74e-03 | 50 |
| GO:012003212 | Liver | HCC | regulation of plasma membrane bounded cell projection assembly | 100/7958 | 186/18723 | 1.23e-03 | 6.81e-03 | 100 |
| GO:007124112 | Liver | HCC | cellular response to inorganic substance | 119/7958 | 226/18723 | 1.26e-03 | 6.92e-03 | 119 |
| GO:0006665 | Liver | HCC | sphingolipid metabolic process | 85/7958 | 155/18723 | 1.27e-03 | 6.92e-03 | 85 |
| GO:190307711 | Liver | HCC | negative regulation of protein localization to plasma membrane | 18/7958 | 24/18723 | 1.27e-03 | 6.92e-03 | 18 |
| GO:000612212 | Liver | HCC | mitochondrial electron transport, ubiquinol to cytochrome c | 10/7958 | 11/18723 | 1.30e-03 | 7.01e-03 | 10 |
| GO:00091561 | Liver | HCC | ribonucleoside monophosphate biosynthetic process | 23/7958 | 33/18723 | 1.46e-03 | 7.75e-03 | 23 |
| GO:00454441 | Liver | HCC | fat cell differentiation | 120/7958 | 229/18723 | 1.52e-03 | 8.05e-03 | 120 |
| GO:000663811 | Liver | HCC | neutral lipid metabolic process | 72/7958 | 129/18723 | 1.54e-03 | 8.14e-03 | 72 |
| GO:00606694 | Liver | HCC | embryonic placenta morphogenesis | 19/7958 | 26/18723 | 1.57e-03 | 8.23e-03 | 19 |
| Pathway ID | Tissue | Disease Stage | Description | Gene Ratio | Bg Ratio | pvalue | p.adjust | qvalue | Count |
| hsa01200 | Colorectum | AD | Carbon metabolism | 55/2092 | 115/8465 | 5.53e-08 | 8.42e-07 | 5.37e-07 | 55 |
| hsa00020 | Colorectum | AD | Citrate cycle (TCA cycle) | 20/2092 | 30/8465 | 1.43e-06 | 1.77e-05 | 1.13e-05 | 20 |
| hsa00630 | Colorectum | AD | Glyoxylate and dicarboxylate metabolism | 14/2092 | 30/8465 | 7.25e-03 | 2.97e-02 | 1.89e-02 | 14 |
| hsa01230 | Colorectum | AD | Biosynthesis of amino acids | 28/2092 | 75/8465 | 9.99e-03 | 3.89e-02 | 2.48e-02 | 28 |
| hsa012001 | Colorectum | AD | Carbon metabolism | 55/2092 | 115/8465 | 5.53e-08 | 8.42e-07 | 5.37e-07 | 55 |
| hsa000201 | Colorectum | AD | Citrate cycle (TCA cycle) | 20/2092 | 30/8465 | 1.43e-06 | 1.77e-05 | 1.13e-05 | 20 |
| hsa006301 | Colorectum | AD | Glyoxylate and dicarboxylate metabolism | 14/2092 | 30/8465 | 7.25e-03 | 2.97e-02 | 1.89e-02 | 14 |
| hsa012301 | Colorectum | AD | Biosynthesis of amino acids | 28/2092 | 75/8465 | 9.99e-03 | 3.89e-02 | 2.48e-02 | 28 |
| hsa012002 | Colorectum | SER | Carbon metabolism | 40/1580 | 115/8465 | 2.77e-05 | 3.41e-04 | 2.47e-04 | 40 |
| hsa012302 | Colorectum | SER | Biosynthesis of amino acids | 23/1580 | 75/8465 | 8.11e-03 | 4.14e-02 | 3.01e-02 | 23 |
| hsa012003 | Colorectum | SER | Carbon metabolism | 40/1580 | 115/8465 | 2.77e-05 | 3.41e-04 | 2.47e-04 | 40 |
| hsa012303 | Colorectum | SER | Biosynthesis of amino acids | 23/1580 | 75/8465 | 8.11e-03 | 4.14e-02 | 3.01e-02 | 23 |
| hsa012004 | Colorectum | MSS | Carbon metabolism | 43/1875 | 115/8465 | 1.37e-04 | 1.17e-03 | 7.19e-04 | 43 |
| hsa012005 | Colorectum | MSS | Carbon metabolism | 43/1875 | 115/8465 | 1.37e-04 | 1.17e-03 | 7.19e-04 | 43 |
| hsa006302 | Colorectum | MSI-H | Glyoxylate and dicarboxylate metabolism | 8/797 | 30/8465 | 5.34e-03 | 4.94e-02 | 4.14e-02 | 8 |
| hsa006303 | Colorectum | MSI-H | Glyoxylate and dicarboxylate metabolism | 8/797 | 30/8465 | 5.34e-03 | 4.94e-02 | 4.14e-02 | 8 |
| hsa012006 | Colorectum | FAP | Carbon metabolism | 38/1404 | 115/8465 | 1.04e-05 | 1.44e-04 | 8.76e-05 | 38 |
| hsa000206 | Colorectum | FAP | Citrate cycle (TCA cycle) | 14/1404 | 30/8465 | 1.16e-04 | 1.02e-03 | 6.21e-04 | 14 |
| hsa012007 | Colorectum | FAP | Carbon metabolism | 38/1404 | 115/8465 | 1.04e-05 | 1.44e-04 | 8.76e-05 | 38 |
| hsa000207 | Colorectum | FAP | Citrate cycle (TCA cycle) | 14/1404 | 30/8465 | 1.16e-04 | 1.02e-03 | 6.21e-04 | 14 |
| Hugo Symbol | Variant Class | Variant Classification | dbSNP RS | HGVSc | HGVSp | HGVSp Short | SWISSPROT | BIOTYPE | SIFT | PolyPhen | Tumor Sample Barcode | Tissue | Histology | Sex | Age | Stage | Therapy Types | Drugs | Outcome |
| CS | SNV | Missense_Mutation | | c.964N>C | p.Asp322His | p.D322H | O75390 | protein_coding | tolerated(0.05) | benign(0.021) | TCGA-A2-A0CX-01 | Breast | breast invasive carcinoma | Female | <65 | I/II | Chemotherapy | adriamycin | SD |
| CS | SNV | Missense_Mutation | novel | c.1363N>C | p.Glu455Gln | p.E455Q | O75390 | protein_coding | tolerated(0.18) | benign(0.04) | TCGA-AC-A5XS-01 | Breast | breast invasive carcinoma | Female | >=65 | I/II | Hormone Therapy | femara | SD |
| CS | SNV | Missense_Mutation | novel | c.820N>C | p.Thr274Pro | p.T274P | O75390 | protein_coding | deleterious(0.03) | probably_damaging(0.976) | TCGA-D8-A1JM-01 | Breast | breast invasive carcinoma | Female | <65 | I/II | ChemotherapyHormone Therapy | doxorubicine | SD |
| CS | insertion | Frame_Shift_Ins | novel | c.323_324insCAGTCAGTCAT | p.Lys109SerfsTer20 | p.K109Sfs*20 | O75390 | protein_coding | | | TCGA-A8-A06P-01 | Breast | breast invasive carcinoma | Female | <65 | III/IV | Unspecific | | SD |
| CS | insertion | In_Frame_Ins | novel | c.321_322insTCTAGGAGGACTAAT | p.Lys107_Ala108insSerArgArgThrAsn | p.K107_A108insSRRTN | O75390 | protein_coding | | | TCGA-A8-A06P-01 | Breast | breast invasive carcinoma | Female | <65 | III/IV | Unspecific | | SD |
| CS | SNV | Missense_Mutation | novel | c.1374G>T | p.Met458Ile | p.M458I | O75390 | protein_coding | tolerated(0.31) | benign(0) | TCGA-VS-A9UP-01 | Cervix | cervical & endocervical cancer | Female | <65 | I/II | Chemotherapy | cisplatin | PD |
| CS | SNV | Missense_Mutation | | c.91N>G | p.Thr31Ala | p.T31A | O75390 | protein_coding | tolerated(0.54) | benign(0) | TCGA-A6-2686-01 | Colorectum | colon adenocarcinoma | Female | >=65 | I/II | Unknown | Unknown | SD |
| CS | SNV | Missense_Mutation | | c.1327N>T | p.Gly443Cys | p.G443C | O75390 | protein_coding | deleterious(0) | probably_damaging(0.998) | TCGA-AD-5900-01 | Colorectum | colon adenocarcinoma | Male | >=65 | I/II | Unknown | Unknown | SD |
| CS | SNV | Missense_Mutation | rs779289848 | c.274N>T | p.Arg92Cys | p.R92C | O75390 | protein_coding | deleterious(0.03) | benign(0.154) | TCGA-AZ-4615-01 | Colorectum | colon adenocarcinoma | Male | >=65 | III/IV | Chemotherapy | xeloda | PD |
| CS | SNV | Missense_Mutation | rs140943640 | c.370G>A | p.Val124Ile | p.V124I | O75390 | protein_coding | tolerated(0.08) | benign(0.011) | TCGA-CK-4951-01 | Colorectum | colon adenocarcinoma | Female | >=65 | I/II | Unknown | Unknown | PD |


