
|
|||||
|
 | |
| |
| |
| |
| |
| |
|
Gene: XRCC5 |
Gene summary for XRCC5 |
| Gene information | Species | Human | Gene symbol | XRCC5 | Gene ID | 7520 |
| Gene name | X-ray repair cross complementing 5 | |
| Gene Alias | KARP-1 | |
| Cytomap | 2q35 | |
| Gene Type | protein-coding | GO ID | GO:0000028 | UniProtAcc | P13010 |
Top |
Malignant transformation analysis |
| Identification of the aberrant gene expression in precancerous and cancerous lesions by comparing the gene expression of stem-like cells in diseased tissues with normal stem cells |
| Entrez ID | Symbol | Replicates | Species | Organ | Tissue | Adj P-value | Log2FC | Malignancy |
| 7520 | XRCC5 | GSM4909285 | Human | Breast | IDC | 2.26e-16 | 4.08e-01 | 0.21 |
| 7520 | XRCC5 | GSM4909288 | Human | Breast | IDC | 7.84e-03 | 2.92e-01 | 0.0988 |
| 7520 | XRCC5 | GSM4909293 | Human | Breast | IDC | 1.23e-14 | 4.25e-01 | 0.1581 |
| 7520 | XRCC5 | GSM4909294 | Human | Breast | IDC | 1.21e-07 | 1.88e-01 | 0.2022 |
| 7520 | XRCC5 | GSM4909296 | Human | Breast | IDC | 2.96e-07 | -1.52e-01 | 0.1524 |
| 7520 | XRCC5 | GSM4909297 | Human | Breast | IDC | 4.53e-11 | -1.73e-01 | 0.1517 |
| 7520 | XRCC5 | GSM4909302 | Human | Breast | IDC | 8.13e-03 | -1.70e-01 | 0.1545 |
| 7520 | XRCC5 | GSM4909311 | Human | Breast | IDC | 1.47e-25 | -1.79e-01 | 0.1534 |
| 7520 | XRCC5 | GSM4909312 | Human | Breast | IDC | 6.10e-10 | -4.77e-02 | 0.1552 |
| 7520 | XRCC5 | GSM4909316 | Human | Breast | IDC | 3.81e-02 | -1.18e-01 | 0.21 |
| 7520 | XRCC5 | GSM4909317 | Human | Breast | IDC | 3.41e-11 | 4.79e-01 | 0.1355 |
| 7520 | XRCC5 | GSM4909319 | Human | Breast | IDC | 2.85e-33 | -2.97e-01 | 0.1563 |
| 7520 | XRCC5 | GSM4909320 | Human | Breast | IDC | 2.60e-04 | -3.34e-01 | 0.1575 |
| 7520 | XRCC5 | GSM4909321 | Human | Breast | IDC | 2.80e-14 | -2.47e-01 | 0.1559 |
| 7520 | XRCC5 | brca1 | Human | Breast | Precancer | 1.63e-03 | 2.65e-01 | -0.0338 |
| 7520 | XRCC5 | brca2 | Human | Breast | Precancer | 2.87e-14 | 3.81e-01 | -0.024 |
| 7520 | XRCC5 | brca3 | Human | Breast | Precancer | 1.01e-18 | 4.54e-01 | -0.0263 |
| 7520 | XRCC5 | M2 | Human | Breast | IDC | 9.35e-04 | 3.36e-01 | 0.21 |
| 7520 | XRCC5 | NCCBC11 | Human | Breast | DCIS | 4.40e-07 | 4.84e-01 | 0.1232 |
| 7520 | XRCC5 | NCCBC14 | Human | Breast | DCIS | 3.82e-16 | 3.32e-01 | 0.2021 |
| Page: 1 2 3 4 5 6 7 8 9 10 11 12 |
| Tissue | Expression Dynamics | Abbreviation |
| Breast |  | IDC: Invasive ductal carcinoma |
| DCIS: Ductal carcinoma in situ | ||
| Precancer(BRCA1-mut): Precancerous lesion from BRCA1 mutation carriers | ||
| Cervix |  | CC: Cervix cancer |
| HSIL_HPV: HPV-infected high-grade squamous intraepithelial lesions | ||
| N_HPV: HPV-infected normal cervix | ||
| Colorectum (GSE201348) |  | FAP: Familial adenomatous polyposis |
| CRC: Colorectal cancer | ||
| Colorectum (HTA11) |  | AD: Adenomas |
| SER: Sessile serrated lesions | ||
| MSI-H: Microsatellite-high colorectal cancer | ||
| MSS: Microsatellite stable colorectal cancer | ||
| Endometrium |  | AEH: Atypical endometrial hyperplasia |
| EEC: Endometrioid Cancer | ||
| Esophagus | 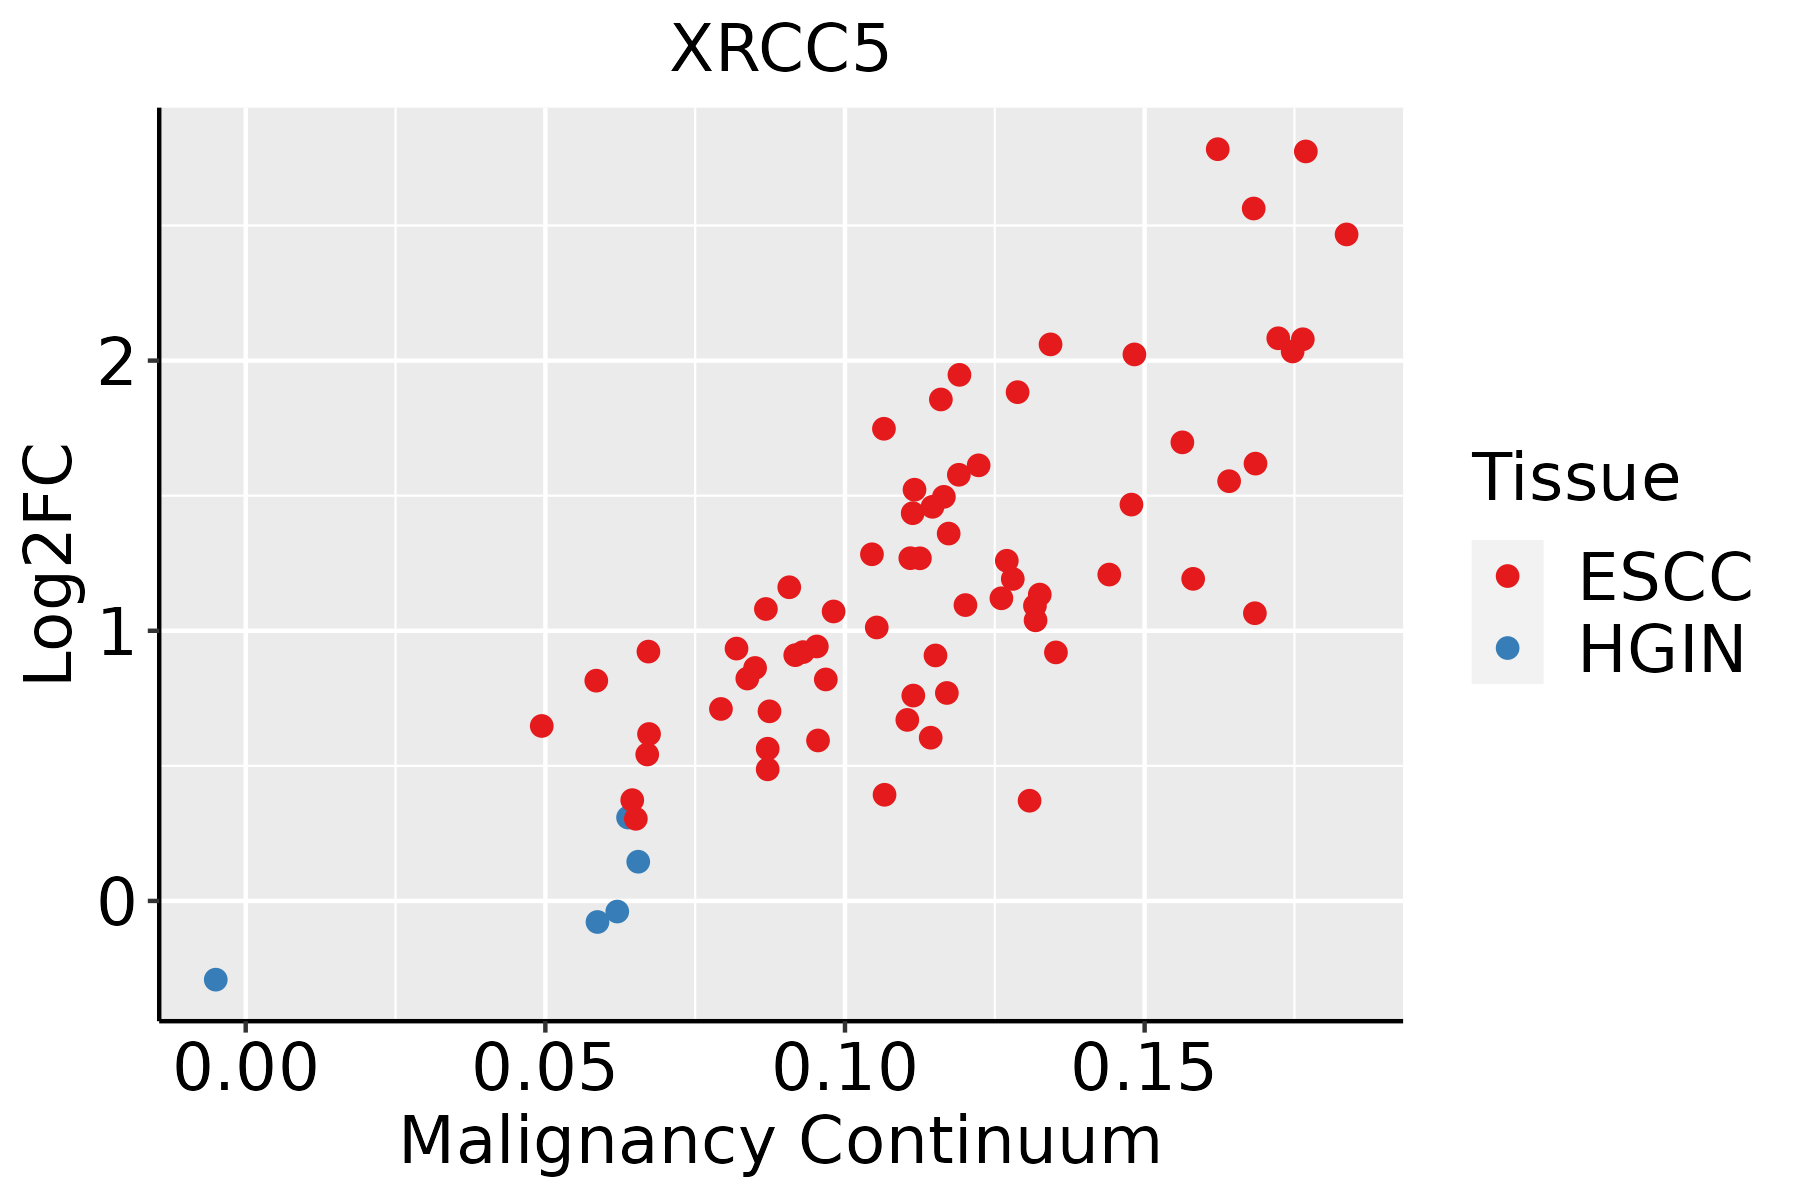 | ESCC: Esophageal squamous cell carcinoma |
| HGIN: High-grade intraepithelial neoplasias | ||
| LGIN: Low-grade intraepithelial neoplasias | ||
| Liver | 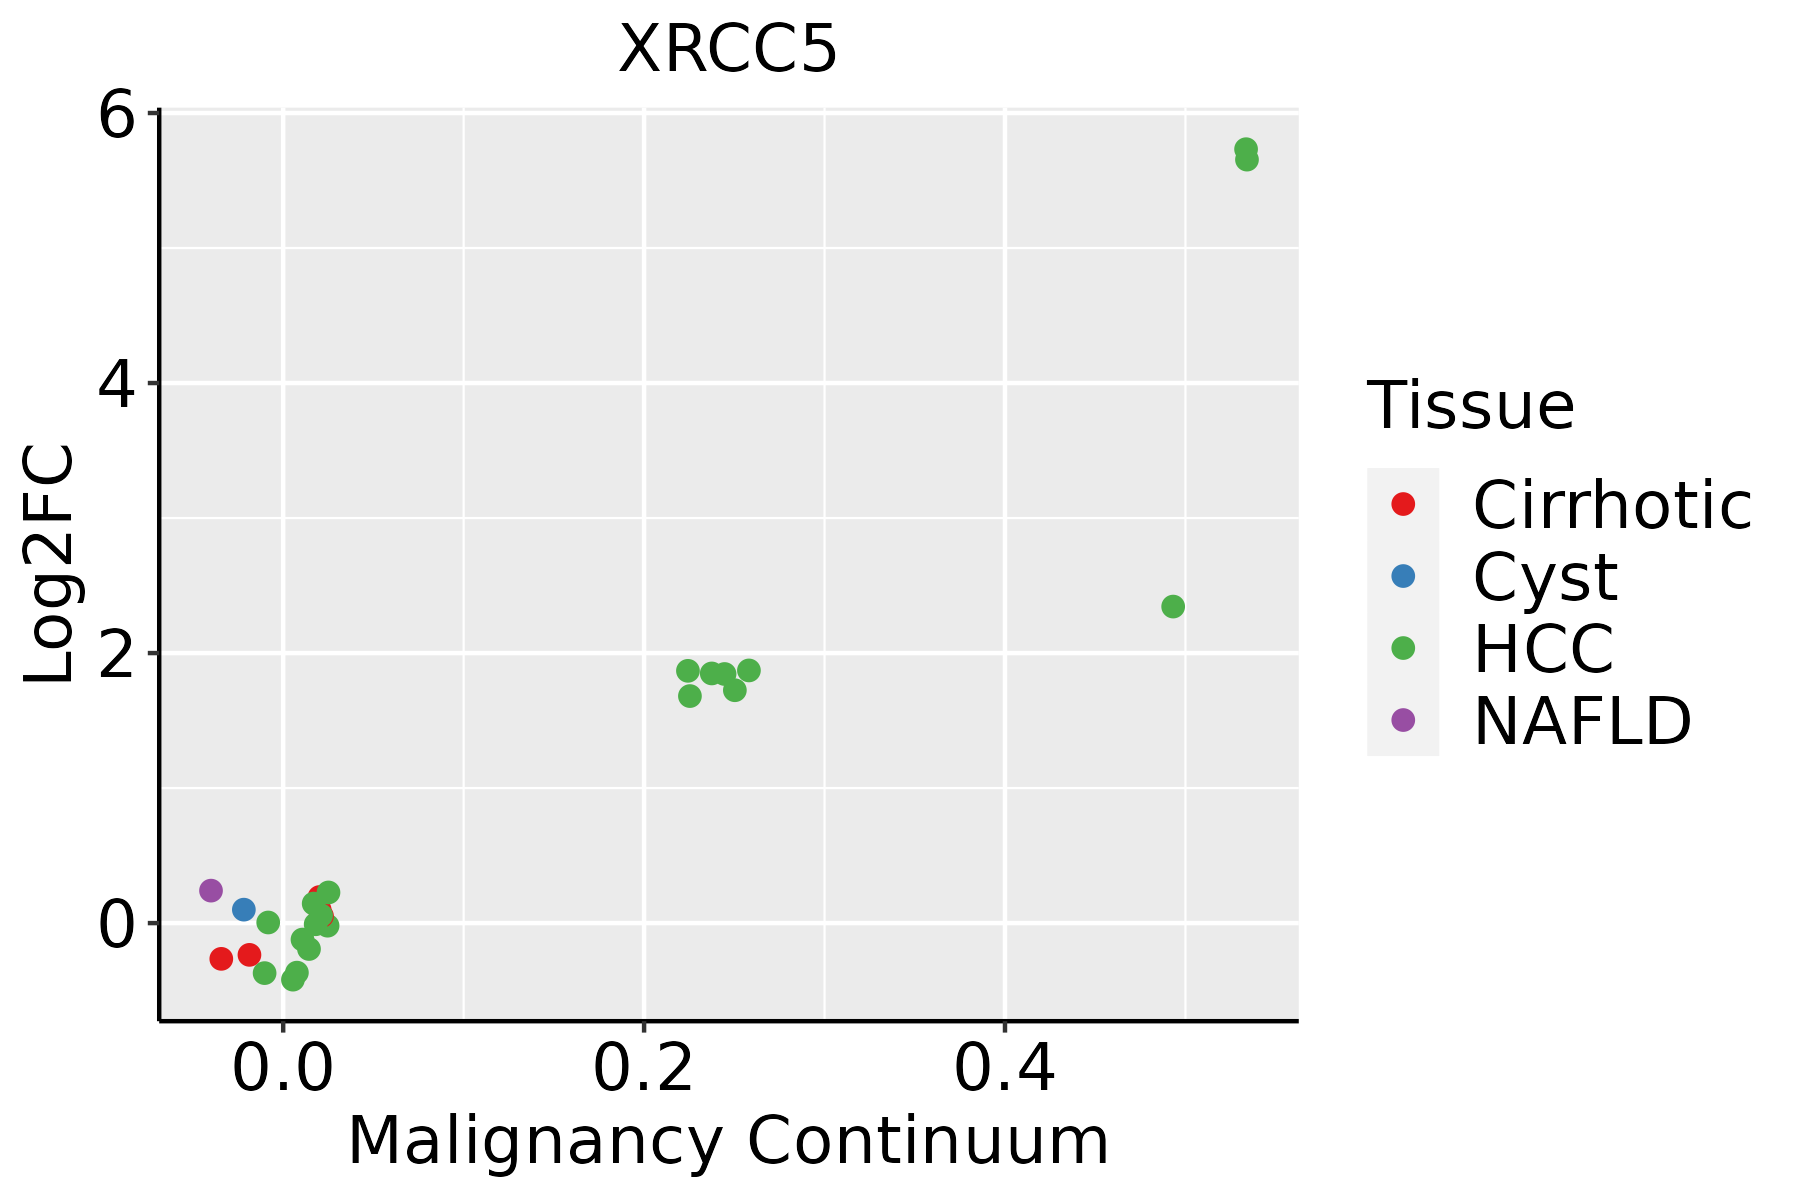 | HCC: Hepatocellular carcinoma |
| NAFLD: Non-alcoholic fatty liver disease | ||
| Oral Cavity |  | EOLP: Erosive Oral lichen planus |
| LP: leukoplakia | ||
| NEOLP: Non-erosive oral lichen planus | ||
| OSCC: Oral squamous cell carcinoma | ||
| Prostate |  | BPH: Benign Prostatic Hyperplasia |
| Skin |  | AK: Actinic keratosis |
| cSCC: Cutaneous squamous cell carcinoma | ||
| SCCIS:squamous cell carcinoma in situ | ||
| Thyroid | 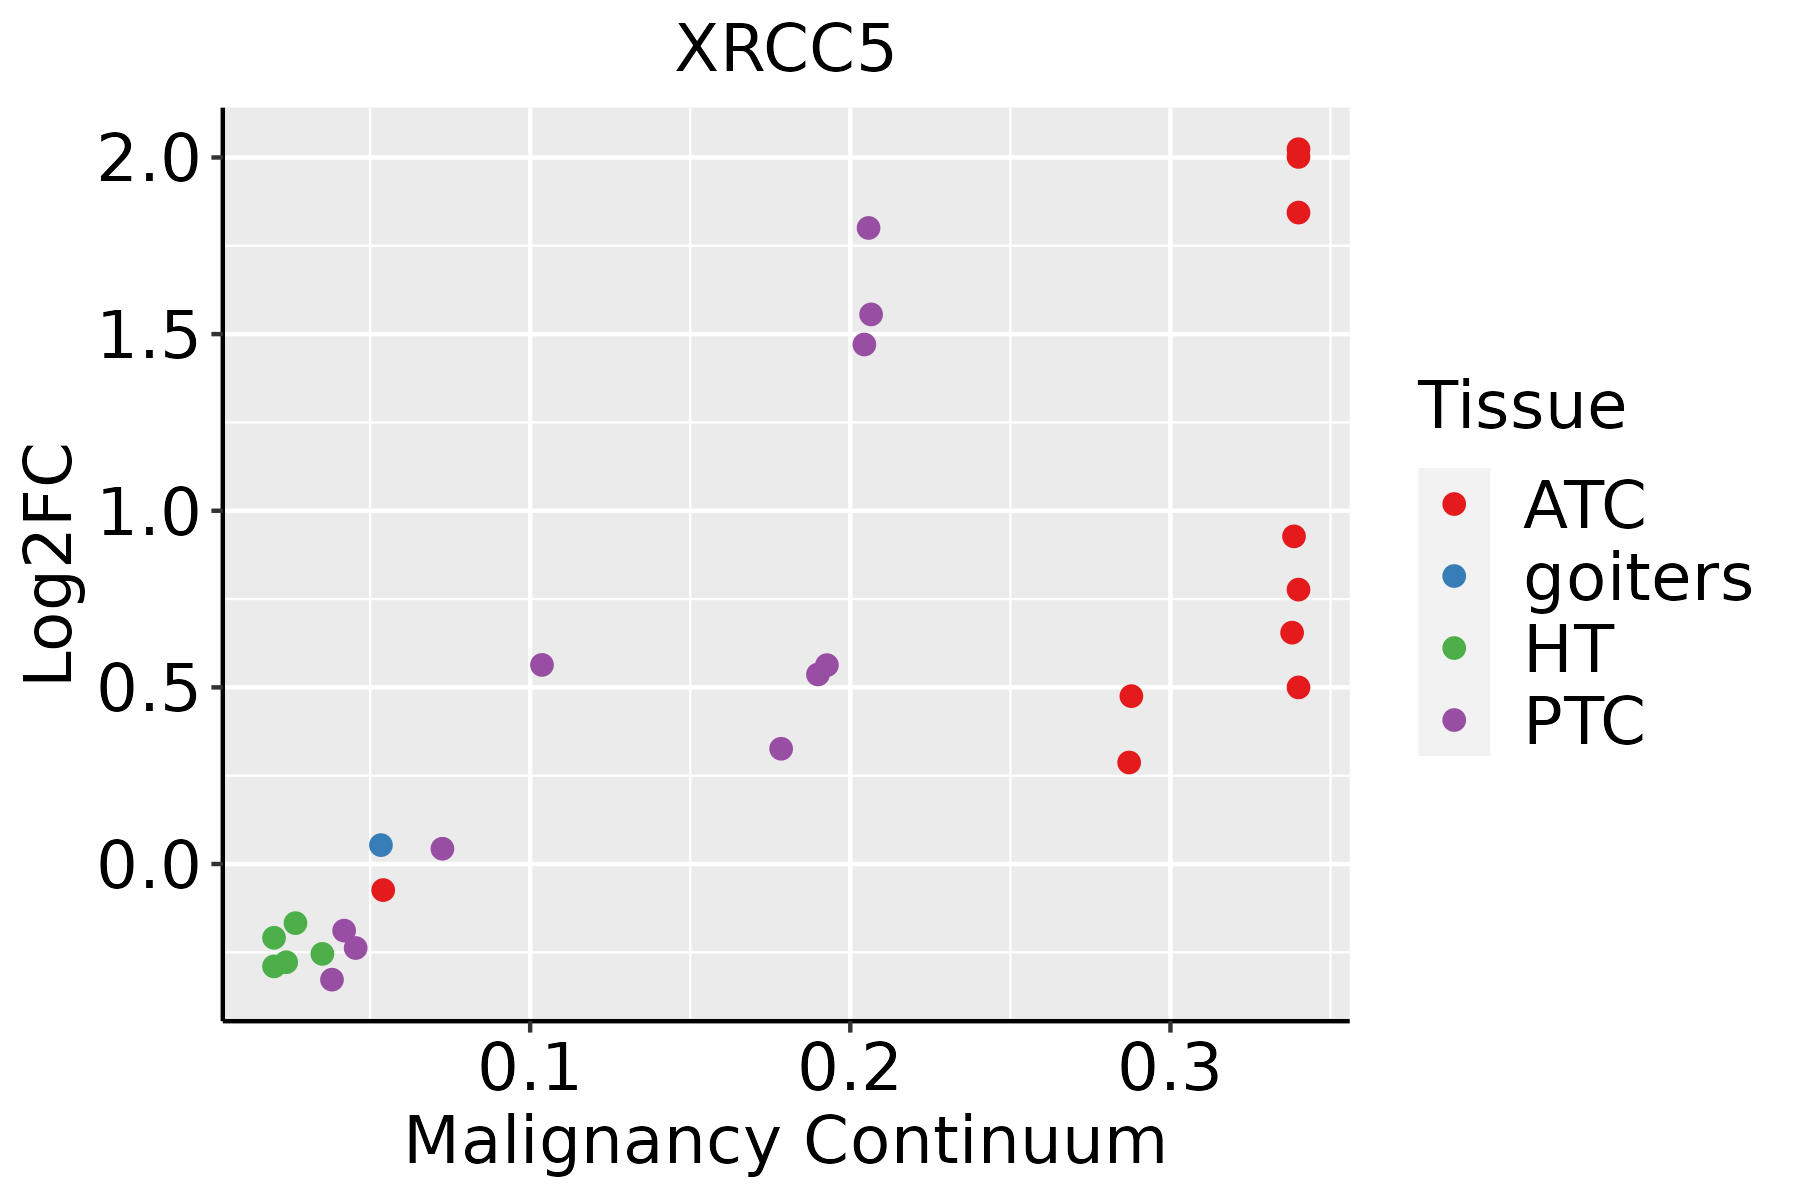 | ATC: Anaplastic thyroid cancer |
| HT: Hashimoto's thyroiditis | ||
| PTC: Papillary thyroid cancer |
| ∗log2FC in expression of this searched gene in stem-like cells from each diseased tissue sample relative to stem-like cells in normal samples in each tissue plotted against the malignancy continuum. Samples are colored based on if they are from different disease stage. |
Top |
Malignant transformation related pathway analysis |
| Find out the enriched GO biological processes and KEGG pathways involved in transition from healthy to precancer to cancer |
| Tissue | Disease Stage | Enriched GO biological Processes |
| Colorectum | AD |  |
| Colorectum | SER |  |
| Colorectum | MSS |  |
| Colorectum | MSI-H |  |
| Colorectum | FAP |  |
| ∗Top 15 enriched GO BP terms are showed in the bar plot of each disease state in each tissue. Each row represents a significant GO biological process which is colored according to the -log10(p.adjust). |
| Page: 1 2 3 4 5 6 7 8 9 |
| GO ID | Tissue | Disease Stage | Description | Gene Ratio | Bg Ratio | pvalue | p.adjust | Count |
| GO:00322065 | Colorectum | CRC | positive regulation of telomere maintenance | 13/2078 | 52/18723 | 3.71e-03 | 3.12e-02 | 13 |
| GO:00322102 | Colorectum | CRC | regulation of telomere maintenance via telomerase | 13/2078 | 53/18723 | 4.42e-03 | 3.47e-02 | 13 |
| GO:19043585 | Colorectum | CRC | positive regulation of telomere maintenance via telomere lengthening | 10/2078 | 37/18723 | 5.78e-03 | 4.31e-02 | 10 |
| GO:19043565 | Colorectum | CRC | regulation of telomere maintenance via telomere lengthening | 14/2078 | 61/18723 | 6.06e-03 | 4.46e-02 | 14 |
| GO:00094103 | Colorectum | CRC | response to xenobiotic stimulus | 69/2078 | 462/18723 | 6.34e-03 | 4.61e-02 | 69 |
| GO:00519621 | Colorectum | CRC | positive regulation of nervous system development | 44/2078 | 272/18723 | 6.71e-03 | 4.77e-02 | 44 |
| GO:00108335 | Colorectum | CRC | telomere maintenance via telomere lengthening | 17/2078 | 81/18723 | 6.93e-03 | 4.85e-02 | 17 |
| GO:002261316 | Endometrium | AEH | ribonucleoprotein complex biogenesis | 107/2100 | 463/18723 | 1.43e-13 | 4.08e-11 | 107 |
| GO:007182616 | Endometrium | AEH | ribonucleoprotein complex subunit organization | 65/2100 | 227/18723 | 4.47e-13 | 1.07e-10 | 65 |
| GO:002261816 | Endometrium | AEH | ribonucleoprotein complex assembly | 63/2100 | 220/18723 | 1.02e-12 | 2.24e-10 | 63 |
| GO:004225516 | Endometrium | AEH | ribosome assembly | 26/2100 | 61/18723 | 4.06e-10 | 4.20e-08 | 26 |
| GO:004225416 | Endometrium | AEH | ribosome biogenesis | 67/2100 | 299/18723 | 1.95e-08 | 1.18e-06 | 67 |
| GO:006219716 | Endometrium | AEH | cellular response to chemical stress | 71/2100 | 337/18723 | 1.03e-07 | 5.05e-06 | 71 |
| GO:00486604 | Endometrium | AEH | regulation of smooth muscle cell proliferation | 43/2100 | 180/18723 | 1.09e-06 | 3.68e-05 | 43 |
| GO:200125210 | Endometrium | AEH | positive regulation of chromosome organization | 25/2100 | 82/18723 | 1.95e-06 | 5.93e-05 | 25 |
| GO:00486594 | Endometrium | AEH | smooth muscle cell proliferation | 43/2100 | 184/18723 | 2.04e-06 | 6.14e-05 | 43 |
| GO:004227416 | Endometrium | AEH | ribosomal small subunit biogenesis | 22/2100 | 73/18723 | 9.73e-06 | 2.24e-04 | 22 |
| GO:000002816 | Endometrium | AEH | ribosomal small subunit assembly | 10/2100 | 19/18723 | 1.09e-05 | 2.48e-04 | 10 |
| GO:00330022 | Endometrium | AEH | muscle cell proliferation | 51/2100 | 248/18723 | 1.26e-05 | 2.77e-04 | 51 |
| GO:00070048 | Endometrium | AEH | telomere maintenance via telomerase | 21/2100 | 69/18723 | 1.30e-05 | 2.82e-04 | 21 |
| Page: 1 2 3 4 5 6 7 8 9 10 11 12 13 14 15 16 17 18 19 20 21 22 23 24 25 26 27 28 29 30 31 32 33 34 35 36 37 38 39 40 41 42 43 44 45 46 47 48 49 50 51 52 53 54 55 56 57 58 59 60 61 62 63 |
| Pathway ID | Tissue | Disease Stage | Description | Gene Ratio | Bg Ratio | pvalue | p.adjust | qvalue | Count |
| Page: 1 |
Top |
Cell-cell communication analysis |
| Identification of potential cell-cell interactions between two cell types and their ligand-receptor pairs for different disease states |
| Ligand | Receptor | LRpair | Pathway | Tissue | Disease Stage |
| Page: 1 |
Top |
Single-cell gene regulatory network inference analysis |
| Find out the significant the regulons (TFs) and the target genes of each regulon across cell types for different disease states |
| TF | Cell Type | Tissue | Disease Stage | Target Gene | RSS | Regulon Activity |
| ∗The dot plots of a searched regulon are shown for all cell subpopulations in each disease state of each tissue based on the regulon specific score inferred using pySCENIC and by calculating the average expression. |
| Page: 1 |
Top |
Somatic mutation of malignant transformation related genes |
| Annotation of somatic variants for genes involved in malignant transformation |
| Hugo Symbol | Variant Class | Variant Classification | dbSNP RS | HGVSc | HGVSp | HGVSp Short | SWISSPROT | BIOTYPE | SIFT | PolyPhen | Tumor Sample Barcode | Tissue | Histology | Sex | Age | Stage | Therapy Types | Drugs | Outcome |
| XRCC5 | SNV | Missense_Mutation | rs764110781 | c.550N>T | p.Arg184Cys | p.R184C | P13010 | protein_coding | tolerated(0.2) | possibly_damaging(0.74) | TCGA-AN-A046-01 | Breast | breast invasive carcinoma | Female | >=65 | I/II | Unknown | Unknown | SD |
| XRCC5 | SNV | Missense_Mutation | c.2030N>A | p.Ile677Asn | p.I677N | P13010 | protein_coding | deleterious(0.04) | probably_damaging(0.917) | TCGA-AO-A03T-01 | Breast | breast invasive carcinoma | Female | <65 | I/II | Chemotherapy | cyclophosphamide | SD | |
| XRCC5 | deletion | Frame_Shift_Del | c.852delN | p.Glu287LysfsTer11 | p.E287Kfs*11 | P13010 | protein_coding | TCGA-A8-A09Z-01 | Breast | breast invasive carcinoma | Female | >=65 | I/II | Unknown | Unknown | SD | |||
| XRCC5 | insertion | In_Frame_Ins | novel | c.916_917insATTTCA | p.Leu306delinsTyrPheIle | p.L306delinsYFI | P13010 | protein_coding | TCGA-AC-A3QQ-01 | Breast | breast invasive carcinoma | Female | <65 | I/II | Unknown | Unknown | SD | ||
| XRCC5 | deletion | Frame_Shift_Del | novel | c.123delT | p.Phe41LeufsTer16 | p.F41Lfs*16 | P13010 | protein_coding | TCGA-D8-A27V-01 | Breast | breast invasive carcinoma | Female | <65 | I/II | Hormone Therapy | tamoxiphen | SD | ||
| XRCC5 | SNV | Missense_Mutation | rs781529290 | c.1231C>T | p.His411Tyr | p.H411Y | P13010 | protein_coding | tolerated(1) | benign(0.015) | TCGA-Q1-A5R2-01 | Cervix | cervical & endocervical cancer | Female | <65 | I/II | Chemotherapy | cisplatin | PR |
| XRCC5 | SNV | Missense_Mutation | novel | c.674N>T | p.Tyr225Phe | p.Y225F | P13010 | protein_coding | tolerated(0.11) | benign(0.143) | TCGA-ZJ-AAX4-01 | Cervix | cervical & endocervical cancer | Female | >=65 | I/II | Unknown | Unknown | SD |
| XRCC5 | SNV | Missense_Mutation | c.632N>C | p.Val211Ala | p.V211A | P13010 | protein_coding | deleterious(0.04) | benign(0.059) | TCGA-AA-3811-01 | Colorectum | colon adenocarcinoma | Female | >=65 | III/IV | Unknown | Unknown | PD | |
| XRCC5 | SNV | Missense_Mutation | novel | c.131G>A | p.Arg44Gln | p.R44Q | P13010 | protein_coding | deleterious(0.01) | probably_damaging(0.936) | TCGA-AA-3984-01 | Colorectum | colon adenocarcinoma | Female | <65 | I/II | Unknown | Unknown | SD |
| XRCC5 | SNV | Missense_Mutation | rs762387474 | c.1861G>A | p.Glu621Lys | p.E621K | P13010 | protein_coding | tolerated(0.24) | benign(0.052) | TCGA-AA-3984-01 | Colorectum | colon adenocarcinoma | Female | <65 | I/II | Unknown | Unknown | SD |
| Page: 1 2 3 4 5 6 7 8 9 10 |
Top |
Related drugs of malignant transformation related genes |
| Identification of chemicals and drugs interact with genes involved in malignant transfromation |
| (DGIdb 4.0) |
| Entrez ID | Symbol | Category | Interaction Types | Drug Claim Name | Drug Name | PMIDs |
| 7520 | XRCC5 | KINASE | CAMPTOTHECIN | CAMPTOTHECIN | 16230379 | |
| 7520 | XRCC5 | KINASE | CISPLATIN | CISPLATIN | 15944802 | |
| 7520 | XRCC5 | KINASE | TRIBUTYRIN | TRIBUTYRIN | 16000590 | |
| 7520 | XRCC5 | KINASE | thalidomide | THALIDOMIDE | 21435719 | |
| 7520 | XRCC5 | KINASE | PHENYLBUTYRATE | PHENYLBUTANOIC ACID | 16000590 | |
| 7520 | XRCC5 | KINASE | HYDROGEN PEROXIDE | 11121725 |
| Page: 1 |

Copyright 2023-Present -The University of Texas Health Science Center at Houston |