
|
|||||
|
 | |
| |
| |
| |
| |
| |
|
Gene: UBQLN1 |
Gene summary for UBQLN1 |
| Gene information | Species | Human | Gene symbol | UBQLN1 | Gene ID | 29979 |
| Gene name | ubiquilin 1 | |
| Gene Alias | DA41 | |
| Cytomap | 9q21.32 | |
| Gene Type | protein-coding | GO ID | GO:0000045 | UniProtAcc | Q9UMX0 |
Top |
Malignant transformation analysis |
| Identification of the aberrant gene expression in precancerous and cancerous lesions by comparing the gene expression of stem-like cells in diseased tissues with normal stem cells |
| Entrez ID | Symbol | Replicates | Species | Organ | Tissue | Adj P-value | Log2FC | Malignancy |
| 29979 | UBQLN1 | HTA11_99999965062_69753 | Human | Colorectum | MSI-H | 1.91e-02 | 8.20e-01 | 0.3487 |
| 29979 | UBQLN1 | A015-C-203 | Human | Colorectum | FAP | 3.83e-14 | -3.04e-01 | -0.1294 |
| 29979 | UBQLN1 | A002-C-201 | Human | Colorectum | FAP | 4.83e-02 | -1.96e-01 | 0.0324 |
| 29979 | UBQLN1 | A001-C-108 | Human | Colorectum | FAP | 1.69e-09 | -2.63e-01 | -0.0272 |
| 29979 | UBQLN1 | A002-C-205 | Human | Colorectum | FAP | 3.94e-07 | -3.54e-01 | -0.1236 |
| 29979 | UBQLN1 | A015-C-006 | Human | Colorectum | FAP | 6.70e-04 | -3.22e-01 | -0.0994 |
| 29979 | UBQLN1 | A015-C-106 | Human | Colorectum | FAP | 6.82e-04 | -2.28e-01 | -0.0511 |
| 29979 | UBQLN1 | A002-C-114 | Human | Colorectum | FAP | 2.86e-05 | -3.30e-01 | -0.1561 |
| 29979 | UBQLN1 | A015-C-104 | Human | Colorectum | FAP | 8.09e-14 | -2.63e-01 | -0.1899 |
| 29979 | UBQLN1 | A001-C-014 | Human | Colorectum | FAP | 1.56e-06 | -2.56e-01 | 0.0135 |
| 29979 | UBQLN1 | A002-C-016 | Human | Colorectum | FAP | 1.70e-10 | -2.45e-01 | 0.0521 |
| 29979 | UBQLN1 | A015-C-002 | Human | Colorectum | FAP | 1.16e-02 | -2.60e-01 | -0.0763 |
| 29979 | UBQLN1 | A001-C-203 | Human | Colorectum | FAP | 7.63e-06 | -2.50e-01 | -0.0481 |
| 29979 | UBQLN1 | A002-C-116 | Human | Colorectum | FAP | 7.00e-17 | -2.79e-01 | -0.0452 |
| 29979 | UBQLN1 | A014-C-008 | Human | Colorectum | FAP | 2.28e-03 | -3.11e-01 | -0.191 |
| 29979 | UBQLN1 | A018-E-020 | Human | Colorectum | FAP | 2.45e-05 | -2.77e-01 | -0.2034 |
| 29979 | UBQLN1 | F034 | Human | Colorectum | FAP | 1.72e-12 | -3.14e-01 | -0.0665 |
| 29979 | UBQLN1 | F072B | Human | Colorectum | FAP | 1.08e-04 | -1.50e-01 | 0.257 |
| 29979 | UBQLN1 | LZE2T | Human | Esophagus | ESCC | 6.71e-05 | 4.33e-01 | 0.082 |
| 29979 | UBQLN1 | LZE4T | Human | Esophagus | ESCC | 1.96e-20 | 5.49e-01 | 0.0811 |
| Page: 1 2 3 4 5 6 7 8 |
| Tissue | Expression Dynamics | Abbreviation |
| Colorectum (GSE201348) |  | FAP: Familial adenomatous polyposis |
| CRC: Colorectal cancer | ||
| Colorectum (HTA11) |  | AD: Adenomas |
| SER: Sessile serrated lesions | ||
| MSI-H: Microsatellite-high colorectal cancer | ||
| MSS: Microsatellite stable colorectal cancer | ||
| Esophagus | 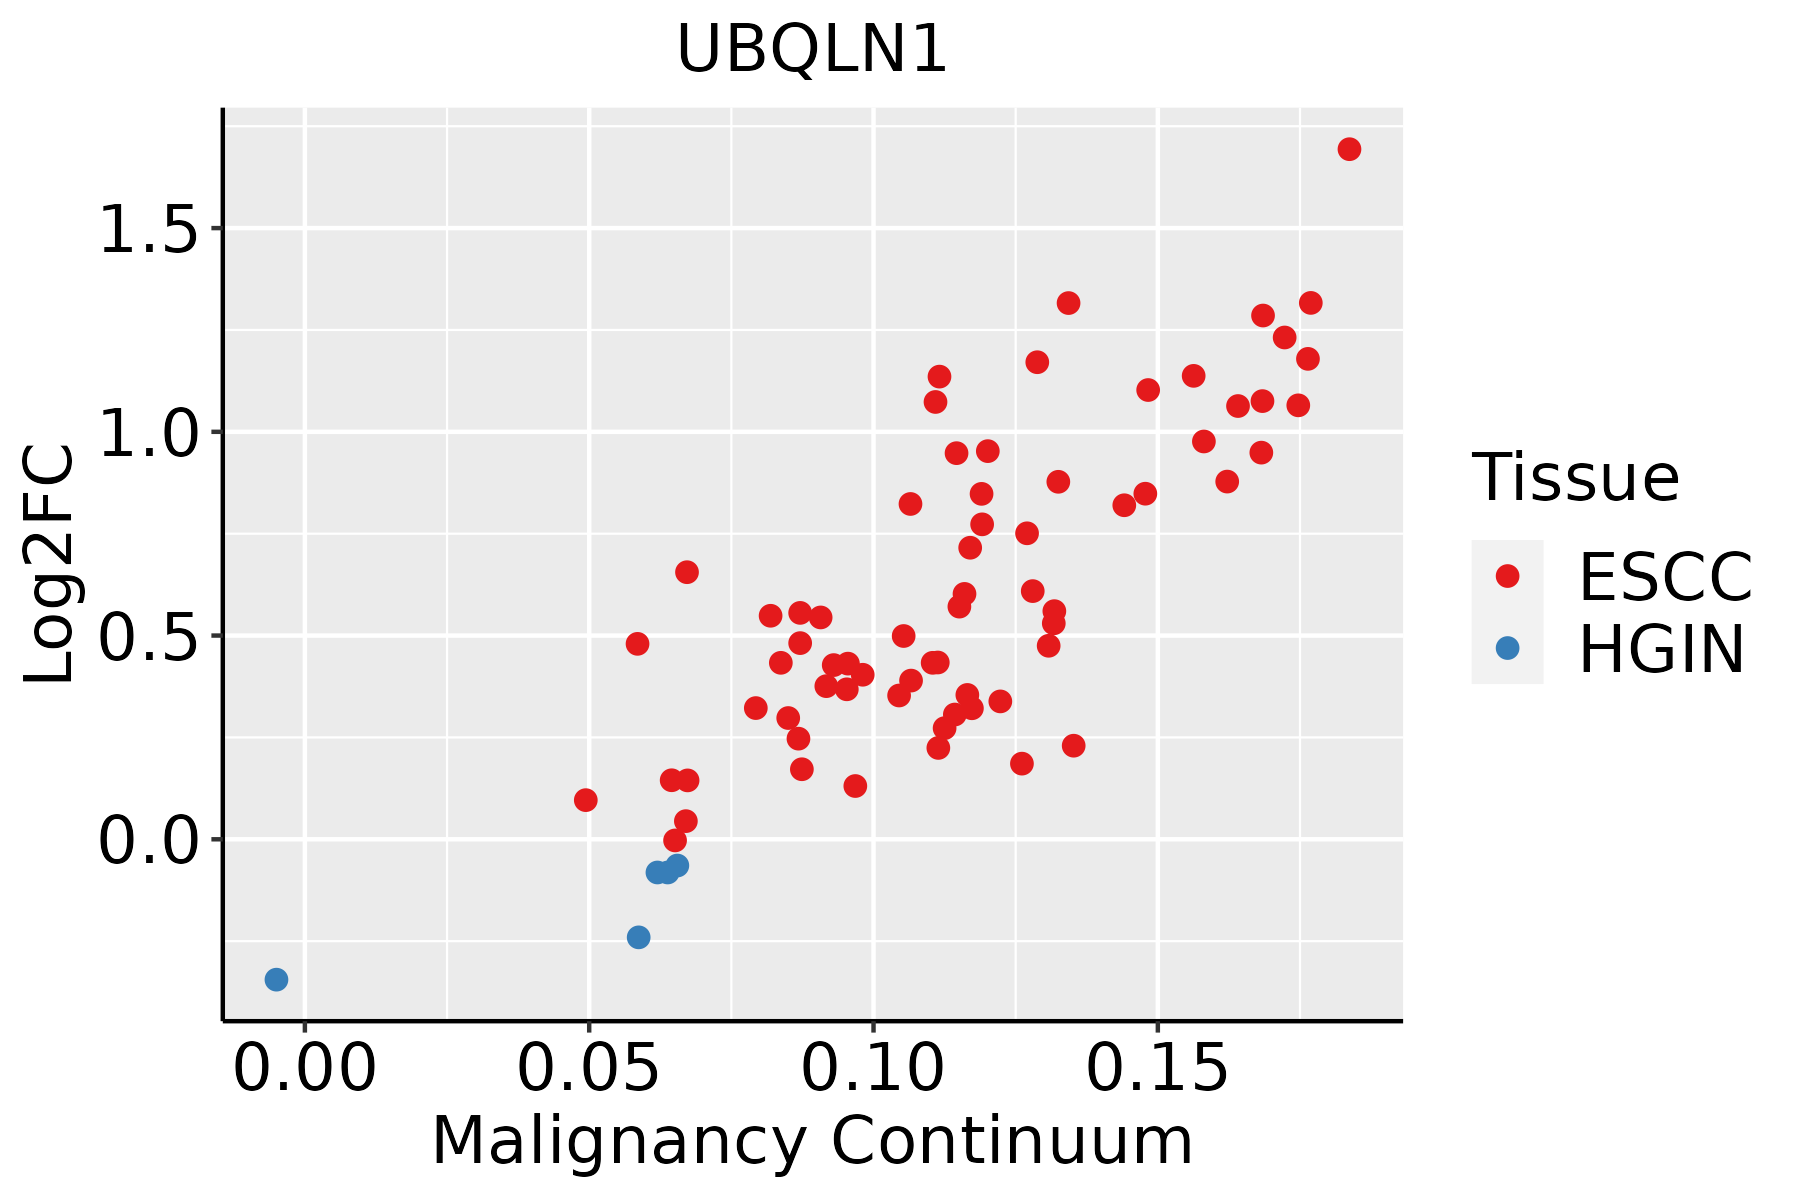 | ESCC: Esophageal squamous cell carcinoma |
| HGIN: High-grade intraepithelial neoplasias | ||
| LGIN: Low-grade intraepithelial neoplasias | ||
| Liver | 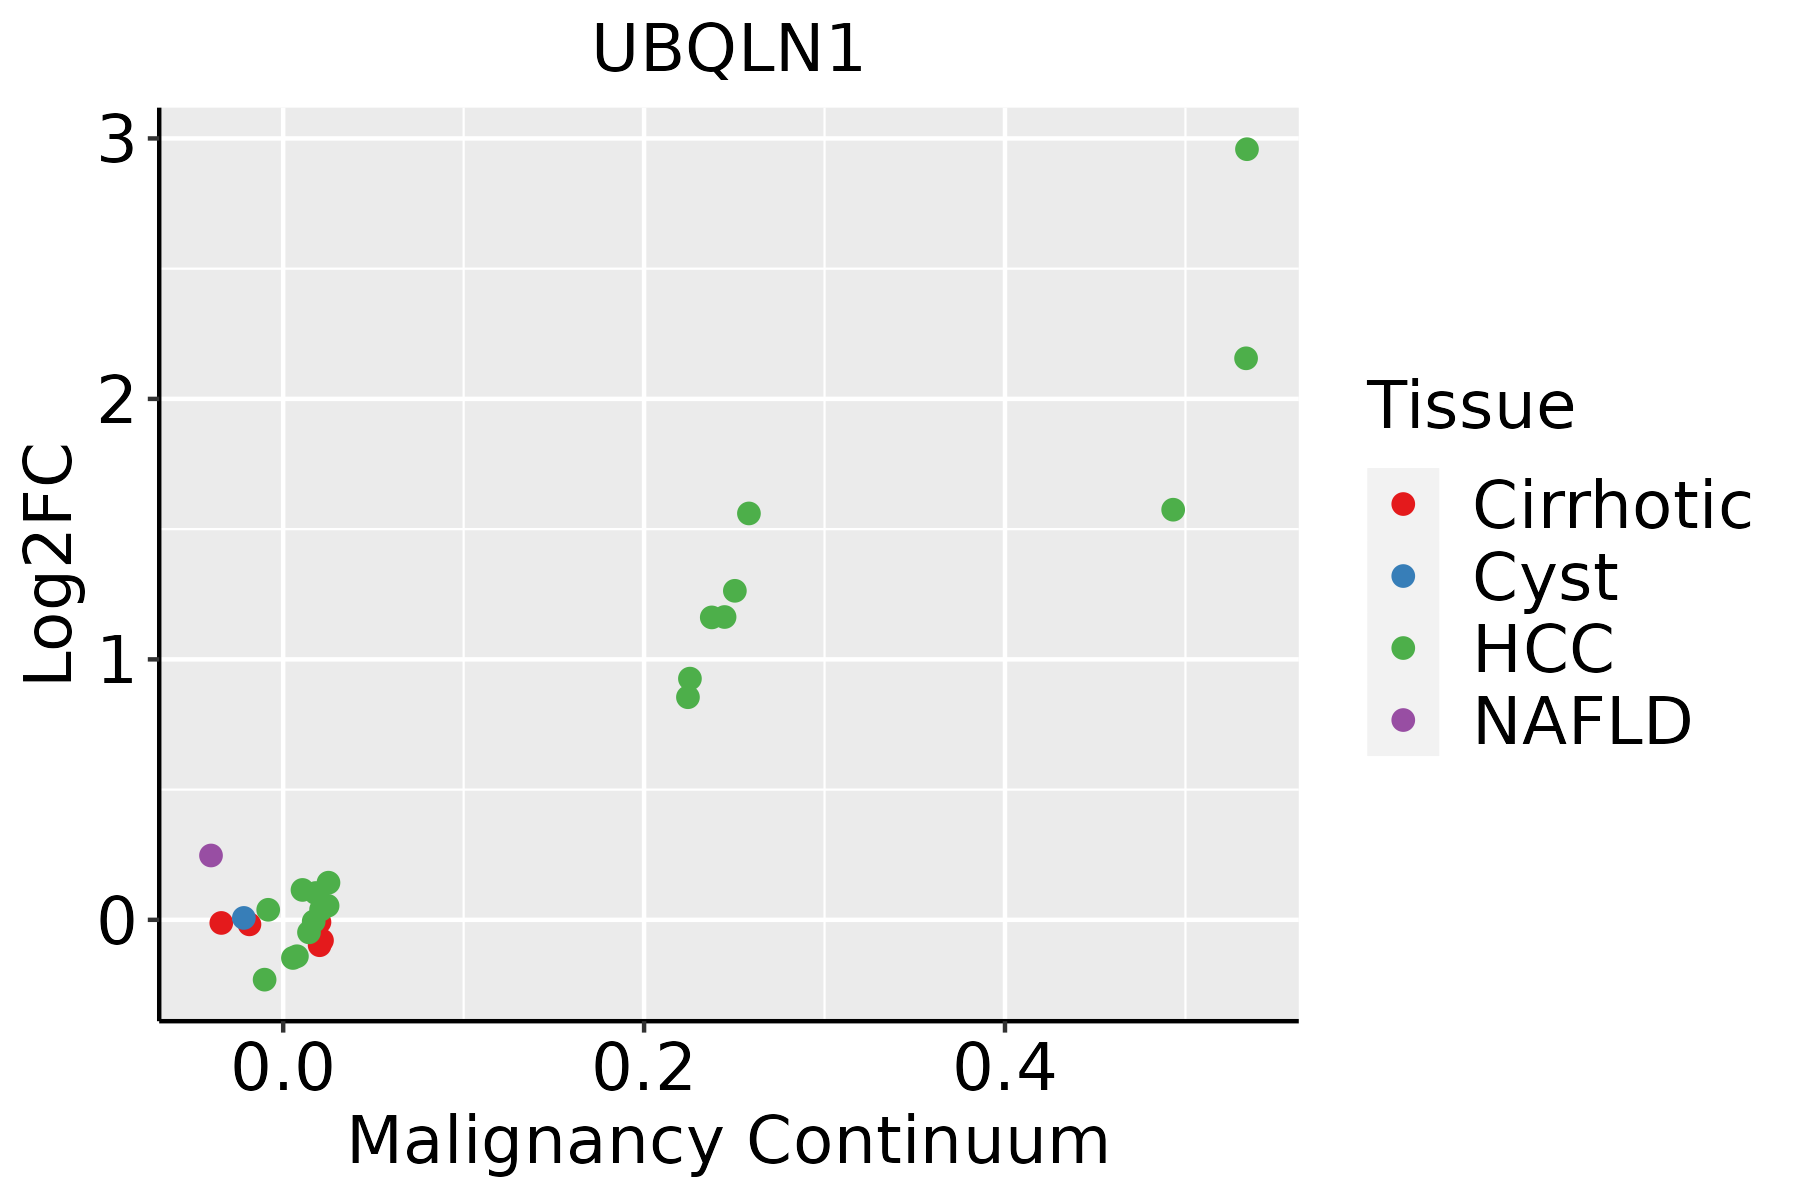 | HCC: Hepatocellular carcinoma |
| NAFLD: Non-alcoholic fatty liver disease | ||
| Oral Cavity |  | EOLP: Erosive Oral lichen planus |
| LP: leukoplakia | ||
| NEOLP: Non-erosive oral lichen planus | ||
| OSCC: Oral squamous cell carcinoma | ||
| Skin | 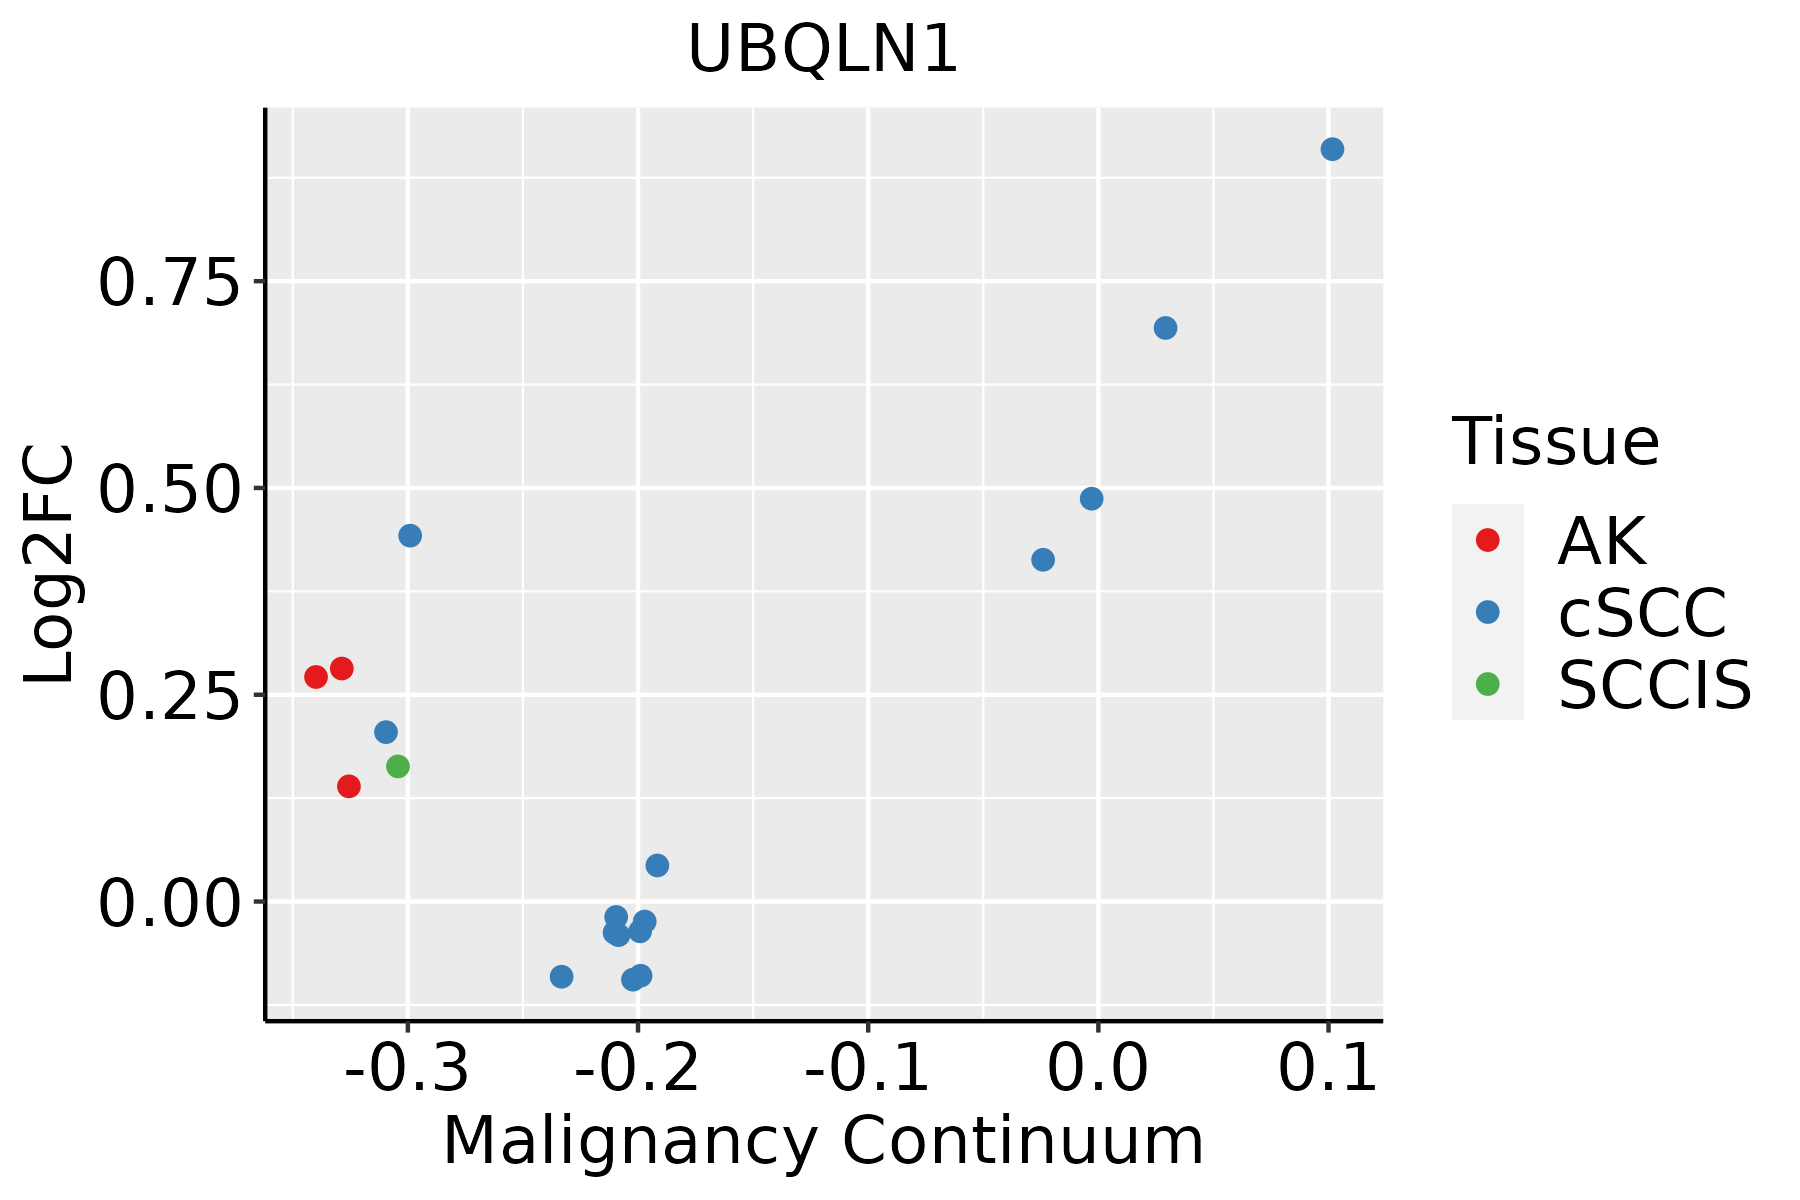 | AK: Actinic keratosis |
| cSCC: Cutaneous squamous cell carcinoma | ||
| SCCIS:squamous cell carcinoma in situ | ||
| Thyroid | 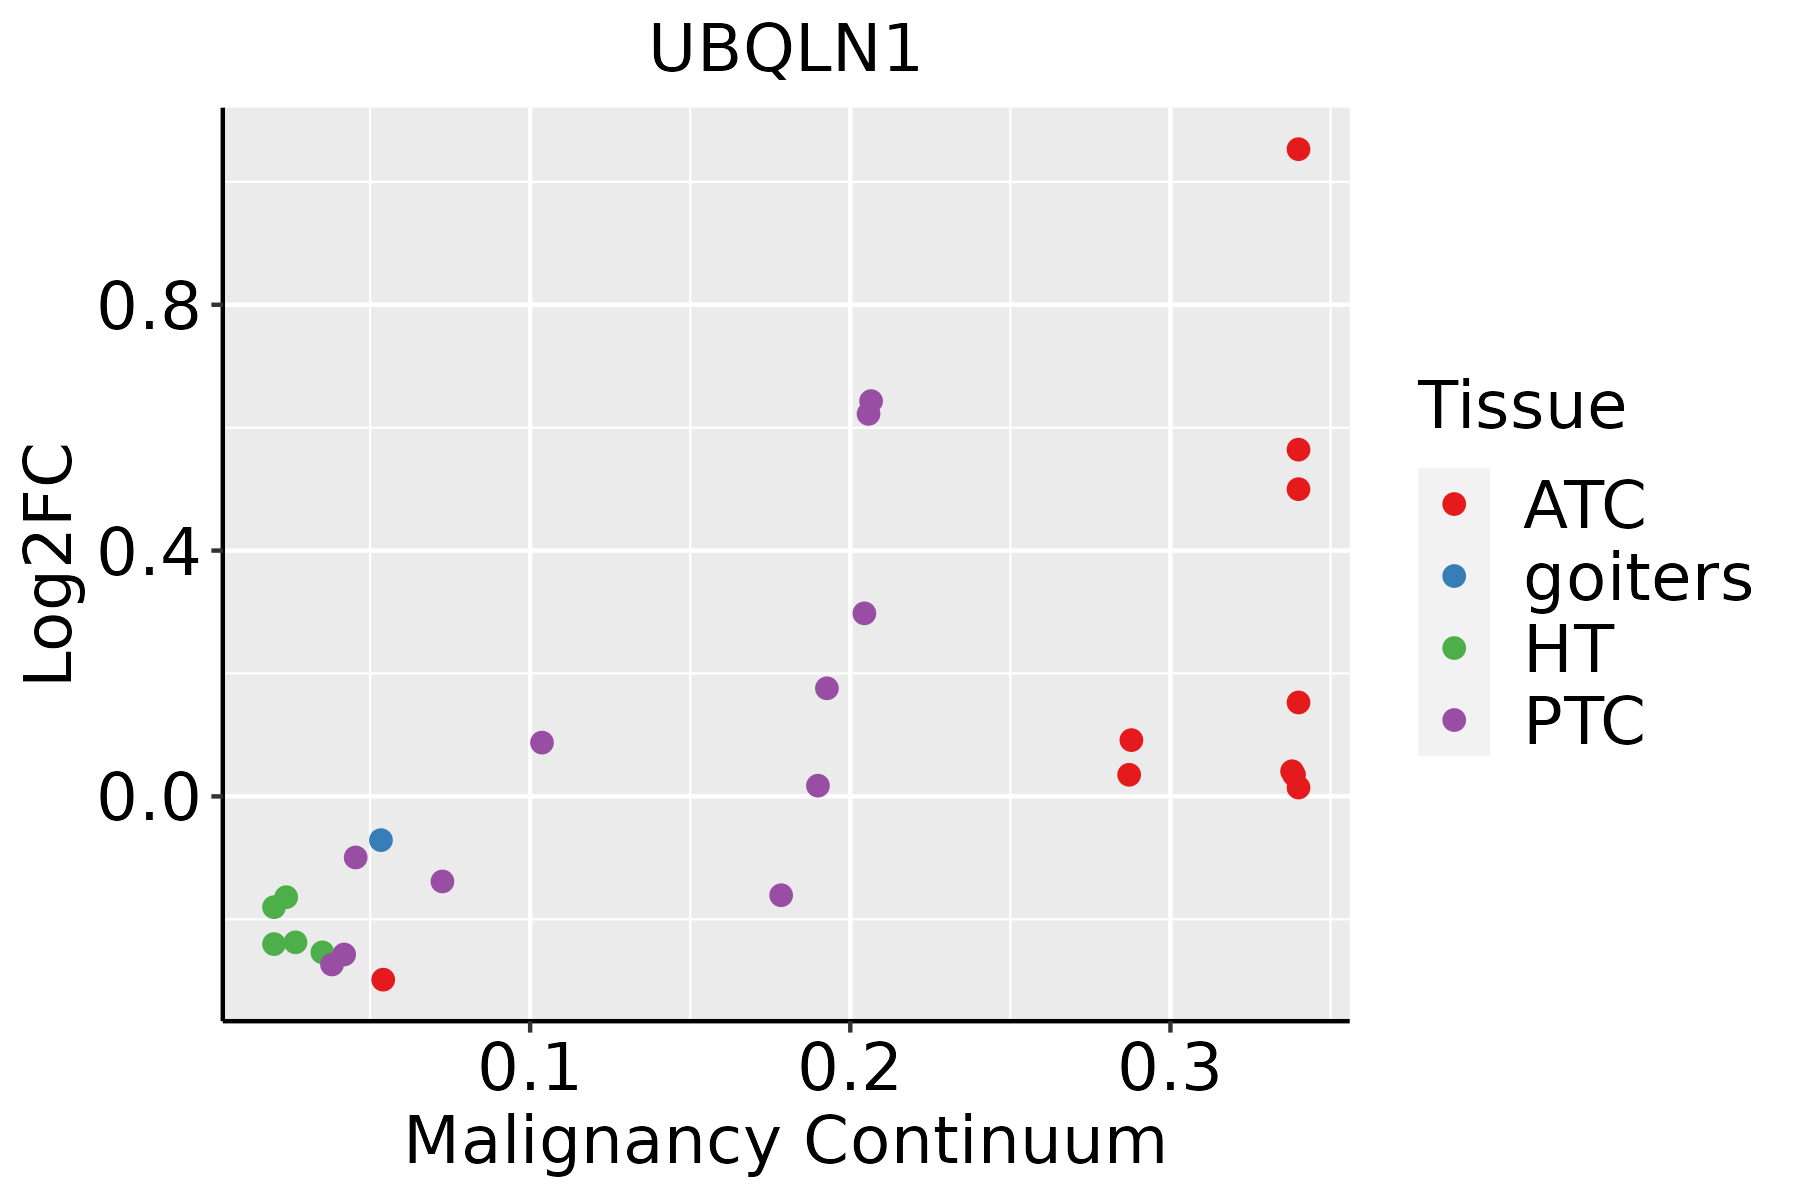 | ATC: Anaplastic thyroid cancer |
| HT: Hashimoto's thyroiditis | ||
| PTC: Papillary thyroid cancer |
| ∗log2FC in expression of this searched gene in stem-like cells from each diseased tissue sample relative to stem-like cells in normal samples in each tissue plotted against the malignancy continuum. Samples are colored based on if they are from different disease stage. |
Top |
Malignant transformation related pathway analysis |
| Find out the enriched GO biological processes and KEGG pathways involved in transition from healthy to precancer to cancer |
| Tissue | Disease Stage | Enriched GO biological Processes |
| Colorectum | AD |  |
| Colorectum | SER |  |
| Colorectum | MSS |  |
| Colorectum | MSI-H |  |
| Colorectum | FAP |  |
| ∗Top 15 enriched GO BP terms are showed in the bar plot of each disease state in each tissue. Each row represents a significant GO biological process which is colored according to the -log10(p.adjust). |
| Page: 1 2 3 4 5 6 7 8 9 |
| GO ID | Tissue | Disease Stage | Description | Gene Ratio | Bg Ratio | pvalue | p.adjust | Count |
| GO:000004531 | Oral cavity | NEOLP | autophagosome assembly | 22/2005 | 99/18723 | 6.64e-04 | 5.54e-03 | 22 |
| GO:001624131 | Oral cavity | NEOLP | regulation of macroautophagy | 28/2005 | 141/18723 | 9.15e-04 | 7.13e-03 | 28 |
| GO:003647323 | Oral cavity | NEOLP | cell death in response to oxidative stress | 21/2005 | 95/18723 | 9.36e-04 | 7.25e-03 | 21 |
| GO:005105113 | Oral cavity | NEOLP | negative regulation of transport | 72/2005 | 470/18723 | 1.14e-03 | 8.49e-03 | 72 |
| GO:19050373 | Oral cavity | NEOLP | autophagosome organization | 22/2005 | 103/18723 | 1.16e-03 | 8.66e-03 | 22 |
| GO:190288219 | Oral cavity | NEOLP | regulation of response to oxidative stress | 21/2005 | 98/18723 | 1.42e-03 | 1.01e-02 | 21 |
| GO:190589831 | Oral cavity | NEOLP | positive regulation of response to endoplasmic reticulum stress | 10/2005 | 35/18723 | 2.88e-03 | 1.77e-02 | 10 |
| GO:00109598 | Oral cavity | NEOLP | regulation of metal ion transport | 59/2005 | 406/18723 | 9.36e-03 | 4.44e-02 | 59 |
| GO:004217628 | Skin | AK | regulation of protein catabolic process | 101/1910 | 391/18723 | 4.78e-19 | 9.43e-16 | 101 |
| GO:009719328 | Skin | AK | intrinsic apoptotic signaling pathway | 82/1910 | 288/18723 | 2.01e-18 | 2.97e-15 | 82 |
| GO:200123328 | Skin | AK | regulation of apoptotic signaling pathway | 91/1910 | 356/18723 | 5.72e-17 | 4.84e-14 | 91 |
| GO:190336228 | Skin | AK | regulation of cellular protein catabolic process | 72/1910 | 255/18723 | 3.99e-16 | 1.97e-13 | 72 |
| GO:200124228 | Skin | AK | regulation of intrinsic apoptotic signaling pathway | 54/1910 | 164/18723 | 1.64e-15 | 7.48e-13 | 54 |
| GO:190305028 | Skin | AK | regulation of proteolysis involved in cellular protein catabolic process | 61/1910 | 221/18723 | 2.17e-13 | 6.12e-11 | 61 |
| GO:200005828 | Skin | AK | regulation of ubiquitin-dependent protein catabolic process | 50/1910 | 164/18723 | 5.25e-13 | 1.41e-10 | 50 |
| GO:190332028 | Skin | AK | regulation of protein modification by small protein conjugation or removal | 62/1910 | 242/18723 | 4.90e-12 | 1.04e-09 | 62 |
| GO:003243428 | Skin | AK | regulation of proteasomal ubiquitin-dependent protein catabolic process | 41/1910 | 134/18723 | 5.64e-11 | 1.01e-08 | 41 |
| GO:001049827 | Skin | AK | proteasomal protein catabolic process | 97/1910 | 490/18723 | 9.65e-11 | 1.54e-08 | 97 |
| GO:003139628 | Skin | AK | regulation of protein ubiquitination | 54/1910 | 210/18723 | 9.94e-11 | 1.55e-08 | 54 |
| GO:006113628 | Skin | AK | regulation of proteasomal protein catabolic process | 50/1910 | 187/18723 | 1.09e-10 | 1.66e-08 | 50 |
| Page: 1 2 3 4 5 6 7 8 9 10 11 12 13 14 15 16 17 18 19 20 21 22 23 24 25 26 27 28 29 30 31 32 33 34 |
| Pathway ID | Tissue | Disease Stage | Description | Gene Ratio | Bg Ratio | pvalue | p.adjust | qvalue | Count |
| hsa050146 | Colorectum | MSI-H | Amyotrophic lateral sclerosis | 95/797 | 364/8465 | 2.31e-21 | 1.50e-19 | 1.26e-19 | 95 |
| hsa041416 | Colorectum | MSI-H | Protein processing in endoplasmic reticulum | 46/797 | 174/8465 | 4.53e-11 | 9.78e-10 | 8.19e-10 | 46 |
| hsa050147 | Colorectum | MSI-H | Amyotrophic lateral sclerosis | 95/797 | 364/8465 | 2.31e-21 | 1.50e-19 | 1.26e-19 | 95 |
| hsa041417 | Colorectum | MSI-H | Protein processing in endoplasmic reticulum | 46/797 | 174/8465 | 4.53e-11 | 9.78e-10 | 8.19e-10 | 46 |
| hsa050148 | Colorectum | FAP | Amyotrophic lateral sclerosis | 91/1404 | 364/8465 | 1.84e-05 | 2.36e-04 | 1.44e-04 | 91 |
| hsa041418 | Colorectum | FAP | Protein processing in endoplasmic reticulum | 50/1404 | 174/8465 | 3.64e-05 | 3.68e-04 | 2.24e-04 | 50 |
| hsa050149 | Colorectum | FAP | Amyotrophic lateral sclerosis | 91/1404 | 364/8465 | 1.84e-05 | 2.36e-04 | 1.44e-04 | 91 |
| hsa041419 | Colorectum | FAP | Protein processing in endoplasmic reticulum | 50/1404 | 174/8465 | 3.64e-05 | 3.68e-04 | 2.24e-04 | 50 |
| hsa04141211 | Esophagus | ESCC | Protein processing in endoplasmic reticulum | 147/4205 | 174/8465 | 3.29e-22 | 1.10e-19 | 5.64e-20 | 147 |
| hsa05014210 | Esophagus | ESCC | Amyotrophic lateral sclerosis | 266/4205 | 364/8465 | 1.31e-20 | 2.20e-18 | 1.13e-18 | 266 |
| hsa04141310 | Esophagus | ESCC | Protein processing in endoplasmic reticulum | 147/4205 | 174/8465 | 3.29e-22 | 1.10e-19 | 5.64e-20 | 147 |
| hsa0501438 | Esophagus | ESCC | Amyotrophic lateral sclerosis | 266/4205 | 364/8465 | 1.31e-20 | 2.20e-18 | 1.13e-18 | 266 |
| hsa0414114 | Liver | Cirrhotic | Protein processing in endoplasmic reticulum | 114/2530 | 174/8465 | 1.16e-22 | 9.67e-21 | 5.96e-21 | 114 |
| hsa0501414 | Liver | Cirrhotic | Amyotrophic lateral sclerosis | 187/2530 | 364/8465 | 1.56e-18 | 6.50e-17 | 4.01e-17 | 187 |
| hsa0414115 | Liver | Cirrhotic | Protein processing in endoplasmic reticulum | 114/2530 | 174/8465 | 1.16e-22 | 9.67e-21 | 5.96e-21 | 114 |
| hsa0501415 | Liver | Cirrhotic | Amyotrophic lateral sclerosis | 187/2530 | 364/8465 | 1.56e-18 | 6.50e-17 | 4.01e-17 | 187 |
| hsa0414122 | Liver | HCC | Protein processing in endoplasmic reticulum | 146/4020 | 174/8465 | 7.34e-24 | 2.46e-21 | 1.37e-21 | 146 |
| hsa0501422 | Liver | HCC | Amyotrophic lateral sclerosis | 252/4020 | 364/8465 | 8.85e-18 | 7.41e-16 | 4.12e-16 | 252 |
| hsa0414132 | Liver | HCC | Protein processing in endoplasmic reticulum | 146/4020 | 174/8465 | 7.34e-24 | 2.46e-21 | 1.37e-21 | 146 |
| hsa0501432 | Liver | HCC | Amyotrophic lateral sclerosis | 252/4020 | 364/8465 | 8.85e-18 | 7.41e-16 | 4.12e-16 | 252 |
| Page: 1 2 |
Top |
Cell-cell communication analysis |
| Identification of potential cell-cell interactions between two cell types and their ligand-receptor pairs for different disease states |
| Ligand | Receptor | LRpair | Pathway | Tissue | Disease Stage |
| Page: 1 |
Top |
Single-cell gene regulatory network inference analysis |
| Find out the significant the regulons (TFs) and the target genes of each regulon across cell types for different disease states |
| TF | Cell Type | Tissue | Disease Stage | Target Gene | RSS | Regulon Activity |
| ∗The dot plots of a searched regulon are shown for all cell subpopulations in each disease state of each tissue based on the regulon specific score inferred using pySCENIC and by calculating the average expression. |
| Page: 1 |
Top |
Somatic mutation of malignant transformation related genes |
| Annotation of somatic variants for genes involved in malignant transformation |
| Hugo Symbol | Variant Class | Variant Classification | dbSNP RS | HGVSc | HGVSp | HGVSp Short | SWISSPROT | BIOTYPE | SIFT | PolyPhen | Tumor Sample Barcode | Tissue | Histology | Sex | Age | Stage | Therapy Types | Drugs | Outcome |
| UBQLN1 | SNV | Missense_Mutation | c.1615N>G | p.Gln539Glu | p.Q539E | Q9UMX0 | protein_coding | deleterious(0.02) | probably_damaging(0.943) | TCGA-D8-A1JA-01 | Breast | breast invasive carcinoma | Female | <65 | III/IV | Chemotherapy | adriamycin | PD | |
| UBQLN1 | SNV | Missense_Mutation | novel | c.1727N>C | p.Ile576Thr | p.I576T | Q9UMX0 | protein_coding | deleterious(0.05) | probably_damaging(0.995) | TCGA-2W-A8YY-01 | Cervix | cervical & endocervical cancer | Female | <65 | I/II | Chemotherapy | cisplatin | CR |
| UBQLN1 | SNV | Missense_Mutation | c.1642N>G | p.Gln548Glu | p.Q548E | Q9UMX0 | protein_coding | deleterious(0.01) | probably_damaging(0.991) | TCGA-C5-A7CL-01 | Cervix | cervical & endocervical cancer | Female | <65 | III/IV | Chemotherapy | cisplatin | PD | |
| UBQLN1 | SNV | Missense_Mutation | c.914N>T | p.Ser305Phe | p.S305F | Q9UMX0 | protein_coding | deleterious(0) | possibly_damaging(0.736) | TCGA-JX-A3Q0-01 | Cervix | cervical & endocervical cancer | Female | <65 | III/IV | Unknown | Unknown | SD | |
| UBQLN1 | SNV | Missense_Mutation | c.567C>G | p.Ile189Met | p.I189M | Q9UMX0 | protein_coding | tolerated(0.16) | benign(0.062) | TCGA-Q1-A73O-01 | Cervix | cervical & endocervical cancer | Female | <65 | I/II | Chemotherapy | cisplatin | CR | |
| UBQLN1 | SNV | Missense_Mutation | rs764735825 | c.162G>T | p.Glu54Asp | p.E54D | Q9UMX0 | protein_coding | tolerated(0.45) | probably_damaging(0.976) | TCGA-AA-A00N-01 | Colorectum | colon adenocarcinoma | Male | >=65 | I/II | Unknown | Unknown | PD |
| UBQLN1 | SNV | Missense_Mutation | c.407A>C | p.Asn136Thr | p.N136T | Q9UMX0 | protein_coding | tolerated(0.8) | benign(0.01) | TCGA-AA-A010-01 | Colorectum | colon adenocarcinoma | Female | <65 | I/II | Chemotherapy | folinic | CR | |
| UBQLN1 | SNV | Missense_Mutation | c.1363T>C | p.Ser455Pro | p.S455P | Q9UMX0 | protein_coding | deleterious(0.02) | possibly_damaging(0.849) | TCGA-AU-6004-01 | Colorectum | colon adenocarcinoma | Female | >=65 | I/II | Unknown | Unknown | SD | |
| UBQLN1 | SNV | Missense_Mutation | novel | c.560N>C | p.Val187Ala | p.V187A | Q9UMX0 | protein_coding | tolerated(0.66) | benign(0.278) | TCGA-AZ-4315-01 | Colorectum | colon adenocarcinoma | Male | <65 | I/II | Unknown | Unknown | SD |
| UBQLN1 | SNV | Missense_Mutation | c.558N>T | p.Met186Ile | p.M186I | Q9UMX0 | protein_coding | deleterious(0.01) | benign(0.114) | TCGA-AZ-4614-01 | Colorectum | colon adenocarcinoma | Female | >=65 | I/II | Unknown | Unknown | PD |
| Page: 1 2 3 4 5 |
Top |
Related drugs of malignant transformation related genes |
| Identification of chemicals and drugs interact with genes involved in malignant transfromation |
| (DGIdb 4.0) |
| Entrez ID | Symbol | Category | Interaction Types | Drug Claim Name | Drug Name | PMIDs |
| Page: 1 |

Copyright 2023-Present -The University of Texas Health Science Center at Houston |