| Tissue | Expression Dynamics | Abbreviation |
| Cervix |  | CC: Cervix cancer |
| HSIL_HPV: HPV-infected high-grade squamous intraepithelial lesions |
| N_HPV: HPV-infected normal cervix |
| Esophagus |  | ESCC: Esophageal squamous cell carcinoma |
| HGIN: High-grade intraepithelial neoplasias |
| LGIN: Low-grade intraepithelial neoplasias |
| Lung | 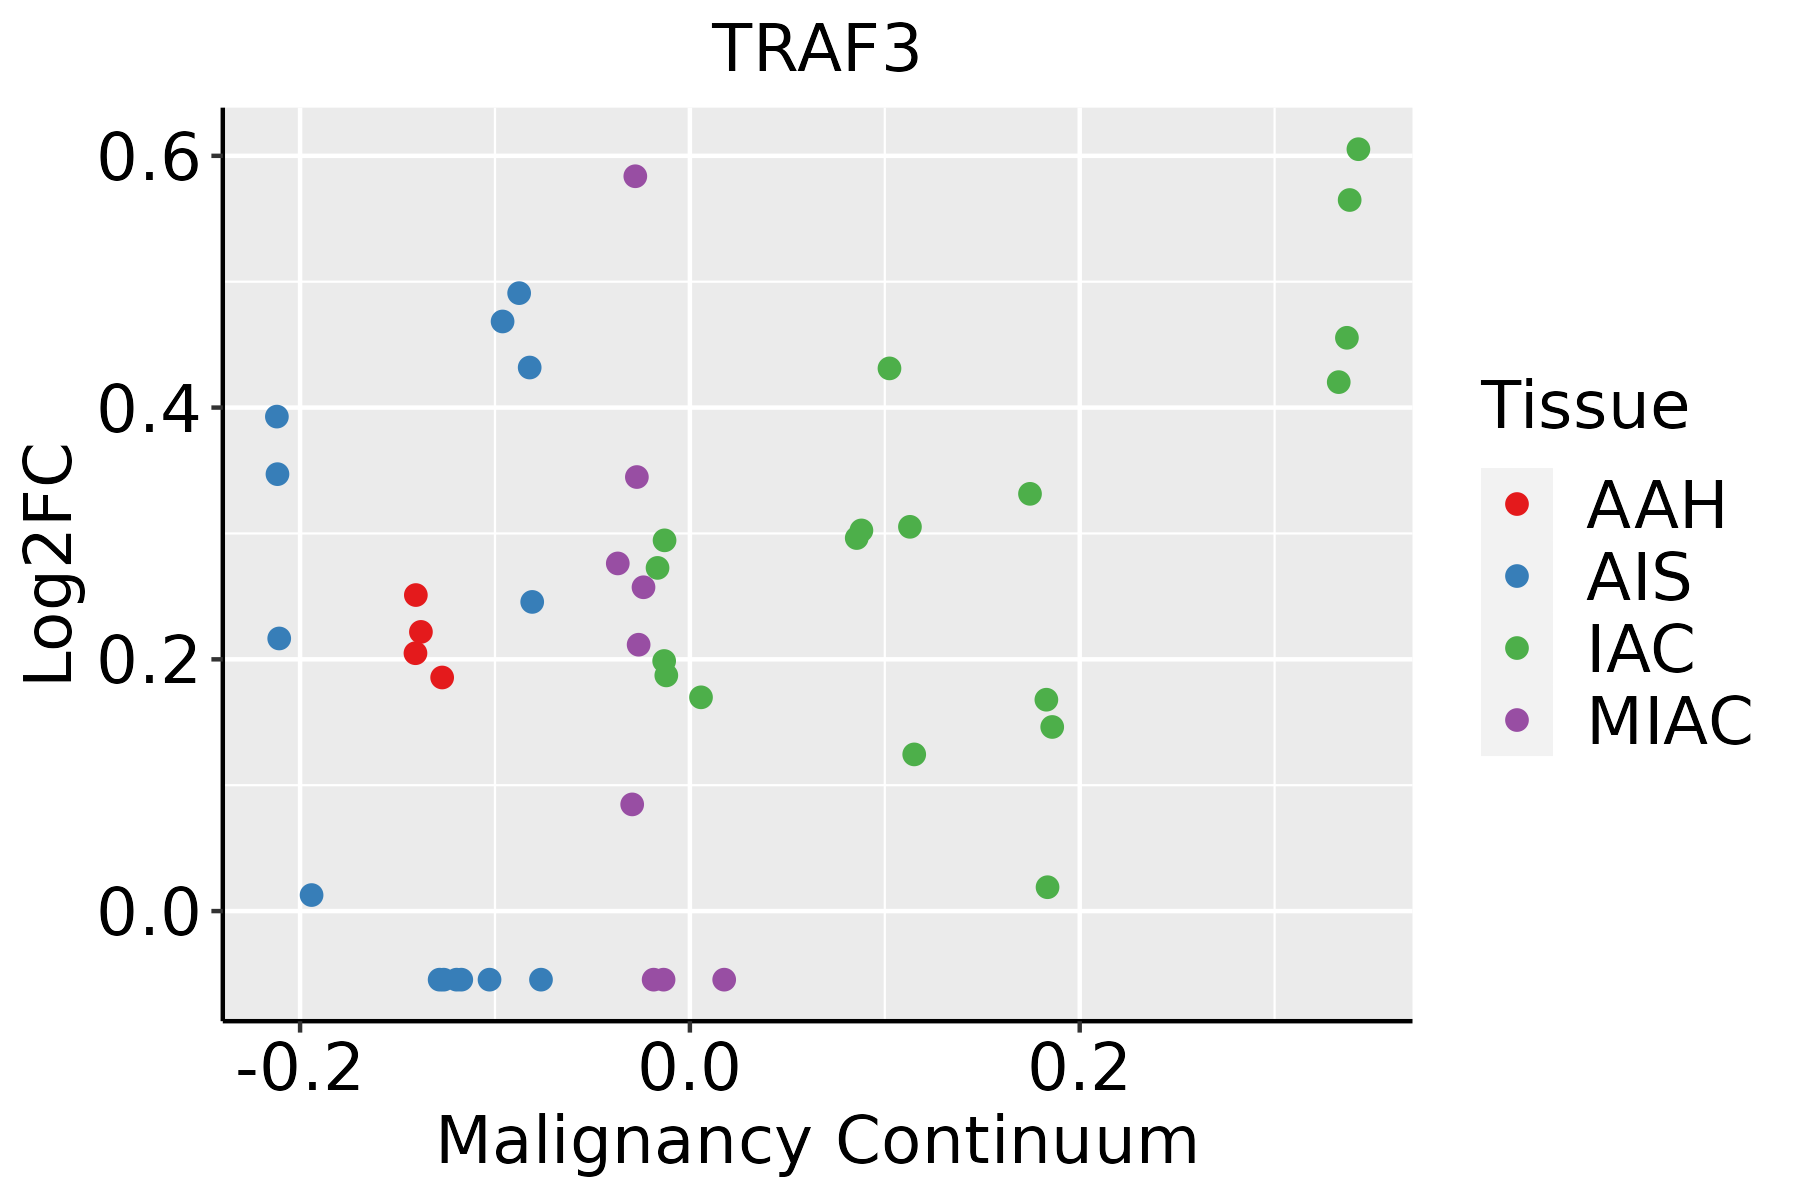 | AAH: Atypical adenomatous hyperplasia |
| AIS: Adenocarcinoma in situ |
| IAC: Invasive lung adenocarcinoma |
| MIA: Minimally invasive adenocarcinoma |
| Oral Cavity |  | EOLP: Erosive Oral lichen planus |
| LP: leukoplakia |
| NEOLP: Non-erosive oral lichen planus |
| OSCC: Oral squamous cell carcinoma |
| Prostate | 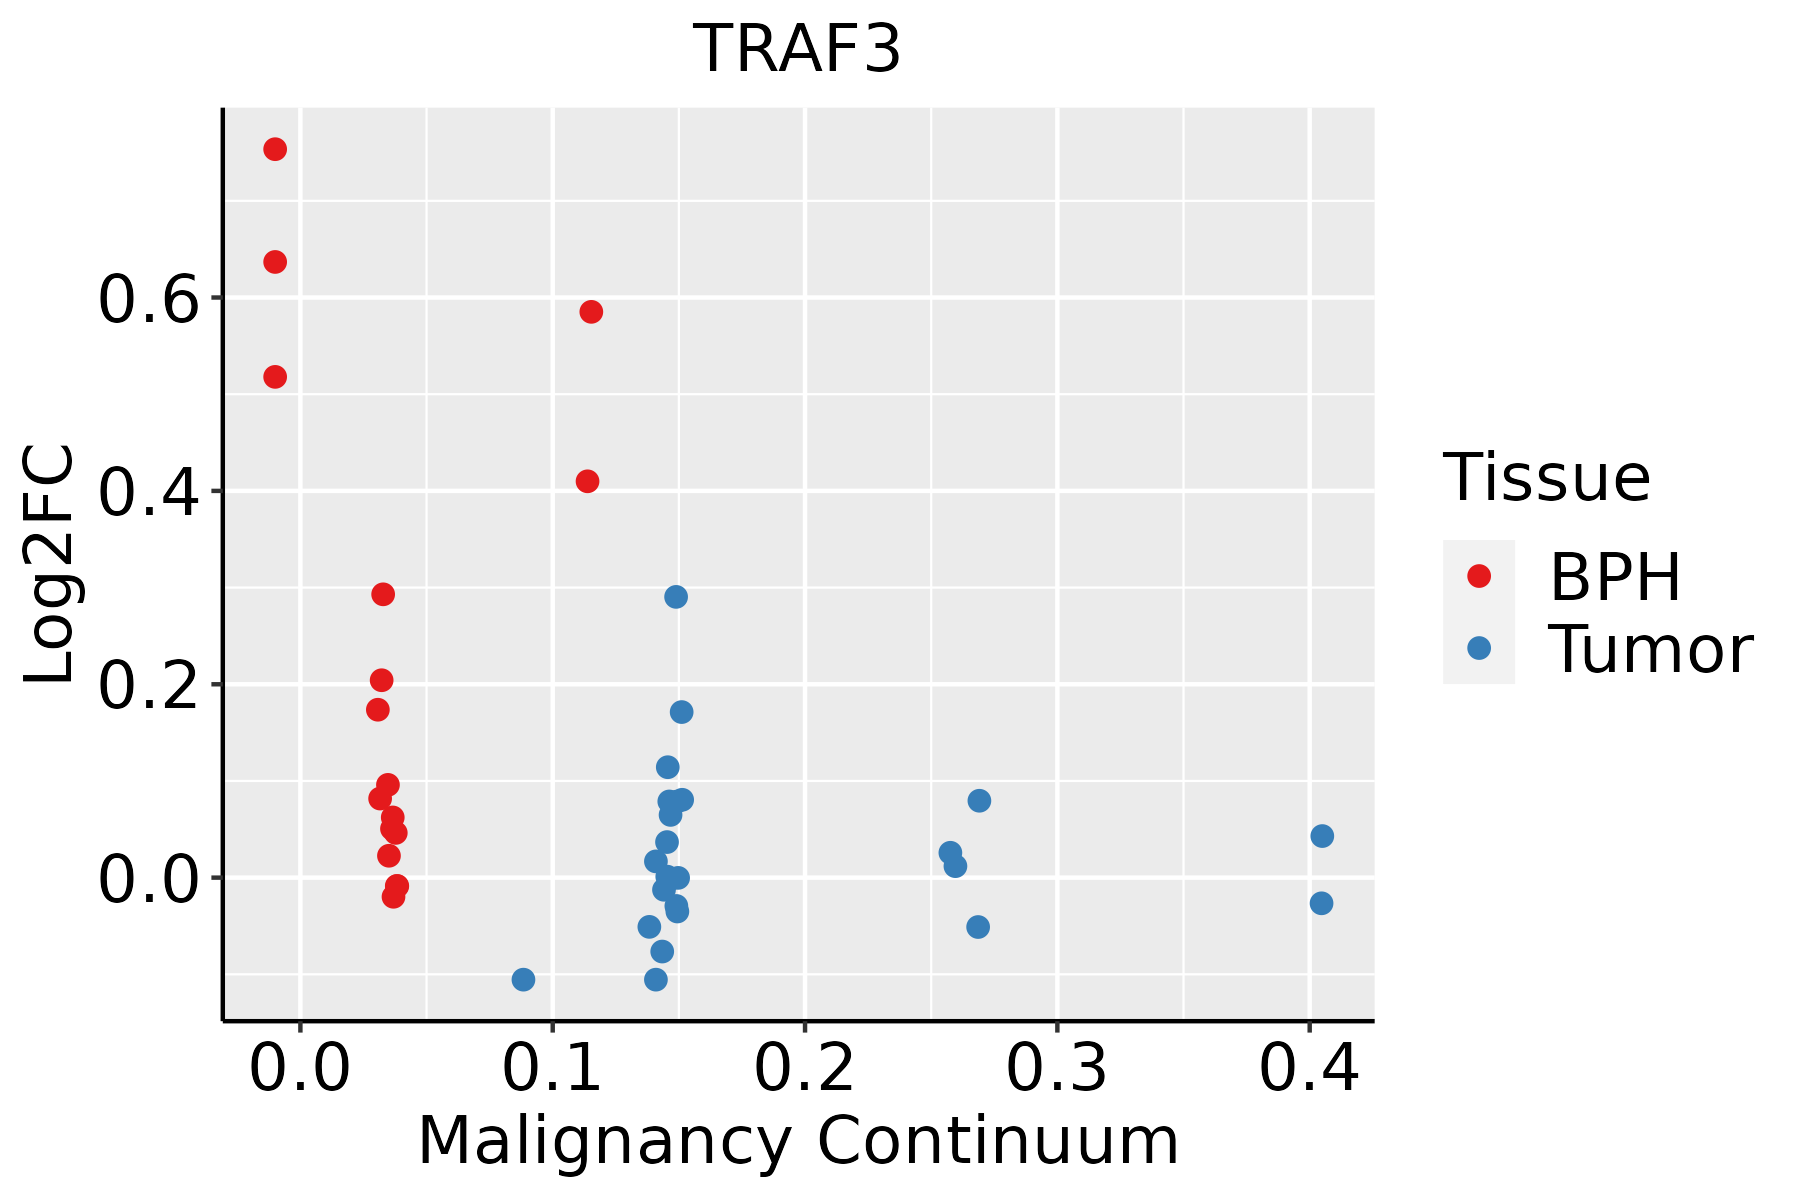 | BPH: Benign Prostatic Hyperplasia |
| GO ID | Tissue | Disease Stage | Description | Gene Ratio | Bg Ratio | pvalue | p.adjust | Count |
| GO:0009410110 | Skin | cSCC | response to xenobiotic stimulus | 151/4864 | 462/18723 | 6.76e-04 | 4.82e-03 | 151 |
| GO:003461226 | Skin | cSCC | response to tumor necrosis factor | 88/4864 | 253/18723 | 1.11e-03 | 7.31e-03 | 88 |
| GO:003320915 | Skin | cSCC | tumor necrosis factor-mediated signaling pathway | 39/4864 | 99/18723 | 2.33e-03 | 1.36e-02 | 39 |
| GO:007135625 | Skin | cSCC | cellular response to tumor necrosis factor | 79/4864 | 229/18723 | 2.48e-03 | 1.42e-02 | 79 |
| GO:004348915 | Skin | cSCC | RNA stabilization | 27/4864 | 65/18723 | 4.45e-03 | 2.29e-02 | 27 |
| GO:0043254113 | Thyroid | PTC | regulation of protein-containing complex assembly | 215/5968 | 428/18723 | 1.23e-15 | 9.09e-14 | 215 |
| GO:0010563113 | Thyroid | PTC | negative regulation of phosphorus metabolic process | 219/5968 | 442/18723 | 4.47e-15 | 3.07e-13 | 219 |
| GO:0045936113 | Thyroid | PTC | negative regulation of phosphate metabolic process | 218/5968 | 441/18723 | 7.08e-15 | 4.75e-13 | 218 |
| GO:0001933113 | Thyroid | PTC | negative regulation of protein phosphorylation | 173/5968 | 342/18723 | 3.46e-13 | 1.75e-11 | 173 |
| GO:0042326113 | Thyroid | PTC | negative regulation of phosphorylation | 189/5968 | 385/18723 | 1.00e-12 | 4.64e-11 | 189 |
| GO:0030705111 | Thyroid | PTC | cytoskeleton-dependent intracellular transport | 104/5968 | 195/18723 | 3.87e-10 | 1.24e-08 | 104 |
| GO:007050717 | Thyroid | PTC | regulation of microtubule cytoskeleton organization | 80/5968 | 148/18723 | 1.79e-08 | 4.19e-07 | 80 |
| GO:00315037 | Thyroid | PTC | protein-containing complex localization | 107/5968 | 220/18723 | 1.47e-07 | 2.82e-06 | 107 |
| GO:00109709 | Thyroid | PTC | transport along microtubule | 80/5968 | 155/18723 | 2.48e-07 | 4.32e-06 | 80 |
| GO:000961520 | Thyroid | PTC | response to virus | 162/5968 | 367/18723 | 4.52e-07 | 7.41e-06 | 162 |
| GO:000182215 | Thyroid | PTC | kidney development | 133/5968 | 293/18723 | 7.57e-07 | 1.18e-05 | 133 |
| GO:000165517 | Thyroid | PTC | urogenital system development | 149/5968 | 338/18723 | 1.41e-06 | 2.01e-05 | 149 |
| GO:007200114 | Thyroid | PTC | renal system development | 135/5968 | 302/18723 | 1.76e-06 | 2.43e-05 | 135 |
| GO:00991115 | Thyroid | PTC | microtubule-based transport | 88/5968 | 190/18723 | 2.08e-05 | 2.08e-04 | 88 |
| GO:0031333112 | Thyroid | PTC | negative regulation of protein-containing complex assembly | 68/5968 | 141/18723 | 3.61e-05 | 3.37e-04 | 68 |
| Pathway ID | Tissue | Disease Stage | Description | Gene Ratio | Bg Ratio | pvalue | p.adjust | qvalue | Count |
| hsa0517120 | Cervix | CC | Coronavirus disease - COVID-19 | 111/1267 | 232/8465 | 1.82e-33 | 5.90e-31 | 3.49e-31 | 111 |
| hsa0541720 | Cervix | CC | Lipid and atherosclerosis | 65/1267 | 215/8465 | 6.47e-09 | 1.10e-07 | 6.52e-08 | 65 |
| hsa0516720 | Cervix | CC | Kaposi sarcoma-associated herpesvirus infection | 60/1267 | 194/8465 | 9.74e-09 | 1.58e-07 | 9.33e-08 | 60 |
| hsa0516920 | Cervix | CC | Epstein-Barr virus infection | 57/1267 | 202/8465 | 7.30e-07 | 7.39e-06 | 4.37e-06 | 57 |
| hsa0465718 | Cervix | CC | IL-17 signaling pathway | 31/1267 | 94/8465 | 8.71e-06 | 7.43e-05 | 4.39e-05 | 31 |
| hsa052226 | Cervix | CC | Small cell lung cancer | 29/1267 | 92/8465 | 4.38e-05 | 3.09e-04 | 1.83e-04 | 29 |
| hsa051657 | Cervix | CC | Human papillomavirus infection | 74/1267 | 331/8465 | 1.70e-04 | 1.02e-03 | 6.03e-04 | 74 |
| hsa0516414 | Cervix | CC | Influenza A | 43/1267 | 171/8465 | 3.03e-04 | 1.64e-03 | 9.68e-04 | 43 |
| hsa046686 | Cervix | CC | TNF signaling pathway | 28/1267 | 114/8465 | 4.60e-03 | 1.62e-02 | 9.59e-03 | 28 |
| hsa046213 | Cervix | CC | NOD-like receptor signaling pathway | 41/1267 | 186/8465 | 5.90e-03 | 1.95e-02 | 1.15e-02 | 41 |
| hsa05171110 | Cervix | CC | Coronavirus disease - COVID-19 | 111/1267 | 232/8465 | 1.82e-33 | 5.90e-31 | 3.49e-31 | 111 |
| hsa05417110 | Cervix | CC | Lipid and atherosclerosis | 65/1267 | 215/8465 | 6.47e-09 | 1.10e-07 | 6.52e-08 | 65 |
| hsa05167110 | Cervix | CC | Kaposi sarcoma-associated herpesvirus infection | 60/1267 | 194/8465 | 9.74e-09 | 1.58e-07 | 9.33e-08 | 60 |
| hsa05169110 | Cervix | CC | Epstein-Barr virus infection | 57/1267 | 202/8465 | 7.30e-07 | 7.39e-06 | 4.37e-06 | 57 |
| hsa0465719 | Cervix | CC | IL-17 signaling pathway | 31/1267 | 94/8465 | 8.71e-06 | 7.43e-05 | 4.39e-05 | 31 |
| hsa0522213 | Cervix | CC | Small cell lung cancer | 29/1267 | 92/8465 | 4.38e-05 | 3.09e-04 | 1.83e-04 | 29 |
| hsa0516512 | Cervix | CC | Human papillomavirus infection | 74/1267 | 331/8465 | 1.70e-04 | 1.02e-03 | 6.03e-04 | 74 |
| hsa0516415 | Cervix | CC | Influenza A | 43/1267 | 171/8465 | 3.03e-04 | 1.64e-03 | 9.68e-04 | 43 |
| hsa0466813 | Cervix | CC | TNF signaling pathway | 28/1267 | 114/8465 | 4.60e-03 | 1.62e-02 | 9.59e-03 | 28 |
| hsa0462112 | Cervix | CC | NOD-like receptor signaling pathway | 41/1267 | 186/8465 | 5.90e-03 | 1.95e-02 | 1.15e-02 | 41 |
| Hugo Symbol | Variant Class | Variant Classification | dbSNP RS | HGVSc | HGVSp | HGVSp Short | SWISSPROT | BIOTYPE | SIFT | PolyPhen | Tumor Sample Barcode | Tissue | Histology | Sex | Age | Stage | Therapy Types | Drugs | Outcome |
| TRAF3 | SNV | Missense_Mutation | novel | c.1552A>G | p.Ser518Gly | p.S518G | Q13114 | protein_coding | deleterious(0) | probably_damaging(1) | TCGA-AN-A0FK-01 | Breast | breast invasive carcinoma | Female | >=65 | III/IV | Unknown | Unknown | SD |
| TRAF3 | SNV | Missense_Mutation | novel | c.1591N>A | p.Ala531Thr | p.A531T | Q13114 | protein_coding | deleterious(0) | probably_damaging(1) | TCGA-AR-A24T-01 | Breast | breast invasive carcinoma | Female | <65 | III/IV | Chemotherapy | cytoxan | SD |
| TRAF3 | SNV | Missense_Mutation | | c.599N>C | p.Val200Ala | p.V200A | Q13114 | protein_coding | tolerated(0.6) | benign(0.079) | TCGA-C8-A26Y-01 | Breast | breast invasive carcinoma | Female | >=65 | I/II | Unknown | Unknown | SD |
| TRAF3 | SNV | Missense_Mutation | novel | c.1624N>T | p.Val542Phe | p.V542F | Q13114 | protein_coding | deleterious(0) | probably_damaging(0.966) | TCGA-E9-A54X-01 | Breast | breast invasive carcinoma | Female | >=65 | I/II | Unknown | Unknown | SD |
| TRAF3 | insertion | Frame_Shift_Ins | novel | c.1553_1554insATTCTGCACTGTC | p.Ser518ArgfsTer37 | p.S518Rfs*37 | Q13114 | protein_coding | | | TCGA-AN-A0FK-01 | Breast | breast invasive carcinoma | Female | >=65 | III/IV | Unknown | Unknown | SD |
| TRAF3 | insertion | Nonsense_Mutation | novel | c.194_195insTATTTGATCATGTTTTGTTCCCAACACATATTAAAGTTGG | p.Gln65HisfsTer3 | p.Q65Hfs*3 | Q13114 | protein_coding | | | TCGA-AR-A0TY-01 | Breast | breast invasive carcinoma | Female | <65 | I/II | Unspecific | Paclitaxel | PD |
| TRAF3 | insertion | Nonsense_Mutation | novel | c.1541_1542insTGGGCCCCGGGCGAGTGCTGGGGCGGGGTCCGTGGGATGAGGG | p.Asp515GlyfsTer13 | p.D515Gfs*13 | Q13114 | protein_coding | | | TCGA-AR-A0TY-01 | Breast | breast invasive carcinoma | Female | <65 | I/II | Unspecific | Paclitaxel | PD |
| TRAF3 | deletion | Frame_Shift_Del | | c.1520_1523delNNNN | p.His507ArgfsTer21 | p.H507Rfs*21 | Q13114 | protein_coding | | | TCGA-AR-A1AI-01 | Breast | breast invasive carcinoma | Female | <65 | I/II | Chemotherapy | cytoxan | PD |
| TRAF3 | SNV | Missense_Mutation | | c.26N>T | p.Ser9Phe | p.S9F | Q13114 | protein_coding | deleterious_low_confidence(0.02) | benign(0.037) | TCGA-C5-A1MK-01 | Cervix | cervical & endocervical cancer | Female | >=65 | III/IV | Chemotherapy | carboplatin | PD |
| TRAF3 | SNV | Missense_Mutation | novel | c.1234G>A | p.Ala412Thr | p.A412T | Q13114 | protein_coding | tolerated(0.06) | benign(0.183) | TCGA-C5-A7X5-01 | Cervix | cervical & endocervical cancer | Female | >=65 | I/II | Chemotherapy | carboplatin | PD |


