Schematic overview of the cellular and molecular mechanisms involved in the cancer progression, including the proposed cellular and molecular mechanisms in cancer cells trajectory. AT1: alveolar type 1 cells; AT2: alveolar type 2 cells; AAH: atypical adenomatous hyperplasia; AIS: adenocarcinoma in situ; MIA: minimally invasive adenocarcinoma; IA: invasive adenocarcinoma; EMT: epithelial-mesenchymal transition

Home

Download

Statistics

Help

Contact

Center for Computational Systems Medicine
leaf

Gene summary

leaf

Malignant transformation analysis

leaf

Malignant transformation related pathway analysis

leaf

Cell-cell communication analysis

leaf

Single-cell gene regulatory network inference analysis

leaf

Somatic mutation of malignant transformation related genes

leaf

Related drugs of malignant transformation related genes

Gene: THRAP3

Gene summary for THRAP3

check button Gene summary.

Gene informationSpeciesHuman
Gene symbol

THRAP3

Gene ID

9967

Gene namethyroid hormone receptor associated protein 3
Gene AliasBCLAF2
Cytomap1p34.3
Gene Typeprotein-coding
GO ID

GO:0000375

UniProtAcc

Q9Y2W1


Top

Malignant transformation analysis

check button Identification of the aberrant gene expression in precancerous and cancerous lesions by comparing the gene expression of stem-like cells in diseased tissues with normal stem cells
check button Malignant transformation involving gene list.
Entrez IDSymbolReplicatesSpeciesOrganTissueAdj P-valueLog2FCMalignancy
9967THRAP3HTA11_347_2000001011HumanColorectumAD1.63e-085.73e-01-0.1954
9967THRAP3HTA11_411_2000001011HumanColorectumSER5.63e-037.64e-01-0.2602
9967THRAP3HTA11_1391_2000001011HumanColorectumAD2.00e-025.13e-01-0.059
9967THRAP3HTA11_99999965062_69753HumanColorectumMSI-H1.56e-051.12e+000.3487
9967THRAP3HTA11_99999965104_69814HumanColorectumMSS4.84e-035.39e-010.281
9967THRAP3A002-C-010HumanColorectumFAP1.92e-03-1.85e-010.242
9967THRAP3A015-C-203HumanColorectumFAP1.45e-23-3.12e-01-0.1294
9967THRAP3A015-C-204HumanColorectumFAP5.84e-04-1.95e-01-0.0228
9967THRAP3A014-C-040HumanColorectumFAP6.58e-04-3.19e-01-0.1184
9967THRAP3A002-C-201HumanColorectumFAP9.63e-11-3.15e-010.0324
9967THRAP3A002-C-203HumanColorectumFAP5.96e-07-1.87e-010.2786
9967THRAP3A001-C-119HumanColorectumFAP2.12e-03-4.78e-02-0.1557
9967THRAP3A001-C-108HumanColorectumFAP8.24e-14-1.66e-01-0.0272
9967THRAP3A002-C-205HumanColorectumFAP5.34e-18-2.18e-01-0.1236
9967THRAP3A001-C-104HumanColorectumFAP9.88e-03-8.36e-020.0184
9967THRAP3A015-C-005HumanColorectumFAP1.39e-02-2.04e-01-0.0336
9967THRAP3A015-C-006HumanColorectumFAP1.40e-12-7.38e-03-0.0994
9967THRAP3A015-C-106HumanColorectumFAP4.26e-11-1.84e-01-0.0511
9967THRAP3A002-C-114HumanColorectumFAP4.02e-14-2.71e-01-0.1561
9967THRAP3A015-C-104HumanColorectumFAP3.21e-22-1.45e-01-0.1899
Page: 1 2 3 4 5 6 7 8 9 10 11 

check button Transcriptomic changes along malignancy continuum.
TissueExpression DynamicsAbbreviation
Colorectum (GSE201348)The image shows the transcriptomic changes along malignancy continuum.log2FC in expression of this searched gene in stem-like cells from each diseased tissue sample relative to stem-like cells in normal samples in each tissue plotted against the malignancy continuum. Samples are colored based on if they are from different disease stage.FAP: Familial adenomatous polyposis
CRC: Colorectal cancer
Colorectum (HTA11)The image shows the transcriptomic changes along malignancy continuum.log2FC in expression of this searched gene in stem-like cells from each diseased tissue sample relative to stem-like cells in normal samples in each tissue plotted against the malignancy continuum. Samples are colored based on if they are from different disease stage.AD: Adenomas
SER: Sessile serrated lesions
MSI-H: Microsatellite-high colorectal cancer
MSS: Microsatellite stable colorectal cancer
EsophagusThe image shows the transcriptomic changes along malignancy continuum.log2FC in expression of this searched gene in stem-like cells from each diseased tissue sample relative to stem-like cells in normal samples in each tissue plotted against the malignancy continuum. Samples are colored based on if they are from different disease stage.
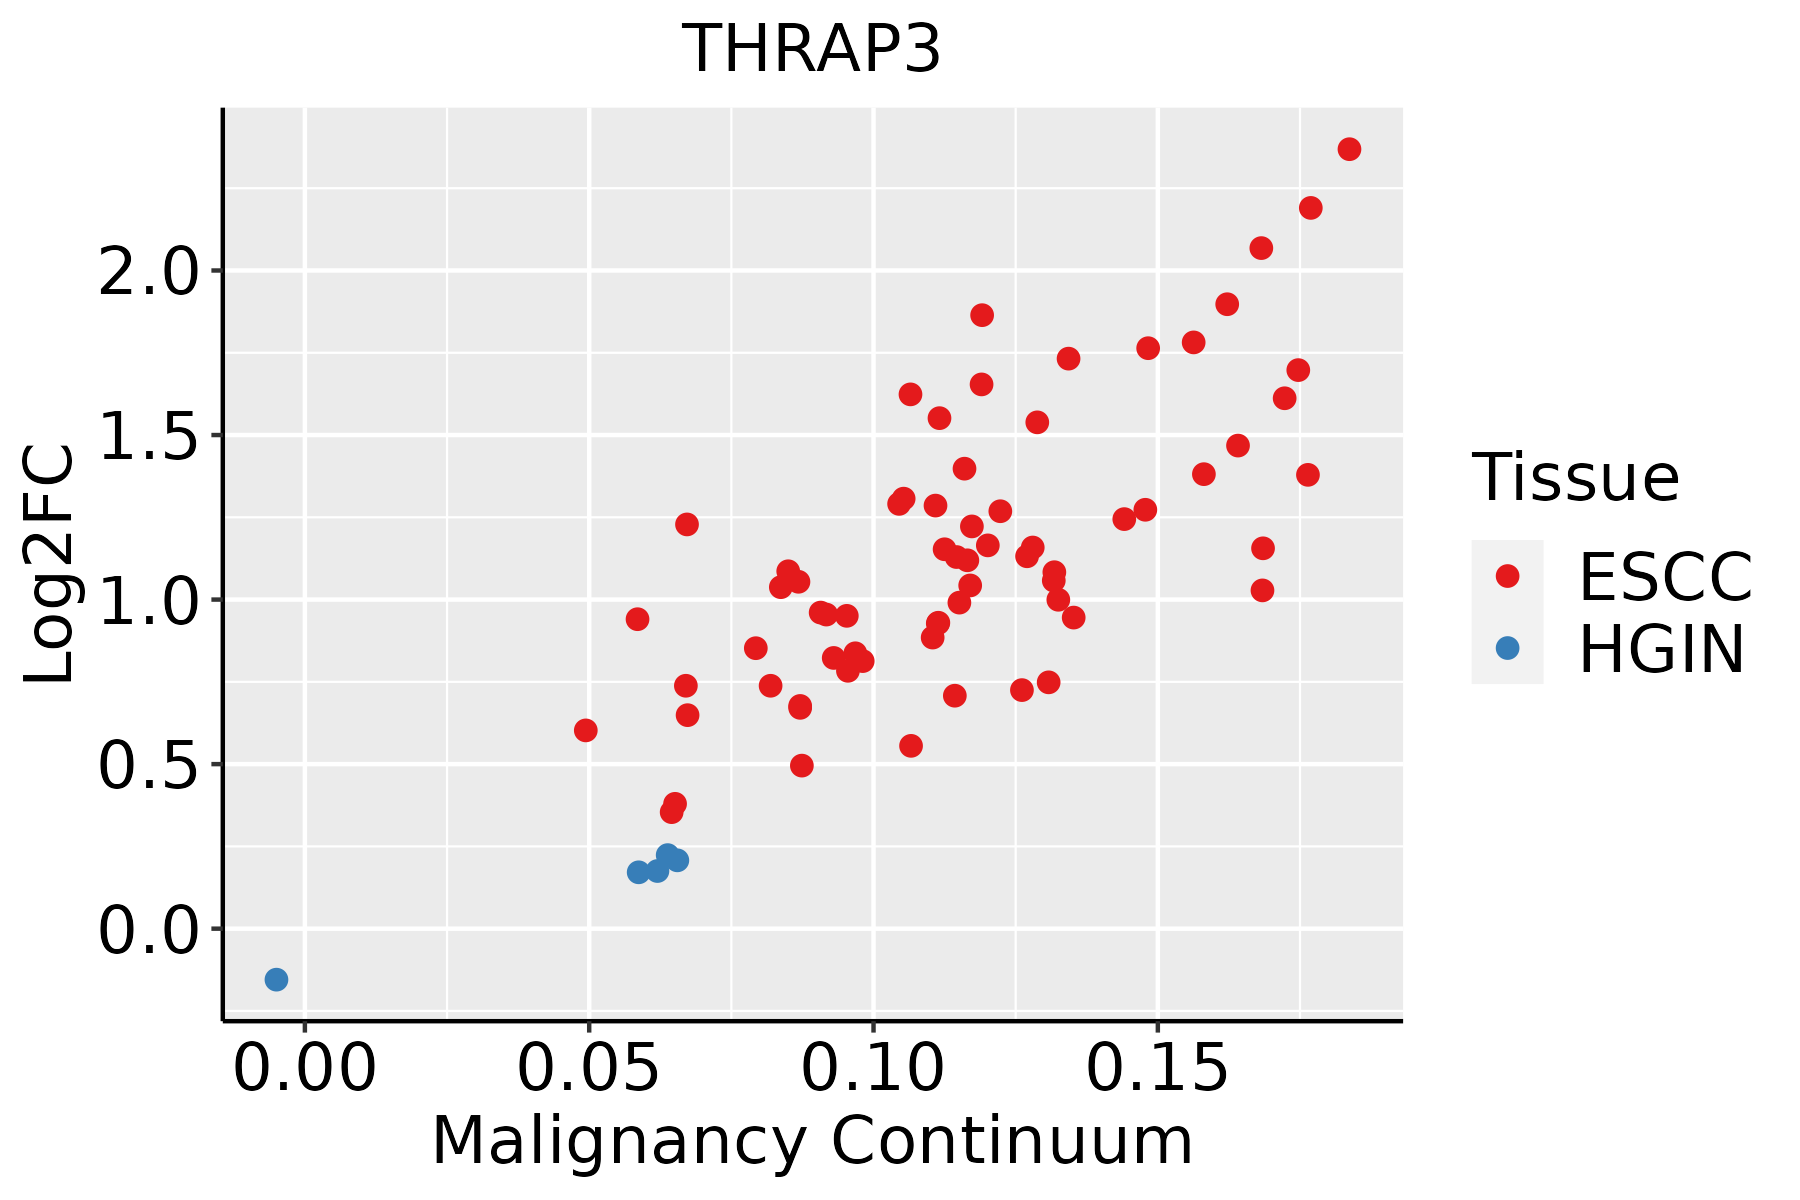
ESCC: Esophageal squamous cell carcinoma
HGIN: High-grade intraepithelial neoplasias
LGIN: Low-grade intraepithelial neoplasias
LiverThe image shows the transcriptomic changes along malignancy continuum.log2FC in expression of this searched gene in stem-like cells from each diseased tissue sample relative to stem-like cells in normal samples in each tissue plotted against the malignancy continuum. Samples are colored based on if they are from different disease stage.
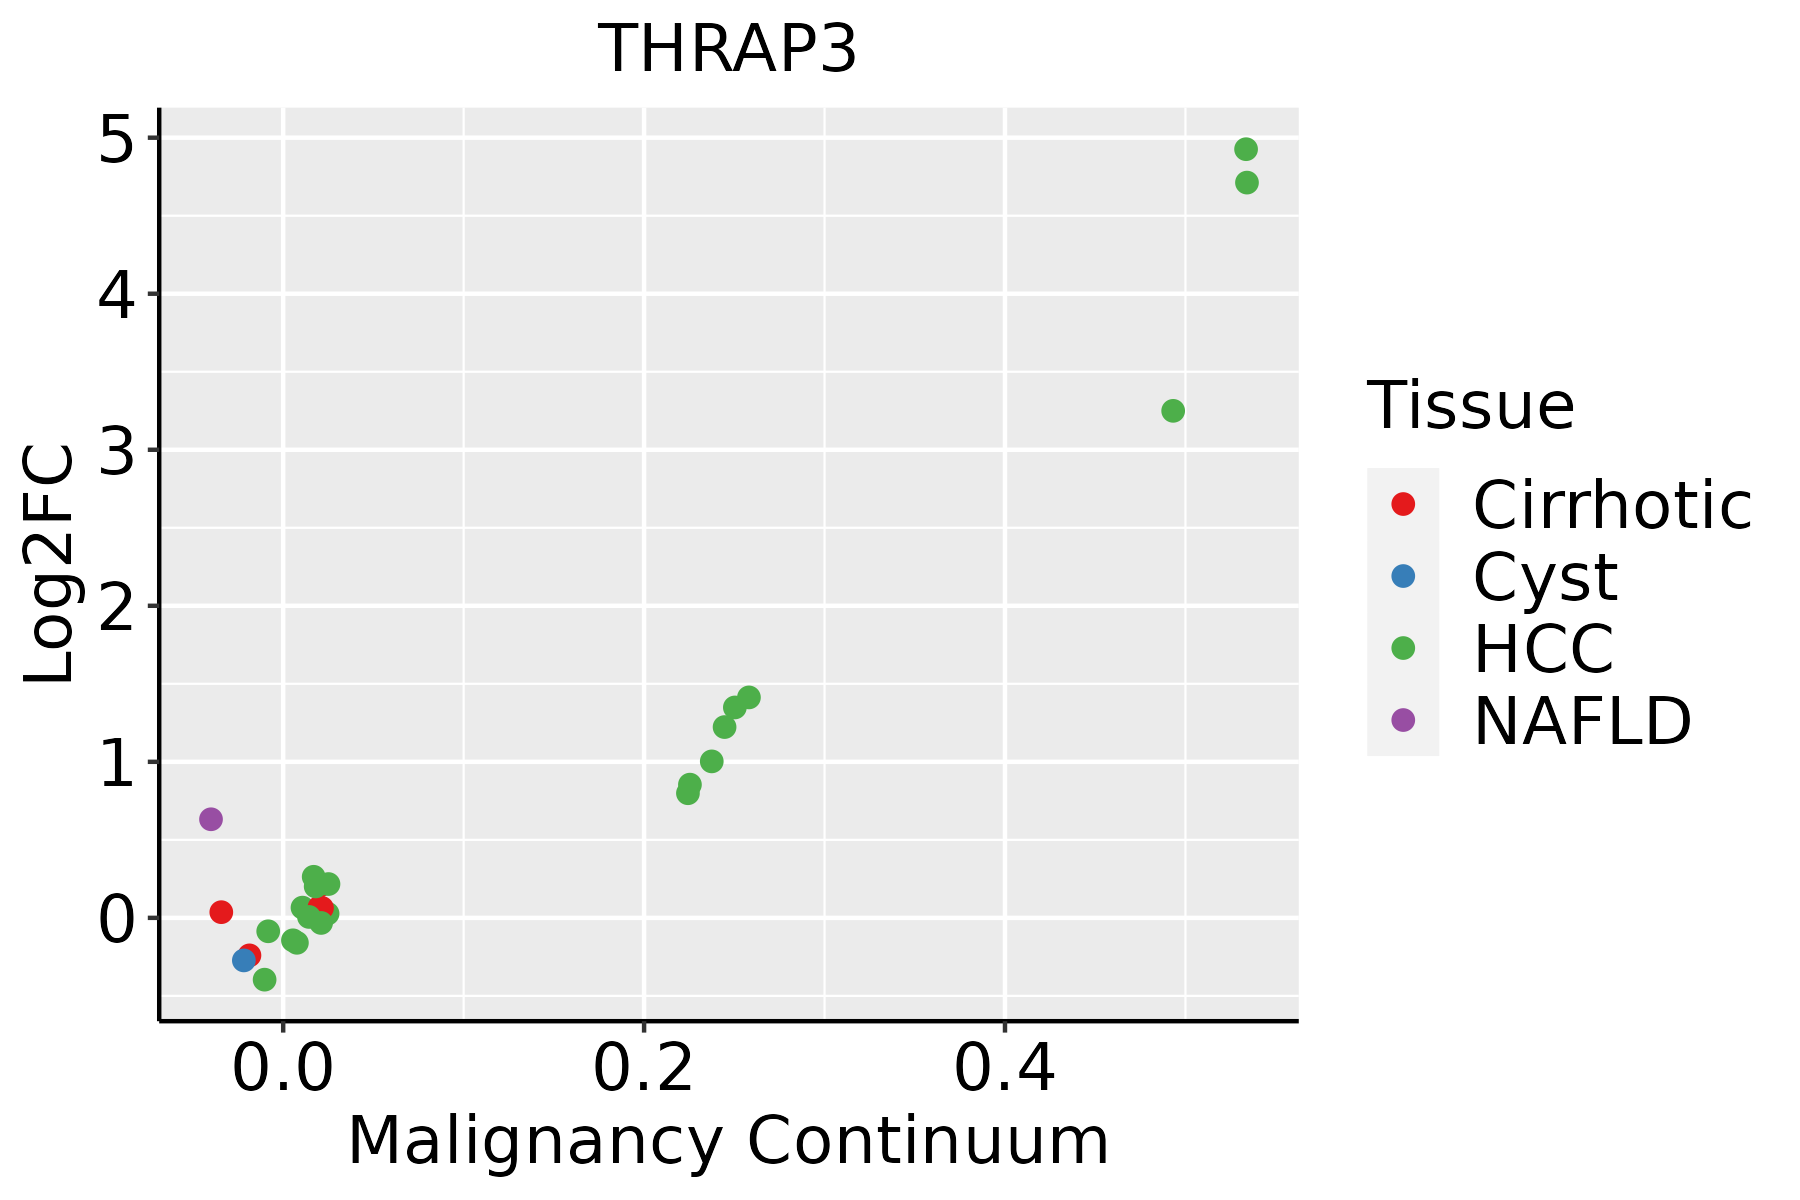
HCC: Hepatocellular carcinoma
NAFLD: Non-alcoholic fatty liver disease
LungThe image shows the transcriptomic changes along malignancy continuum.log2FC in expression of this searched gene in stem-like cells from each diseased tissue sample relative to stem-like cells in normal samples in each tissue plotted against the malignancy continuum. Samples are colored based on if they are from different disease stage.AAH: Atypical adenomatous hyperplasia
AIS: Adenocarcinoma in situ
IAC: Invasive lung adenocarcinoma
MIA: Minimally invasive adenocarcinoma
Oral CavityThe image shows the transcriptomic changes along malignancy continuum.log2FC in expression of this searched gene in stem-like cells from each diseased tissue sample relative to stem-like cells in normal samples in each tissue plotted against the malignancy continuum. Samples are colored based on if they are from different disease stage.EOLP: Erosive Oral lichen planus
LP: leukoplakia
NEOLP: Non-erosive oral lichen planus
OSCC: Oral squamous cell carcinoma
ProstateThe image shows the transcriptomic changes along malignancy continuum.log2FC in expression of this searched gene in stem-like cells from each diseased tissue sample relative to stem-like cells in normal samples in each tissue plotted against the malignancy continuum. Samples are colored based on if they are from different disease stage.BPH: Benign Prostatic Hyperplasia
SkinThe image shows the transcriptomic changes along malignancy continuum.log2FC in expression of this searched gene in stem-like cells from each diseased tissue sample relative to stem-like cells in normal samples in each tissue plotted against the malignancy continuum. Samples are colored based on if they are from different disease stage.AK: Actinic keratosis
cSCC: Cutaneous squamous cell carcinoma
SCCIS:squamous cell carcinoma in situ
ThyroidThe image shows the transcriptomic changes along malignancy continuum.log2FC in expression of this searched gene in stem-like cells from each diseased tissue sample relative to stem-like cells in normal samples in each tissue plotted against the malignancy continuum. Samples are colored based on if they are from different disease stage.
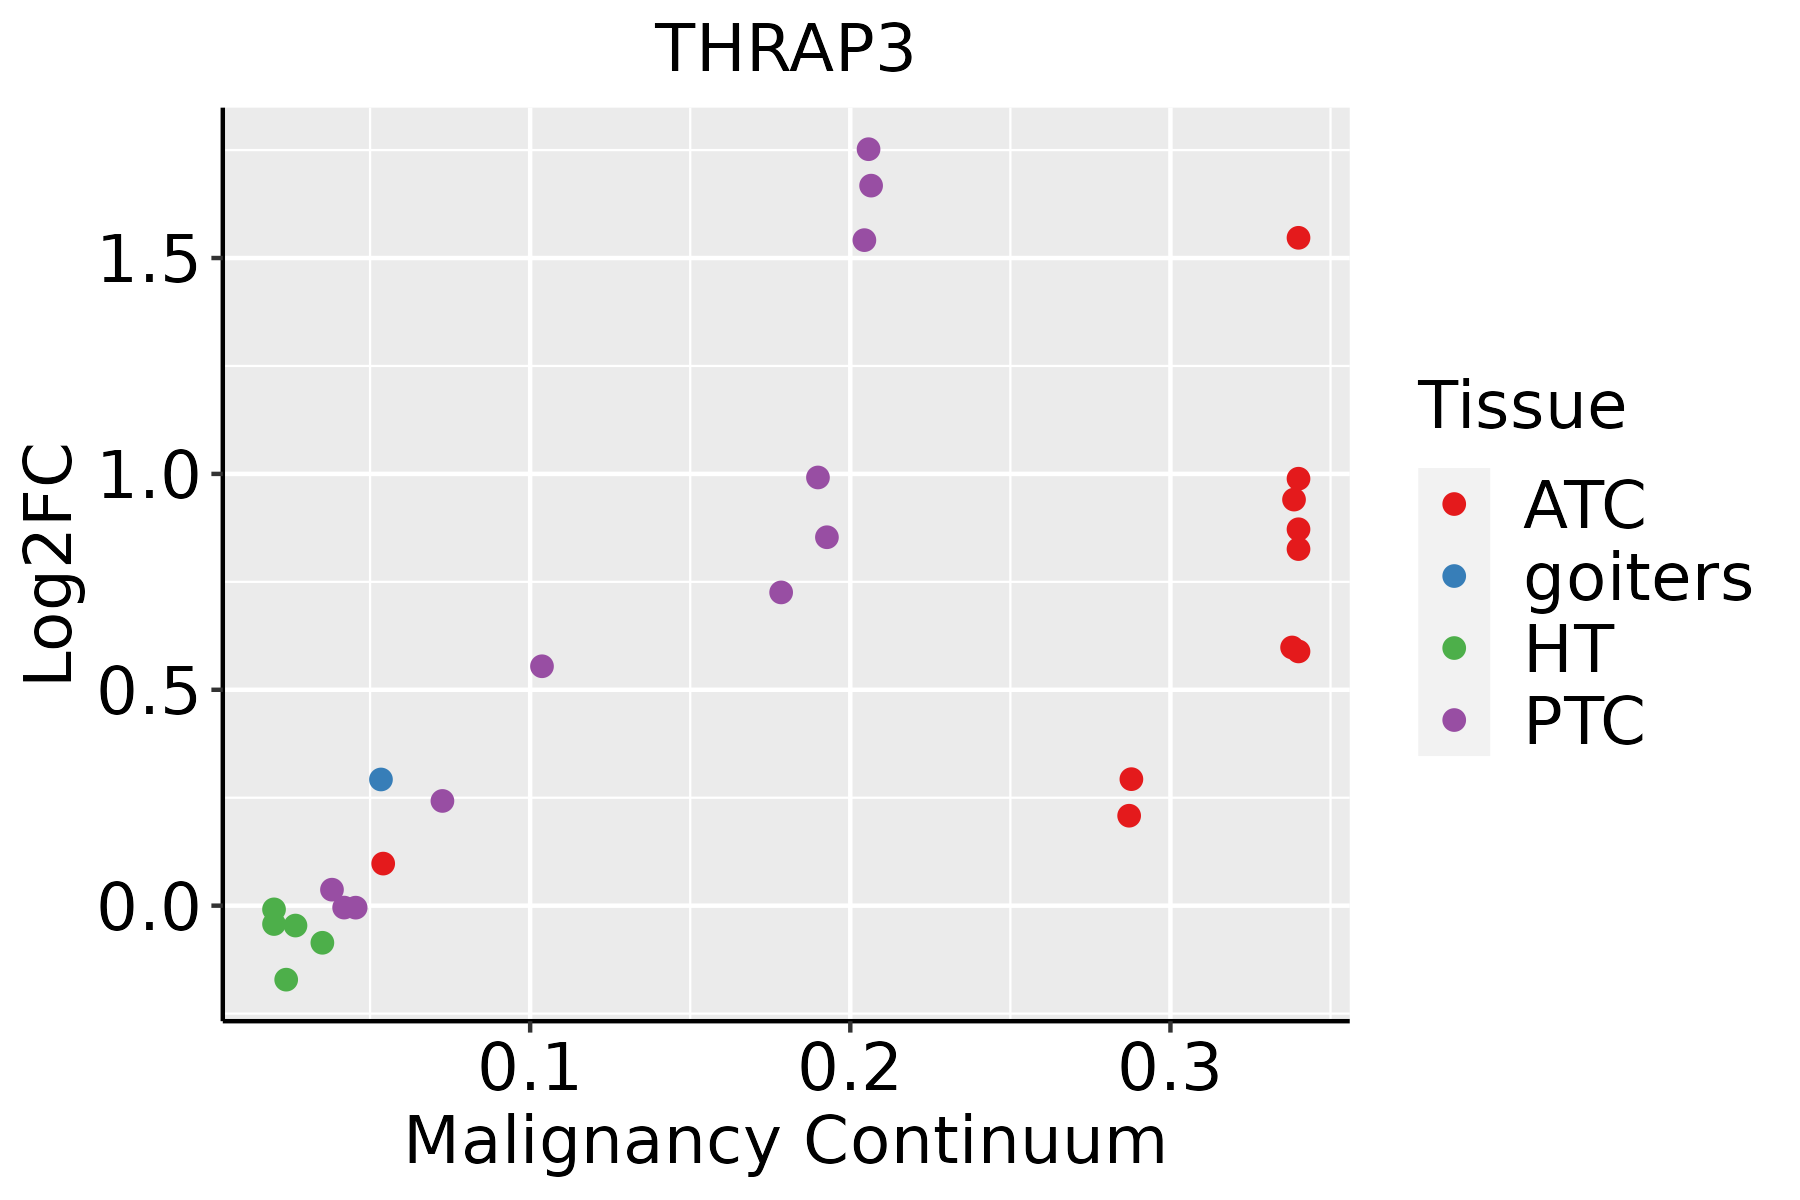
ATC: Anaplastic thyroid cancer
HT: Hashimoto's thyroiditis
PTC: Papillary thyroid cancer
∗log2FC in expression of this searched gene in stem-like cells from each diseased tissue sample relative to stem-like cells in normal samples in each tissue plotted against the malignancy continuum. Samples are colored based on if they are from different disease stage.

Top

Malignant transformation related pathway analysis

check buttonFind out the enriched GO biological processes and KEGG pathways involved in transition from healthy to precancer to cancer
check button Figure of enriched GO biological processes.
TissueDisease StageEnriched GO biological Processes
ColorectumADGO analysis - Figure of enriched GO biological processes: Top 15 enriched GO BP terms are showed in the bar plot of each disease state in each tissue. Each row represents a significant GO biological process which is colored according to the -log10(p.adjust).
ColorectumSERGO analysis - Figure of enriched GO biological processes: Top 15 enriched GO BP terms are showed in the bar plot of each disease state in each tissue. Each row represents a significant GO biological process which is colored according to the -log10(p.adjust).
ColorectumMSSGO analysis - Figure of enriched GO biological processes: Top 15 enriched GO BP terms are showed in the bar plot of each disease state in each tissue. Each row represents a significant GO biological process which is colored according to the -log10(p.adjust).
ColorectumMSI-HGO analysis - Figure of enriched GO biological processes: Top 15 enriched GO BP terms are showed in the bar plot of each disease state in each tissue. Each row represents a significant GO biological process which is colored according to the -log10(p.adjust).
ColorectumFAPGO analysis - Figure of enriched GO biological processes: Top 15 enriched GO BP terms are showed in the bar plot of each disease state in each tissue. Each row represents a significant GO biological process which is colored according to the -log10(p.adjust).
∗Top 15 enriched GO BP terms are showed in the bar plot of each disease state in each tissue. Each row represents a significant GO biological process which is colored according to the -log10(p.adjust).
Page: 1 2 3 4 5 6 7 8 9 

check button Enriched GO biological processes.
GO IDTissueDisease StageDescriptionGene RatioBg Ratiopvaluep.adjustCount
GO:000037513LungAISRNA splicing, via transesterification reactions49/1849324/187231.69e-031.93e-0249
GO:003312013LungAISpositive regulation of RNA splicing10/184937/187232.48e-032.55e-0210
GO:190331213LungAISnegative regulation of mRNA metabolic process18/184992/187233.54e-033.34e-0218
GO:004348433LungMIACregulation of RNA splicing32/967148/187233.60e-129.23e-0932
GO:190331132LungMIACregulation of mRNA metabolic process45/967288/187232.75e-114.70e-0845
GO:004802432LungMIACregulation of mRNA splicing, via spliceosome24/967101/187232.28e-102.92e-0724
GO:005068432LungMIACregulation of mRNA processing26/967137/187237.19e-094.94e-0626
GO:000038122LungMIACregulation of alternative mRNA splicing, via spliceosome14/96760/187231.64e-062.10e-0414
GO:004348831LungMIACregulation of mRNA stability23/967158/187236.62e-066.29e-0423
GO:004348731LungMIACregulation of RNA stability24/967170/187237.20e-066.53e-0424
GO:006101331LungMIACregulation of mRNA catabolic process23/967166/187231.52e-051.07e-0323
GO:000838023LungMIACRNA splicing44/967434/187231.56e-051.07e-0344
GO:000640231LungMIACmRNA catabolic process28/967232/187232.65e-051.66e-0328
GO:000038022LungMIACalternative mRNA splicing, via spliceosome14/96777/187233.50e-051.97e-0314
GO:190331223LungMIACnegative regulation of mRNA metabolic process15/96792/187236.98e-053.38e-0315
GO:190331322LungMIACpositive regulation of mRNA metabolic process17/967118/187231.17e-044.92e-0317
GO:000037723LungMIACRNA splicing, via transesterification reactions with bulged adenosine as nucleophile33/967320/187231.27e-045.13e-0333
GO:000039823LungMIACmRNA splicing, via spliceosome33/967320/187231.27e-045.13e-0333
GO:000037523LungMIACRNA splicing, via transesterification reactions33/967324/187231.61e-046.19e-0333
GO:003133033LungMIACnegative regulation of cellular catabolic process28/967262/187232.23e-047.67e-0328
Page: 1 2 3 4 5 6 7 8 9 10 11 12 13 14 15 16 17 18 19 20 21 22 23 24 25 26 27 28 29 30 31 32 33 34 35 36 37 38 

check button Enriched KEGG pathways.
Pathway IDTissueDisease StageDescriptionGene RatioBg Ratiopvaluep.adjustqvalueCount
Page: 1 

Top

Cell-cell communication analysis

check buttonIdentification of potential cell-cell interactions between two cell types and their ligand-receptor pairs for different disease states
LigandReceptorLRpairPathwayTissueDisease Stage
Page: 1 

Top

Single-cell gene regulatory network inference analysis

check buttonFind out the significant the regulons (TFs) and the target genes of each regulon across cell types for different disease states
TFCell TypeTissueDisease StageTarget GeneRSSRegulon Activity
∗The dot plots of a searched regulon are shown for all cell subpopulations in each disease state of each tissue based on the regulon specific score inferred using pySCENIC and by calculating the average expression.
Page: 1 

Top

Somatic mutation of malignant transformation related genes

check buttonAnnotation of somatic variants for genes involved in malignant transformation
Hugo SymbolVariant ClassVariant ClassificationdbSNP RSHGVScHGVSpHGVSp ShortSWISSPROTBIOTYPESIFTPolyPhenTumor Sample BarcodeTissueHistologySexAgeStageTherapy TypesDrugsOutcome
THRAP3SNVMissense_Mutationnovelc.953N>Ap.Gly318Aspp.G318DQ9Y2W1protein_codingtolerated(0.22)benign(0.215)TCGA-A7-A6VX-01Breastbreast invasive carcinomaFemale>=65I/IIChemotherapydocetaxelCR
THRAP3SNVMissense_Mutationc.2428N>Ap.Asp810Asnp.D810NQ9Y2W1protein_codingtolerated(0.69)possibly_damaging(0.873)TCGA-A8-A07B-01Breastbreast invasive carcinomaFemale>=65I/IIUnknownUnknownSD
THRAP3SNVMissense_Mutationc.869N>Ap.Gly290Aspp.G290DQ9Y2W1protein_codingtolerated(0.07)possibly_damaging(0.726)TCGA-BH-A0HF-01Breastbreast invasive carcinomaFemale>=65I/IIHormone TherapyarimidexSD
THRAP3SNVMissense_Mutationc.880N>Gp.Gln294Glup.Q294EQ9Y2W1protein_codingtolerated(0.12)possibly_damaging(0.79)TCGA-BH-A1EV-01Breastbreast invasive carcinomaFemale<65III/IVUnknownUnknownPD
THRAP3SNVMissense_Mutationc.144N>Cp.Arg48Serp.R48SQ9Y2W1protein_codingdeleterious_low_confidence(0)probably_damaging(0.994)TCGA-BH-A1FU-01Breastbreast invasive carcinomaFemale<65I/IIUnknownUnknownPD
THRAP3SNVMissense_Mutationrs749716914c.2080G>Ap.Asp694Asnp.D694NQ9Y2W1protein_codingdeleterious(0.02)possibly_damaging(0.709)TCGA-C8-A131-01Breastbreast invasive carcinomaFemale>=65III/IVChemotherapy5-fluorouracilCR
THRAP3SNVMissense_Mutationc.2081A>Tp.Asp694Valp.D694VQ9Y2W1protein_codingdeleterious(0)possibly_damaging(0.848)TCGA-C8-A131-01Breastbreast invasive carcinomaFemale>=65III/IVChemotherapy5-fluorouracilCR
THRAP3SNVMissense_Mutationc.302N>Cp.Arg101Prop.R101PQ9Y2W1protein_codingdeleterious(0.01)probably_damaging(0.998)TCGA-D8-A1XK-01Breastbreast invasive carcinomaFemale<65I/IIChemotherapydoxorubicine+cyclophosphamideSD
THRAP3SNVMissense_Mutationc.1403N>Tp.Ser468Leup.S468LQ9Y2W1protein_codingtolerated(0.67)benign(0.15)TCGA-E2-A9RU-01Breastbreast invasive carcinomaFemale>=65III/IVHormone TherapyarimidexSD
THRAP3SNVMissense_Mutationc.320A>Cp.Tyr107Serp.Y107SQ9Y2W1protein_codingdeleterious(0.01)probably_damaging(0.918)TCGA-E9-A1N8-01Breastbreast invasive carcinomaFemale<65I/IIChemotherapydoxorubicinSD
Page: 1 2 3 4 5 6 7 8 9 10 11 12 

Top

Related drugs of malignant transformation related genes

check buttonIdentification of chemicals and drugs interact with genes involved in malignant transfromation
(DGIdb 4.0)
Entrez IDSymbolCategoryInteraction TypesDrug Claim NameDrug NamePMIDs
Page: 1