| Tissue | Expression Dynamics | Abbreviation |
| Colorectum (GSE201348) |  | FAP: Familial adenomatous polyposis |
| CRC: Colorectal cancer |
| Colorectum (HTA11) |  | AD: Adenomas |
| SER: Sessile serrated lesions |
| MSI-H: Microsatellite-high colorectal cancer |
| MSS: Microsatellite stable colorectal cancer |
| Esophagus | 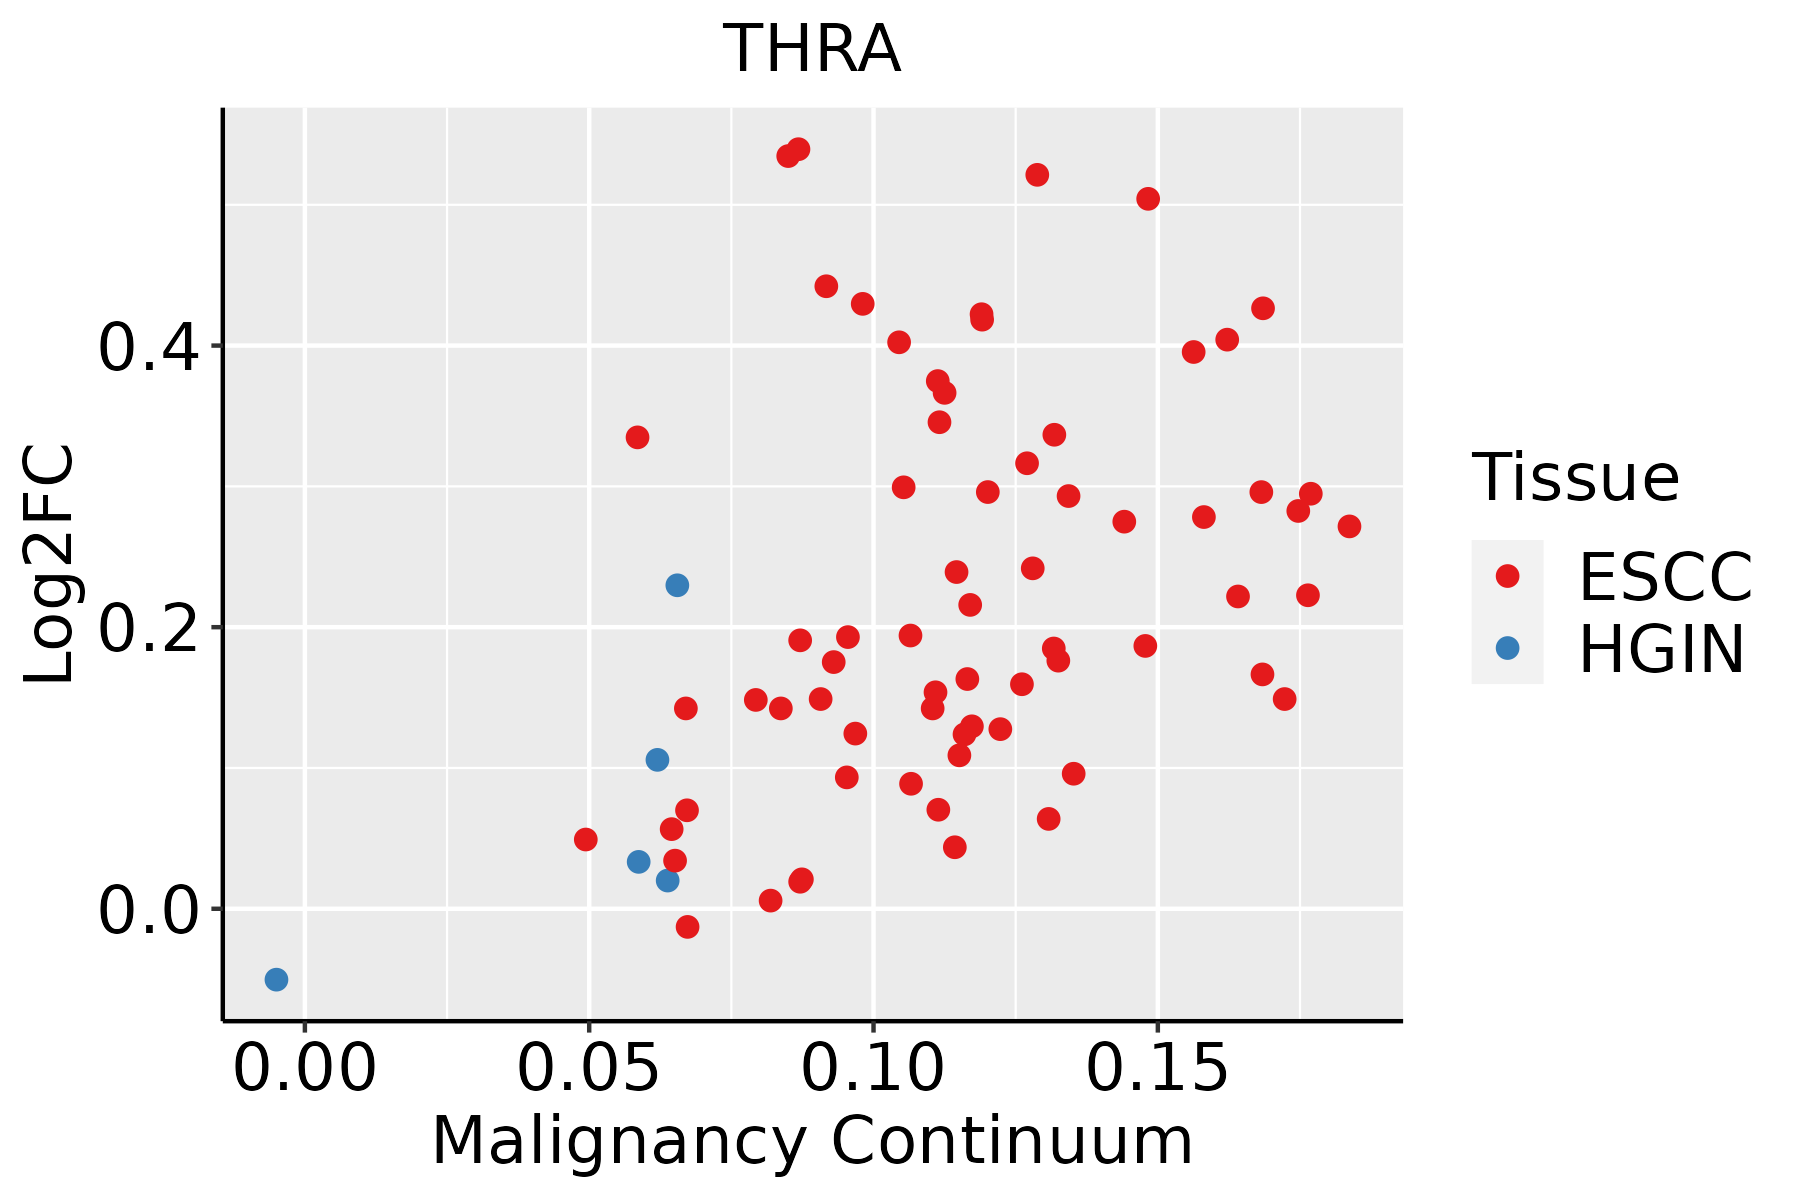 | ESCC: Esophageal squamous cell carcinoma |
| HGIN: High-grade intraepithelial neoplasias |
| LGIN: Low-grade intraepithelial neoplasias |
| Liver | 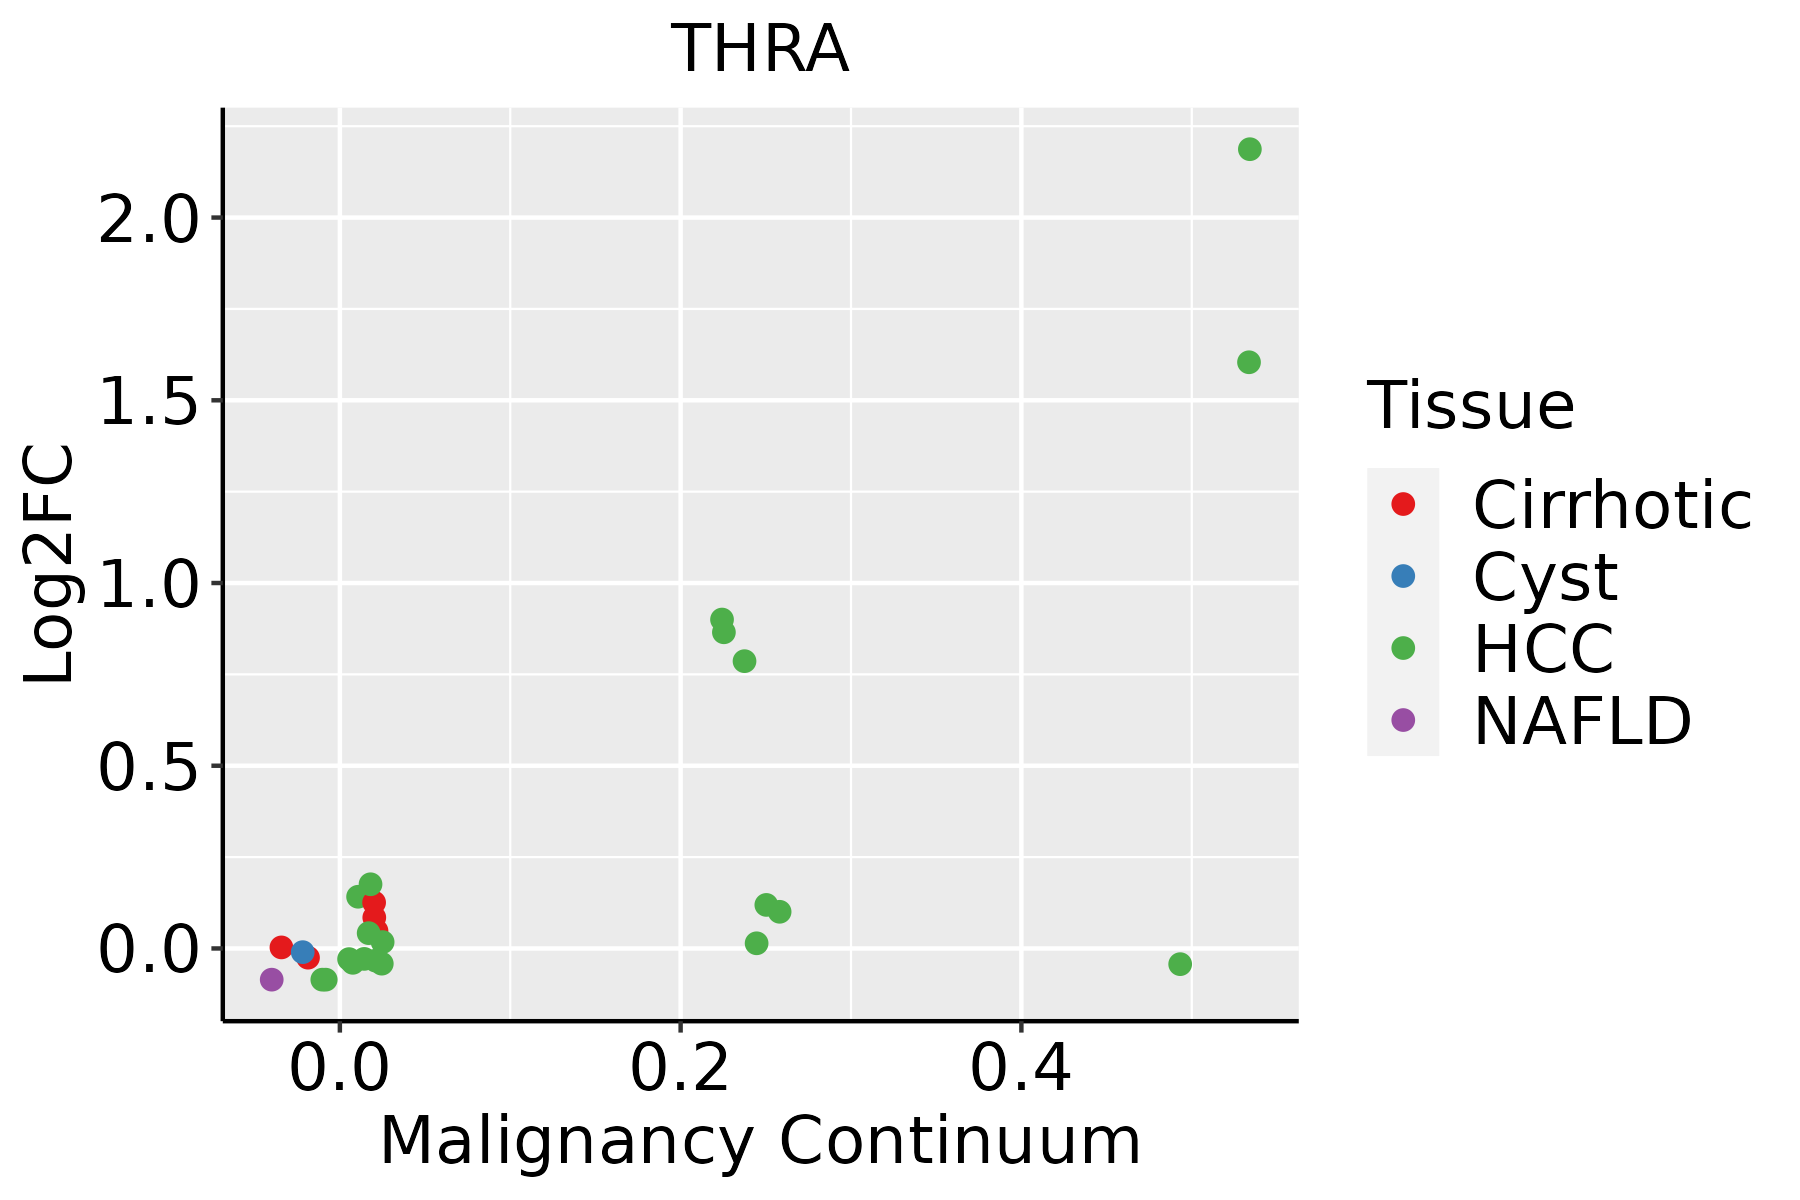 | HCC: Hepatocellular carcinoma |
| NAFLD: Non-alcoholic fatty liver disease |
| GO ID | Tissue | Disease Stage | Description | Gene Ratio | Bg Ratio | pvalue | p.adjust | Count |
| GO:190331121 | Liver | HCC | regulation of mRNA metabolic process | 205/7958 | 288/18723 | 3.38e-23 | 6.90e-21 | 205 |
| GO:000640221 | Liver | HCC | mRNA catabolic process | 169/7958 | 232/18723 | 4.50e-21 | 6.96e-19 | 169 |
| GO:004348422 | Liver | HCC | regulation of RNA splicing | 113/7958 | 148/18723 | 4.32e-17 | 4.15e-15 | 113 |
| GO:005068421 | Liver | HCC | regulation of mRNA processing | 106/7958 | 137/18723 | 7.64e-17 | 7.12e-15 | 106 |
| GO:004325422 | Liver | HCC | regulation of protein-containing complex assembly | 264/7958 | 428/18723 | 5.47e-16 | 4.39e-14 | 264 |
| GO:003052222 | Liver | HCC | intracellular receptor signaling pathway | 171/7958 | 265/18723 | 3.00e-13 | 1.61e-11 | 171 |
| GO:004348721 | Liver | HCC | regulation of RNA stability | 119/7958 | 170/18723 | 3.20e-13 | 1.71e-11 | 119 |
| GO:000095621 | Liver | HCC | nuclear-transcribed mRNA catabolic process | 84/7958 | 112/18723 | 2.54e-12 | 1.18e-10 | 84 |
| GO:004348821 | Liver | HCC | regulation of mRNA stability | 110/7958 | 158/18723 | 4.36e-12 | 1.93e-10 | 110 |
| GO:006101321 | Liver | HCC | regulation of mRNA catabolic process | 114/7958 | 166/18723 | 7.38e-12 | 3.12e-10 | 114 |
| GO:000989522 | Liver | HCC | negative regulation of catabolic process | 196/7958 | 320/18723 | 7.98e-12 | 3.35e-10 | 196 |
| GO:003133022 | Liver | HCC | negative regulation of cellular catabolic process | 164/7958 | 262/18723 | 3.52e-11 | 1.35e-09 | 164 |
| GO:190331321 | Liver | HCC | positive regulation of mRNA metabolic process | 85/7958 | 118/18723 | 7.10e-11 | 2.56e-09 | 85 |
| GO:004802422 | Liver | HCC | regulation of mRNA splicing, via spliceosome | 74/7958 | 101/18723 | 3.29e-10 | 1.10e-08 | 74 |
| GO:004873222 | Liver | HCC | gland development | 242/7958 | 436/18723 | 2.26e-08 | 5.28e-07 | 242 |
| GO:003133312 | Liver | HCC | negative regulation of protein-containing complex assembly | 91/7958 | 141/18723 | 1.01e-07 | 1.98e-06 | 91 |
| GO:190331222 | Liver | HCC | negative regulation of mRNA metabolic process | 63/7958 | 92/18723 | 4.14e-07 | 6.97e-06 | 63 |
| GO:00192162 | Liver | HCC | regulation of lipid metabolic process | 181/7958 | 331/18723 | 4.58e-06 | 5.79e-05 | 181 |
| GO:001604221 | Liver | HCC | lipid catabolic process | 175/7958 | 320/18723 | 6.50e-06 | 7.88e-05 | 175 |
| GO:000038021 | Liver | HCC | alternative mRNA splicing, via spliceosome | 52/7958 | 77/18723 | 7.87e-06 | 9.27e-05 | 52 |
| Pathway ID | Tissue | Disease Stage | Description | Gene Ratio | Bg Ratio | pvalue | p.adjust | qvalue | Count |
| hsa04919 | Colorectum | AD | Thyroid hormone signaling pathway | 51/2092 | 121/8465 | 1.71e-05 | 1.73e-04 | 1.10e-04 | 51 |
| hsa049191 | Colorectum | AD | Thyroid hormone signaling pathway | 51/2092 | 121/8465 | 1.71e-05 | 1.73e-04 | 1.10e-04 | 51 |
| hsa049192 | Colorectum | SER | Thyroid hormone signaling pathway | 40/1580 | 121/8465 | 1.02e-04 | 1.06e-03 | 7.67e-04 | 40 |
| hsa049193 | Colorectum | SER | Thyroid hormone signaling pathway | 40/1580 | 121/8465 | 1.02e-04 | 1.06e-03 | 7.67e-04 | 40 |
| hsa049194 | Colorectum | MSS | Thyroid hormone signaling pathway | 46/1875 | 121/8465 | 5.04e-05 | 4.97e-04 | 3.05e-04 | 46 |
| hsa049195 | Colorectum | MSS | Thyroid hormone signaling pathway | 46/1875 | 121/8465 | 5.04e-05 | 4.97e-04 | 3.05e-04 | 46 |
| hsa0491928 | Esophagus | ESCC | Thyroid hormone signaling pathway | 78/4205 | 121/8465 | 6.79e-04 | 2.23e-03 | 1.14e-03 | 78 |
| hsa04919113 | Esophagus | ESCC | Thyroid hormone signaling pathway | 78/4205 | 121/8465 | 6.79e-04 | 2.23e-03 | 1.14e-03 | 78 |
| hsa0491912 | Liver | HCC | Thyroid hormone signaling pathway | 75/4020 | 121/8465 | 8.76e-04 | 3.38e-03 | 1.88e-03 | 75 |
| hsa0491913 | Liver | HCC | Thyroid hormone signaling pathway | 75/4020 | 121/8465 | 8.76e-04 | 3.38e-03 | 1.88e-03 | 75 |
| TF | Cell Type | Tissue | Disease Stage | Target Gene | RSS | Regulon Activity |
| THRA | CD8TEXINT | Colorectum | ADJ | SEMA3C,AGPAT4,NCEH1, etc. | 1.08e-01 |  |
| THRA | INCAF | Colorectum | CRC | RABL2B,NDUFAF6,PIGN, etc. | 4.72e-01 |  |
| THRA | ICAF | Colorectum | MSS | RABL2B,NDUFAF6,PIGN, etc. | 5.18e-01 |  |
| THRA | M1MAC | Endometrium | Healthy | USF1,ZNF483,AL356234.2, etc. | 4.31e-01 |  |
| THRA | SMC | Endometrium | ADJ | GUCY1A3,BRSK2,AC097724.3, etc. | 2.73e-01 |  |
| THRA | SMC | Endometrium | AEH | GUCY1A3,BRSK2,AC097724.3, etc. | 1.94e-01 |  |
| THRA | PERI | Liver | Cirrhotic | BAMBI,C2orf40,C15orf39, etc. | 1.40e-01 |  |
| THRA | SMC | Liver | Cirrhotic | BAMBI,C2orf40,C15orf39, etc. | 1.58e-01 | |
| THRA | SMC | Liver | HCC | BAMBI,C2orf40,C15orf39, etc. | 3.49e-01 |  |
| THRA | CD8TEREX | Lung | MIAC | PLPP3,ZNF683,TRAF3IP2-AS1, etc. | 4.57e-02 |  |
| Hugo Symbol | Variant Class | Variant Classification | dbSNP RS | HGVSc | HGVSp | HGVSp Short | SWISSPROT | BIOTYPE | SIFT | PolyPhen | Tumor Sample Barcode | Tissue | Histology | Sex | Age | Stage | Therapy Types | Drugs | Outcome |
| THRA | SNV | Missense_Mutation | novel | c.1007N>G | p.Asp336Gly | p.D336G | P10827 | protein_coding | tolerated(0.13) | benign(0.133) | TCGA-A8-A07U-01 | Breast | breast invasive carcinoma | Female | >=65 | III/IV | Chemotherapy | 5-fluorouracil | SD |
| THRA | SNV | Missense_Mutation | novel | c.612N>T | p.Met204Ile | p.M204I | P10827 | protein_coding | tolerated(0.23) | benign(0.155) | TCGA-AC-A6IW-01 | Breast | breast invasive carcinoma | Female | >=65 | I/II | Unknown | Unknown | SD |
| THRA | SNV | Missense_Mutation | | c.32N>T | p.Gly11Val | p.G11V | P10827 | protein_coding | deleterious_low_confidence(0.01) | benign(0.08) | TCGA-E2-A14V-01 | Breast | breast invasive carcinoma | Female | <65 | I/II | Chemotherapy | cyclophosphamide | SD |
| THRA | insertion | In_Frame_Ins | novel | c.878_879insAAGGTCTGGCTGCTCTAAGAAATCAGC | p.Gly293_Val294insArgSerGlyCysSerLysLysSerAla | p.G293_V294insRSGCSKKSA | P10827 | protein_coding | | | TCGA-AN-A04A-01 | Breast | breast invasive carcinoma | Female | <65 | III/IV | Unknown | Unknown | SD |
| THRA | SNV | Missense_Mutation | | c.1175N>T | p.Ser392Leu | p.S392L | P10827 | protein_coding | deleterious_low_confidence(0) | benign(0.039) | TCGA-EK-A2H0-01 | Cervix | cervical & endocervical cancer | Female | <65 | I/II | Chemotherapy | cisplatin | CR |
| THRA | SNV | Missense_Mutation | | c.1175N>T | p.Ser392Leu | p.S392L | P10827 | protein_coding | deleterious_low_confidence(0) | benign(0.039) | TCGA-ZJ-A8QQ-01 | Cervix | cervical & endocervical cancer | Female | <65 | I/II | Chemotherapy | cisplatin | SD |
| THRA | SNV | Missense_Mutation | | c.871G>A | p.Gly291Ser | p.G291S | P10827 | protein_coding | deleterious(0.04) | probably_damaging(0.964) | TCGA-AA-3821-01 | Colorectum | colon adenocarcinoma | Female | >=65 | I/II | Unknown | Unknown | SD |
| THRA | SNV | Missense_Mutation | | c.854A>G | p.Glu285Gly | p.E285G | P10827 | protein_coding | tolerated(0.23) | benign(0.012) | TCGA-AA-A010-01 | Colorectum | colon adenocarcinoma | Female | <65 | I/II | Chemotherapy | folinic | CR |
| THRA | SNV | Missense_Mutation | | c.473N>A | p.Pro158Gln | p.P158Q | P10827 | protein_coding | deleterious(0.02) | benign(0.077) | TCGA-DM-A1DA-01 | Colorectum | colon adenocarcinoma | Female | >=65 | III/IV | Unknown | Unknown | SD |
| THRA | SNV | Missense_Mutation | | c.709N>T | p.Pro237Ser | p.P237S | P10827 | protein_coding | deleterious(0.01) | possibly_damaging(0.85) | TCGA-WS-AB45-01 | Colorectum | colon adenocarcinoma | Female | <65 | I/II | Unknown | Unknown | SD |
| Entrez ID | Symbol | Category | Interaction Types | Drug Claim Name | Drug Name | PMIDs |
| 7067 | THRA | DRUGGABLE GENOME, NUCLEAR HORMONE RECEPTOR | | LEVOTHYROXINE | LEVOTHYROXINE | |
| 7067 | THRA | DRUGGABLE GENOME, NUCLEAR HORMONE RECEPTOR | agonist | 135651405 | TIRATRICOL | |
| 7067 | THRA | DRUGGABLE GENOME, NUCLEAR HORMONE RECEPTOR | agonist | 135651574 | LEVOTHYROXINE SODIUM | |
| 7067 | THRA | DRUGGABLE GENOME, NUCLEAR HORMONE RECEPTOR | | Dextrothyroxine Sodium | | |
| 7067 | THRA | DRUGGABLE GENOME, NUCLEAR HORMONE RECEPTOR | agonist | 178103533 | DEXTROTHYROXINE | |
| 7067 | THRA | DRUGGABLE GENOME, NUCLEAR HORMONE RECEPTOR | agonist | 135651573 | LIOTHYRONINE SODIUM | |
| 7067 | THRA | DRUGGABLE GENOME, NUCLEAR HORMONE RECEPTOR | agonist | CHEMBL1544 | LIOTHYRONINE | |
| 7067 | THRA | DRUGGABLE GENOME, NUCLEAR HORMONE RECEPTOR | | tiratricol | TIRATRICOL | |
| 7067 | THRA | DRUGGABLE GENOME, NUCLEAR HORMONE RECEPTOR | | TRIIODOTHYRONINE (T3) | | |
| 7067 | THRA | DRUGGABLE GENOME, NUCLEAR HORMONE RECEPTOR | antagonist | 135650713 | | |


