
|
|||||
|
 | |
| |
| |
| |
| |
| |
|
Gene: SP3 |
Gene summary for SP3 |
| Gene information | Species | Human | Gene symbol | SP3 | Gene ID | 6670 |
| Gene name | Sp3 transcription factor | |
| Gene Alias | SPR2 | |
| Cytomap | 2q31.1 | |
| Gene Type | protein-coding | GO ID | GO:0000003 | UniProtAcc | Q02447 |
Top |
Malignant transformation analysis |
| Identification of the aberrant gene expression in precancerous and cancerous lesions by comparing the gene expression of stem-like cells in diseased tissues with normal stem cells |
| Entrez ID | Symbol | Replicates | Species | Organ | Tissue | Adj P-value | Log2FC | Malignancy |
| 6670 | SP3 | CA_HPV_1 | Human | Cervix | CC | 2.09e-03 | -1.60e-02 | 0.0264 |
| 6670 | SP3 | CCI_2 | Human | Cervix | CC | 7.96e-04 | 6.47e-01 | 0.5249 |
| 6670 | SP3 | CCI_3 | Human | Cervix | CC | 2.34e-05 | 7.28e-01 | 0.516 |
| 6670 | SP3 | L1 | Human | Cervix | CC | 7.06e-03 | -2.04e-01 | 0.0802 |
| 6670 | SP3 | HTA11_3410_2000001011 | Human | Colorectum | AD | 3.03e-19 | -5.86e-01 | 0.0155 |
| 6670 | SP3 | HTA11_2487_2000001011 | Human | Colorectum | SER | 2.75e-04 | -4.03e-01 | -0.1808 |
| 6670 | SP3 | HTA11_3361_2000001011 | Human | Colorectum | AD | 4.90e-05 | -5.17e-01 | -0.1207 |
| 6670 | SP3 | HTA11_83_2000001011 | Human | Colorectum | SER | 1.11e-02 | -4.10e-01 | -0.1526 |
| 6670 | SP3 | HTA11_696_2000001011 | Human | Colorectum | AD | 1.24e-09 | -4.25e-01 | -0.1464 |
| 6670 | SP3 | HTA11_866_2000001011 | Human | Colorectum | AD | 4.17e-06 | -3.82e-01 | -0.1001 |
| 6670 | SP3 | HTA11_1391_2000001011 | Human | Colorectum | AD | 3.88e-03 | -3.87e-01 | -0.059 |
| 6670 | SP3 | HTA11_866_3004761011 | Human | Colorectum | AD | 4.34e-07 | -4.37e-01 | 0.096 |
| 6670 | SP3 | HTA11_8622_2000001021 | Human | Colorectum | SER | 2.42e-02 | -5.36e-01 | 0.0528 |
| 6670 | SP3 | HTA11_10711_2000001011 | Human | Colorectum | AD | 2.53e-02 | -3.91e-01 | 0.0338 |
| 6670 | SP3 | HTA11_7696_3000711011 | Human | Colorectum | AD | 3.91e-11 | -4.57e-01 | 0.0674 |
| 6670 | SP3 | HTA11_99999970781_79442 | Human | Colorectum | MSS | 1.80e-05 | -3.84e-01 | 0.294 |
| 6670 | SP3 | HTA11_99999971662_82457 | Human | Colorectum | MSS | 2.30e-06 | -3.96e-01 | 0.3859 |
| 6670 | SP3 | HTA11_99999973899_84307 | Human | Colorectum | MSS | 2.49e-02 | -4.78e-01 | 0.2585 |
| 6670 | SP3 | HTA11_99999974143_84620 | Human | Colorectum | MSS | 2.48e-10 | -4.56e-01 | 0.3005 |
| 6670 | SP3 | F007 | Human | Colorectum | FAP | 3.30e-02 | -1.64e-01 | 0.1176 |
| Page: 1 2 3 4 5 6 7 8 9 |
| Tissue | Expression Dynamics | Abbreviation |
| Cervix |  | CC: Cervix cancer |
| HSIL_HPV: HPV-infected high-grade squamous intraepithelial lesions | ||
| N_HPV: HPV-infected normal cervix | ||
| Colorectum (GSE201348) | 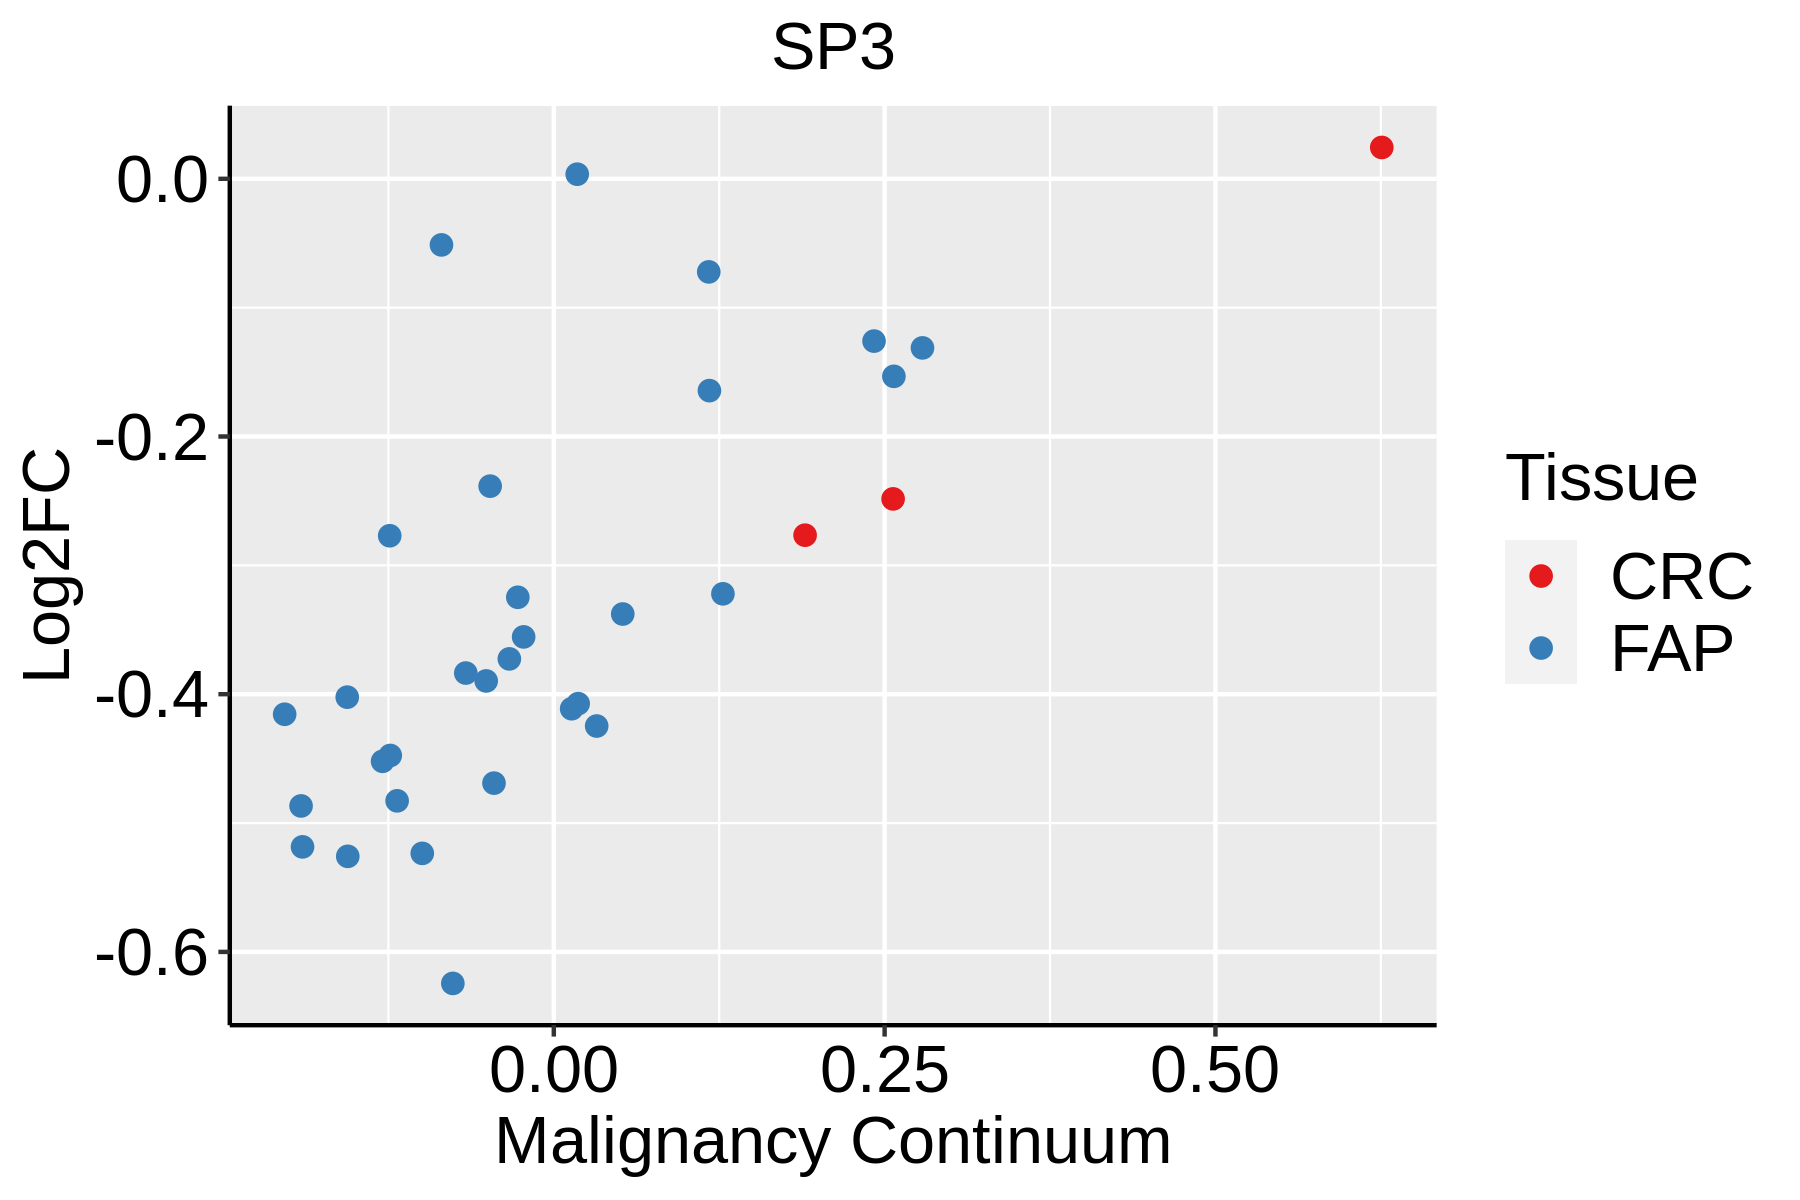 | FAP: Familial adenomatous polyposis |
| CRC: Colorectal cancer | ||
| Colorectum (HTA11) |  | AD: Adenomas |
| SER: Sessile serrated lesions | ||
| MSI-H: Microsatellite-high colorectal cancer | ||
| MSS: Microsatellite stable colorectal cancer | ||
| Esophagus |  | ESCC: Esophageal squamous cell carcinoma |
| HGIN: High-grade intraepithelial neoplasias | ||
| LGIN: Low-grade intraepithelial neoplasias | ||
| Liver |  | HCC: Hepatocellular carcinoma |
| NAFLD: Non-alcoholic fatty liver disease | ||
| Lung |  | AAH: Atypical adenomatous hyperplasia |
| AIS: Adenocarcinoma in situ | ||
| IAC: Invasive lung adenocarcinoma | ||
| MIA: Minimally invasive adenocarcinoma | ||
| Oral Cavity |  | EOLP: Erosive Oral lichen planus |
| LP: leukoplakia | ||
| NEOLP: Non-erosive oral lichen planus | ||
| OSCC: Oral squamous cell carcinoma | ||
| Skin |  | AK: Actinic keratosis |
| cSCC: Cutaneous squamous cell carcinoma | ||
| SCCIS:squamous cell carcinoma in situ | ||
| Thyroid | 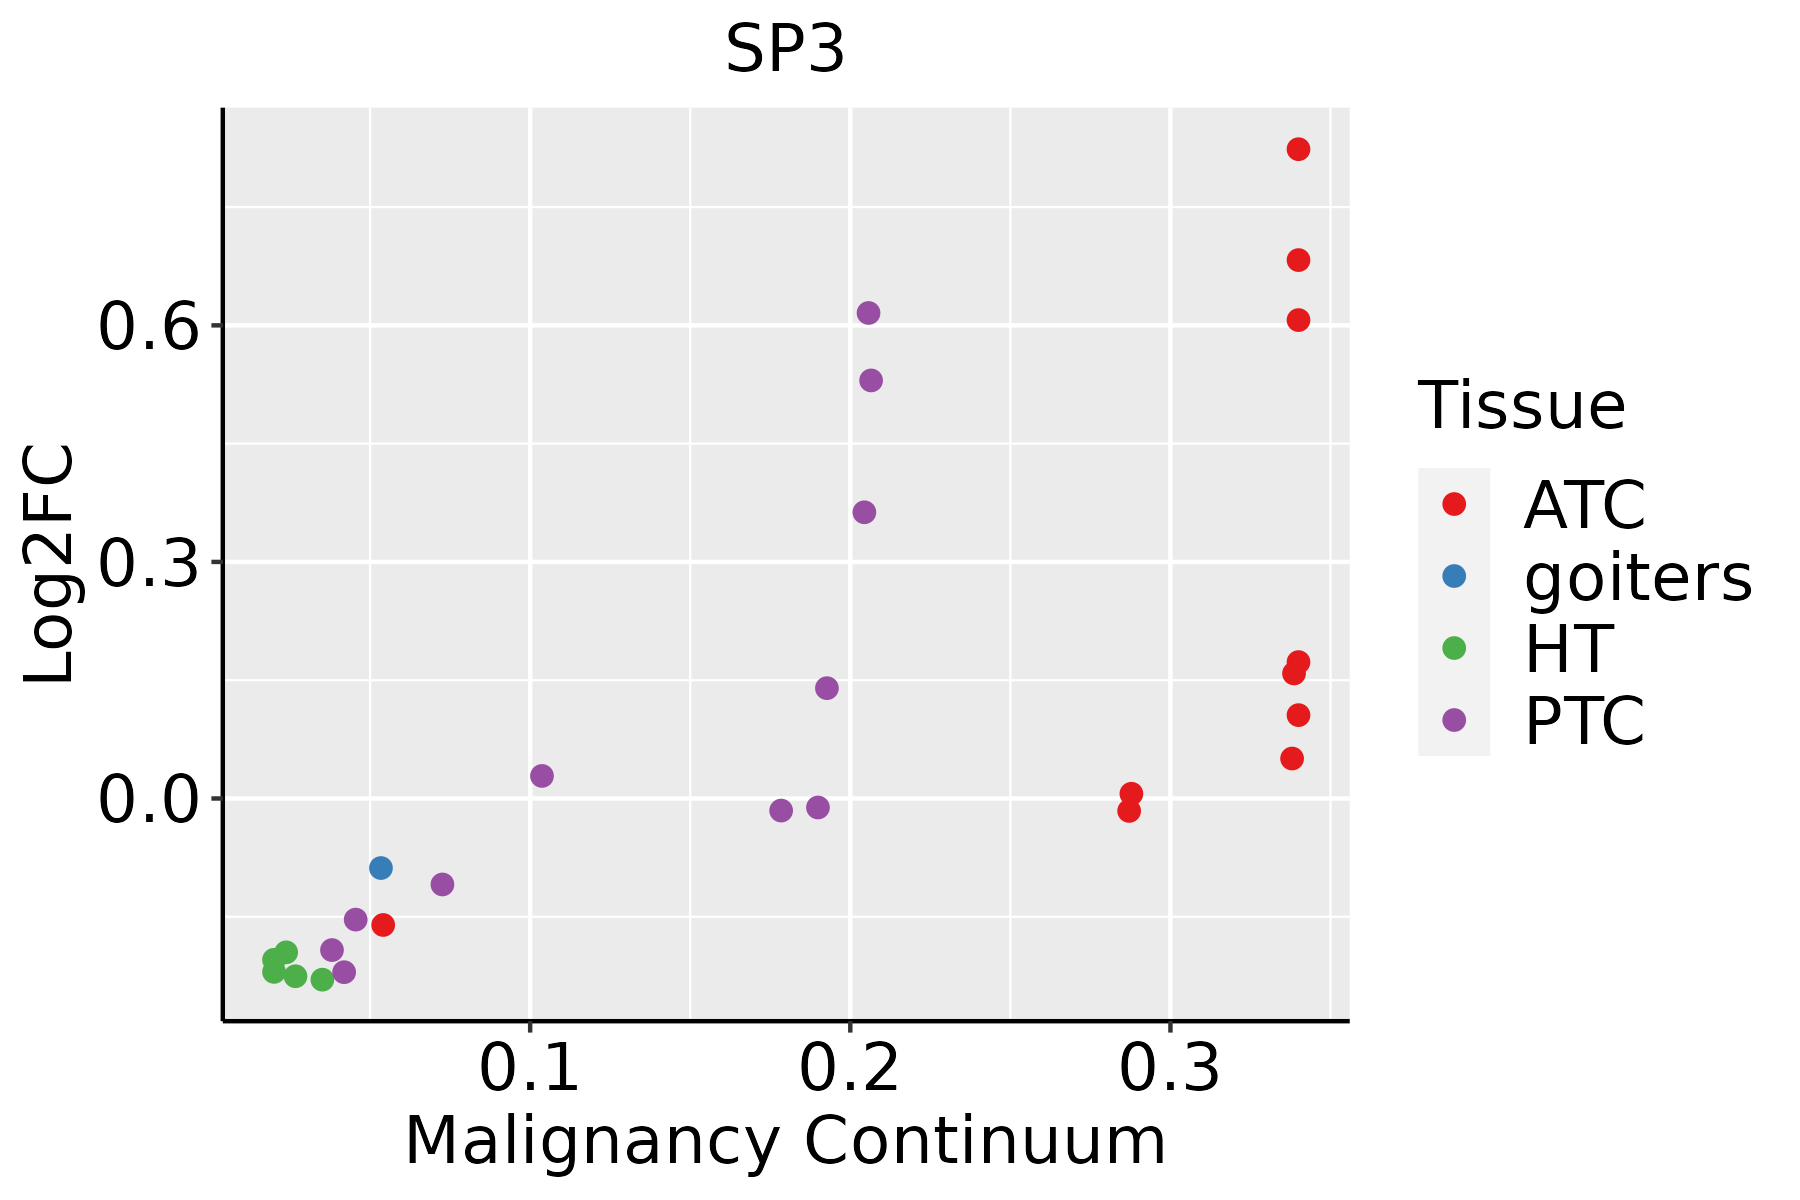 | ATC: Anaplastic thyroid cancer |
| HT: Hashimoto's thyroiditis | ||
| PTC: Papillary thyroid cancer |
| ∗log2FC in expression of this searched gene in stem-like cells from each diseased tissue sample relative to stem-like cells in normal samples in each tissue plotted against the malignancy continuum. Samples are colored based on if they are from different disease stage. |
Top |
Malignant transformation related pathway analysis |
| Find out the enriched GO biological processes and KEGG pathways involved in transition from healthy to precancer to cancer |
| Tissue | Disease Stage | Enriched GO biological Processes |
| Colorectum | AD |  |
| Colorectum | SER |  |
| Colorectum | MSS |  |
| Colorectum | MSI-H |  |
| Colorectum | FAP |  |
| ∗Top 15 enriched GO BP terms are showed in the bar plot of each disease state in each tissue. Each row represents a significant GO biological process which is colored according to the -log10(p.adjust). |
| Page: 1 2 3 4 5 6 7 8 9 |
| GO ID | Tissue | Disease Stage | Description | Gene Ratio | Bg Ratio | pvalue | p.adjust | Count |
| GO:0001933111 | Esophagus | ESCC | negative regulation of protein phosphorylation | 213/8552 | 342/18723 | 3.54e-10 | 9.76e-09 | 213 |
| GO:00457865 | Esophagus | ESCC | negative regulation of cell cycle | 236/8552 | 385/18723 | 3.62e-10 | 9.93e-09 | 236 |
| GO:0009895111 | Esophagus | ESCC | negative regulation of catabolic process | 201/8552 | 320/18723 | 3.88e-10 | 1.05e-08 | 201 |
| GO:004259419 | Esophagus | ESCC | response to starvation | 133/8552 | 197/18723 | 4.31e-10 | 1.14e-08 | 133 |
| GO:000699713 | Esophagus | ESCC | nucleus organization | 96/8552 | 133/18723 | 4.66e-10 | 1.21e-08 | 96 |
| GO:000704418 | Esophagus | ESCC | cell-substrate junction assembly | 73/8552 | 95/18723 | 5.27e-10 | 1.35e-08 | 73 |
| GO:007121419 | Esophagus | ESCC | cellular response to abiotic stimulus | 206/8552 | 331/18723 | 7.52e-10 | 1.88e-08 | 206 |
| GO:010400419 | Esophagus | ESCC | cellular response to environmental stimulus | 206/8552 | 331/18723 | 7.52e-10 | 1.88e-08 | 206 |
| GO:0036293111 | Esophagus | ESCC | response to decreased oxygen levels | 201/8552 | 322/18723 | 8.37e-10 | 2.04e-08 | 201 |
| GO:004578710 | Esophagus | ESCC | positive regulation of cell cycle | 196/8552 | 313/18723 | 9.27e-10 | 2.24e-08 | 196 |
| GO:0030099111 | Esophagus | ESCC | myeloid cell differentiation | 232/8552 | 381/18723 | 1.22e-09 | 2.90e-08 | 232 |
| GO:001631110 | Esophagus | ESCC | dephosphorylation | 251/8552 | 417/18723 | 1.26e-09 | 2.99e-08 | 251 |
| GO:003367319 | Esophagus | ESCC | negative regulation of kinase activity | 154/8552 | 237/18723 | 1.38e-09 | 3.27e-08 | 154 |
| GO:000646920 | Esophagus | ESCC | negative regulation of protein kinase activity | 140/8552 | 212/18723 | 1.53e-09 | 3.56e-08 | 140 |
| GO:0001666111 | Esophagus | ESCC | response to hypoxia | 192/8552 | 307/18723 | 1.59e-09 | 3.69e-08 | 192 |
| GO:0042542111 | Esophagus | ESCC | response to hydrogen peroxide | 102/8552 | 146/18723 | 2.64e-09 | 5.81e-08 | 102 |
| GO:003158919 | Esophagus | ESCC | cell-substrate adhesion | 221/8552 | 363/18723 | 3.06e-09 | 6.62e-08 | 221 |
| GO:000647018 | Esophagus | ESCC | protein dephosphorylation | 177/8552 | 281/18723 | 3.13e-09 | 6.72e-08 | 177 |
| GO:000042217 | Esophagus | ESCC | autophagy of mitochondrion | 63/8552 | 81/18723 | 3.41e-09 | 7.24e-08 | 63 |
| GO:006172617 | Esophagus | ESCC | mitochondrion disassembly | 63/8552 | 81/18723 | 3.41e-09 | 7.24e-08 | 63 |
| Page: 1 2 3 4 5 6 7 8 9 10 11 12 13 14 15 16 17 18 19 20 21 22 23 24 25 26 27 28 29 30 31 32 33 34 35 36 37 38 39 40 41 42 43 44 45 46 47 48 49 50 51 52 53 54 55 56 57 58 59 60 61 62 63 64 65 66 67 68 69 70 71 72 73 74 75 76 77 78 79 80 81 82 83 84 85 86 87 88 89 90 91 92 93 |
| Pathway ID | Tissue | Disease Stage | Description | Gene Ratio | Bg Ratio | pvalue | p.adjust | qvalue | Count |
| Page: 1 |
Top |
Cell-cell communication analysis |
| Identification of potential cell-cell interactions between two cell types and their ligand-receptor pairs for different disease states |
| Ligand | Receptor | LRpair | Pathway | Tissue | Disease Stage |
| Page: 1 |
Top |
Single-cell gene regulatory network inference analysis |
| Find out the significant the regulons (TFs) and the target genes of each regulon across cell types for different disease states |
| TF | Cell Type | Tissue | Disease Stage | Target Gene | RSS | Regulon Activity |
| ∗The dot plots of a searched regulon are shown for all cell subpopulations in each disease state of each tissue based on the regulon specific score inferred using pySCENIC and by calculating the average expression. |
| Page: 1 |
Top |
Somatic mutation of malignant transformation related genes |
| Annotation of somatic variants for genes involved in malignant transformation |
| Hugo Symbol | Variant Class | Variant Classification | dbSNP RS | HGVSc | HGVSp | HGVSp Short | SWISSPROT | BIOTYPE | SIFT | PolyPhen | Tumor Sample Barcode | Tissue | Histology | Sex | Age | Stage | Therapy Types | Drugs | Outcome |
| SP3 | SNV | Missense_Mutation | c.1030N>A | p.Asp344Asn | p.D344N | Q02447 | protein_coding | tolerated(0.18) | benign(0.011) | TCGA-A8-A08H-01 | Breast | breast invasive carcinoma | Female | >=65 | I/II | Unknown | Unknown | SD | |
| SP3 | SNV | Missense_Mutation | c.2128N>T | p.His710Tyr | p.H710Y | Q02447 | protein_coding | tolerated(0.82) | possibly_damaging(0.579) | TCGA-AC-A5XS-01 | Breast | breast invasive carcinoma | Female | >=65 | I/II | Hormone Therapy | femara | SD | |
| SP3 | SNV | Missense_Mutation | c.518T>G | p.Ile173Arg | p.I173R | Q02447 | protein_coding | deleterious(0) | probably_damaging(0.956) | TCGA-B6-A0I9-01 | Breast | breast invasive carcinoma | Female | <65 | III/IV | Unknown | Unknown | PD | |
| SP3 | SNV | Missense_Mutation | c.2066N>A | p.Arg689His | p.R689H | Q02447 | protein_coding | deleterious(0) | probably_damaging(0.998) | TCGA-D8-A142-01 | Breast | breast invasive carcinoma | Female | >=65 | I/II | Chemotherapy | cyclophosphamid | SD | |
| SP3 | SNV | Missense_Mutation | novel | c.1996G>T | p.Asp666Tyr | p.D666Y | Q02447 | protein_coding | deleterious(0) | probably_damaging(1) | TCGA-E9-A245-01 | Breast | breast invasive carcinoma | Female | <65 | I/II | Hormone Therapy | tamoxiphen | SD |
| SP3 | insertion | Frame_Shift_Ins | novel | c.1023_1024insTT | p.Thr342LeufsTer3 | p.T342Lfs*3 | Q02447 | protein_coding | TCGA-BH-A0HF-01 | Breast | breast invasive carcinoma | Female | >=65 | I/II | Hormone Therapy | arimidex | SD | ||
| SP3 | SNV | Missense_Mutation | novel | c.2324C>T | p.Ser775Phe | p.S775F | Q02447 | protein_coding | deleterious(0.01) | probably_damaging(0.915) | TCGA-C5-A1MN-01 | Cervix | cervical & endocervical cancer | Female | <65 | III/IV | Chemotherapy | cisplatin | SD |
| SP3 | SNV | Missense_Mutation | rs761430393 | c.2165N>T | p.Ala722Val | p.A722V | Q02447 | protein_coding | tolerated(0.26) | benign(0) | TCGA-LP-A4AU-01 | Cervix | cervical & endocervical cancer | Female | <65 | III/IV | Chemotherapy | cisplatin | CR |
| SP3 | SNV | Missense_Mutation | novel | c.1985T>G | p.Phe662Cys | p.F662C | Q02447 | protein_coding | deleterious(0) | probably_damaging(1) | TCGA-AA-3977-01 | Colorectum | colon adenocarcinoma | Male | >=65 | I/II | Unknown | Unknown | SD |
| SP3 | SNV | Missense_Mutation | novel | c.706N>T | p.Val236Phe | p.V236F | Q02447 | protein_coding | deleterious(0) | benign(0.383) | TCGA-AA-A01K-01 | Colorectum | colon adenocarcinoma | Female | >=65 | III/IV | Chemotherapy | folinic | CR |
| Page: 1 2 3 4 5 6 7 |
Top |
Related drugs of malignant transformation related genes |
| Identification of chemicals and drugs interact with genes involved in malignant transfromation |
| (DGIdb 4.0) |
| Entrez ID | Symbol | Category | Interaction Types | Drug Claim Name | Drug Name | PMIDs |
| 6670 | SP3 | TRANSCRIPTION FACTOR | DOXORUBICIN | DOXORUBICIN | 17511886 |
| Page: 1 |

Copyright 2023-Present -The University of Texas Health Science Center at Houston |