Schematic overview of the cellular and molecular mechanisms involved in the cancer progression, including the proposed cellular and molecular mechanisms in cancer cells trajectory. AT1: alveolar type 1 cells; AT2: alveolar type 2 cells; AAH: atypical adenomatous hyperplasia; AIS: adenocarcinoma in situ; MIA: minimally invasive adenocarcinoma; IA: invasive adenocarcinoma; EMT: epithelial-mesenchymal transition

Home

Download

Statistics

Help

Contact

Center for Computational Systems Medicine
leaf

Gene summary

leaf

Malignant transformation analysis

leaf

Malignant transformation related pathway analysis

leaf

Cell-cell communication analysis

leaf

Single-cell gene regulatory network inference analysis

leaf

Somatic mutation of malignant transformation related genes

leaf

Related drugs of malignant transformation related genes

Gene: SLC25A1

Gene summary for SLC25A1

check button Gene summary.

Gene informationSpeciesHuman
Gene symbol

SLC25A1

Gene ID

6576

Gene namesolute carrier family 25 member 1
Gene AliasCMS23
Cytomap22q11.21
Gene Typeprotein-coding
GO ID

GO:0005975

UniProtAcc

D9HTE9


Top

Malignant transformation analysis

check button Identification of the aberrant gene expression in precancerous and cancerous lesions by comparing the gene expression of stem-like cells in diseased tissues with normal stem cells
check button Malignant transformation involving gene list.
Entrez IDSymbolReplicatesSpeciesOrganTissueAdj P-valueLog2FCMalignancy
6576SLC25A1GSM4909281HumanBreastIDC1.23e-042.69e-010.21
6576SLC25A1GSM4909291HumanBreastIDC1.74e-267.71e-010.1753
6576SLC25A1GSM4909304HumanBreastIDC9.75e-276.31e-010.1636
6576SLC25A1GSM4909311HumanBreastIDC3.56e-05-2.54e-020.1534
6576SLC25A1GSM4909315HumanBreastIDC4.47e-022.69e-010.21
6576SLC25A1GSM4909317HumanBreastIDC1.78e-165.27e-010.1355
6576SLC25A1GSM4909319HumanBreastIDC3.63e-10-4.10e-020.1563
6576SLC25A1GSM4909320HumanBreastIDC9.92e-032.70e-010.1575
6576SLC25A1GSM4909321HumanBreastIDC6.39e-082.37e-010.1559
6576SLC25A1DCIS2HumanBreastDCIS3.71e-401.24e-010.0085
6576SLC25A1HTA11_3410_2000001011HumanColorectumAD1.67e-081.58e-010.0155
6576SLC25A1HTA11_2487_2000001011HumanColorectumSER5.17e-229.58e-01-0.1808
6576SLC25A1HTA11_1938_2000001011HumanColorectumAD1.45e-134.96e-01-0.0811
6576SLC25A1HTA11_78_2000001011HumanColorectumAD3.30e-094.39e-01-0.1088
6576SLC25A1HTA11_347_2000001011HumanColorectumAD5.19e-235.27e-01-0.1954
6576SLC25A1HTA11_411_2000001011HumanColorectumSER1.96e-101.12e+00-0.2602
6576SLC25A1HTA11_2112_2000001011HumanColorectumSER1.23e-069.45e-01-0.2196
6576SLC25A1HTA11_3361_2000001011HumanColorectumAD4.70e-095.36e-01-0.1207
6576SLC25A1HTA11_83_2000001011HumanColorectumSER5.90e-105.75e-01-0.1526
6576SLC25A1HTA11_696_2000001011HumanColorectumAD6.77e-277.00e-01-0.1464
Page: 1 2 3 4 5 6 7 8 

check button Transcriptomic changes along malignancy continuum.
TissueExpression DynamicsAbbreviation
BreastThe image shows the transcriptomic changes along malignancy continuum.log2FC in expression of this searched gene in stem-like cells from each diseased tissue sample relative to stem-like cells in normal samples in each tissue plotted against the malignancy continuum. Samples are colored based on if they are from different disease stage.
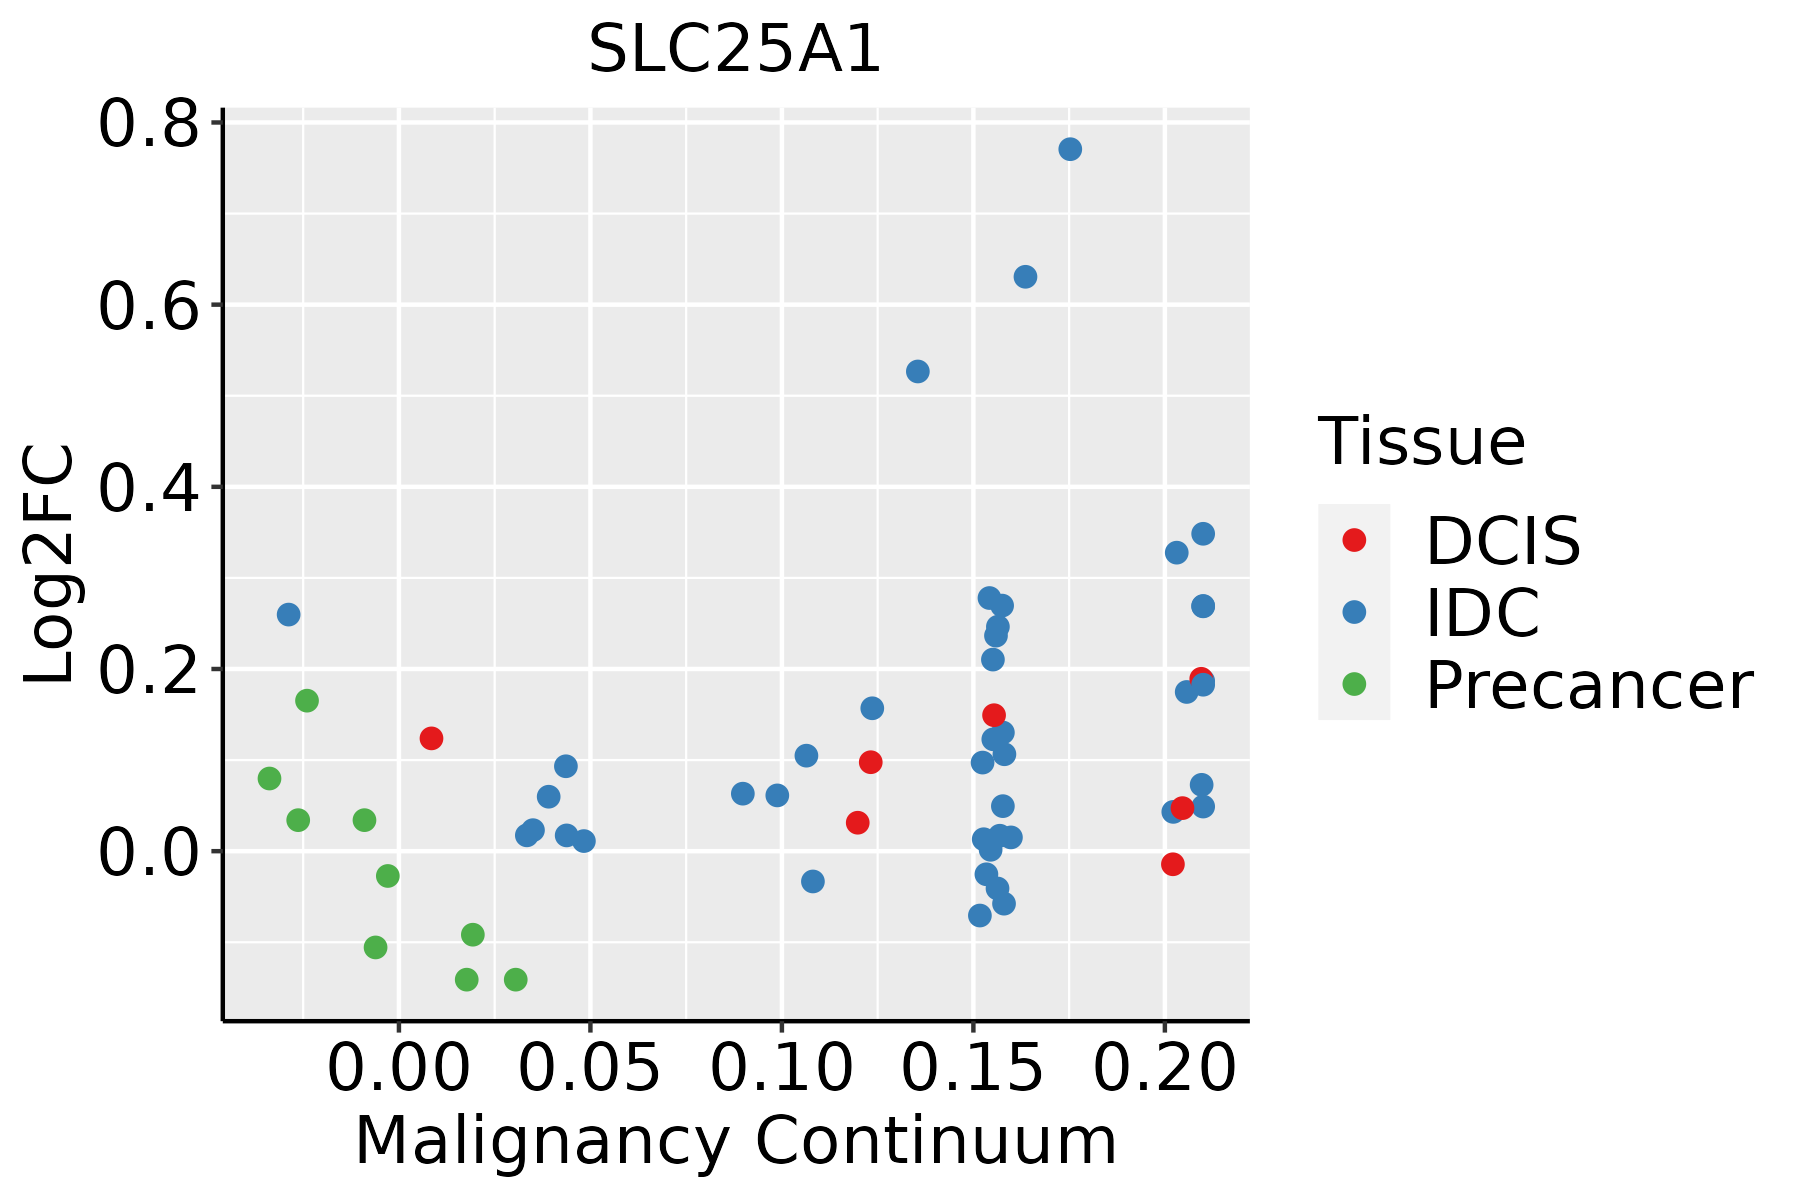
IDC: Invasive ductal carcinoma
DCIS: Ductal carcinoma in situ
Precancer(BRCA1-mut): Precancerous lesion from BRCA1 mutation carriers
Colorectum (GSE201348)The image shows the transcriptomic changes along malignancy continuum.log2FC in expression of this searched gene in stem-like cells from each diseased tissue sample relative to stem-like cells in normal samples in each tissue plotted against the malignancy continuum. Samples are colored based on if they are from different disease stage.FAP: Familial adenomatous polyposis
CRC: Colorectal cancer
Colorectum (HTA11)The image shows the transcriptomic changes along malignancy continuum.log2FC in expression of this searched gene in stem-like cells from each diseased tissue sample relative to stem-like cells in normal samples in each tissue plotted against the malignancy continuum. Samples are colored based on if they are from different disease stage.AD: Adenomas
SER: Sessile serrated lesions
MSI-H: Microsatellite-high colorectal cancer
MSS: Microsatellite stable colorectal cancer
EsophagusThe image shows the transcriptomic changes along malignancy continuum.log2FC in expression of this searched gene in stem-like cells from each diseased tissue sample relative to stem-like cells in normal samples in each tissue plotted against the malignancy continuum. Samples are colored based on if they are from different disease stage.
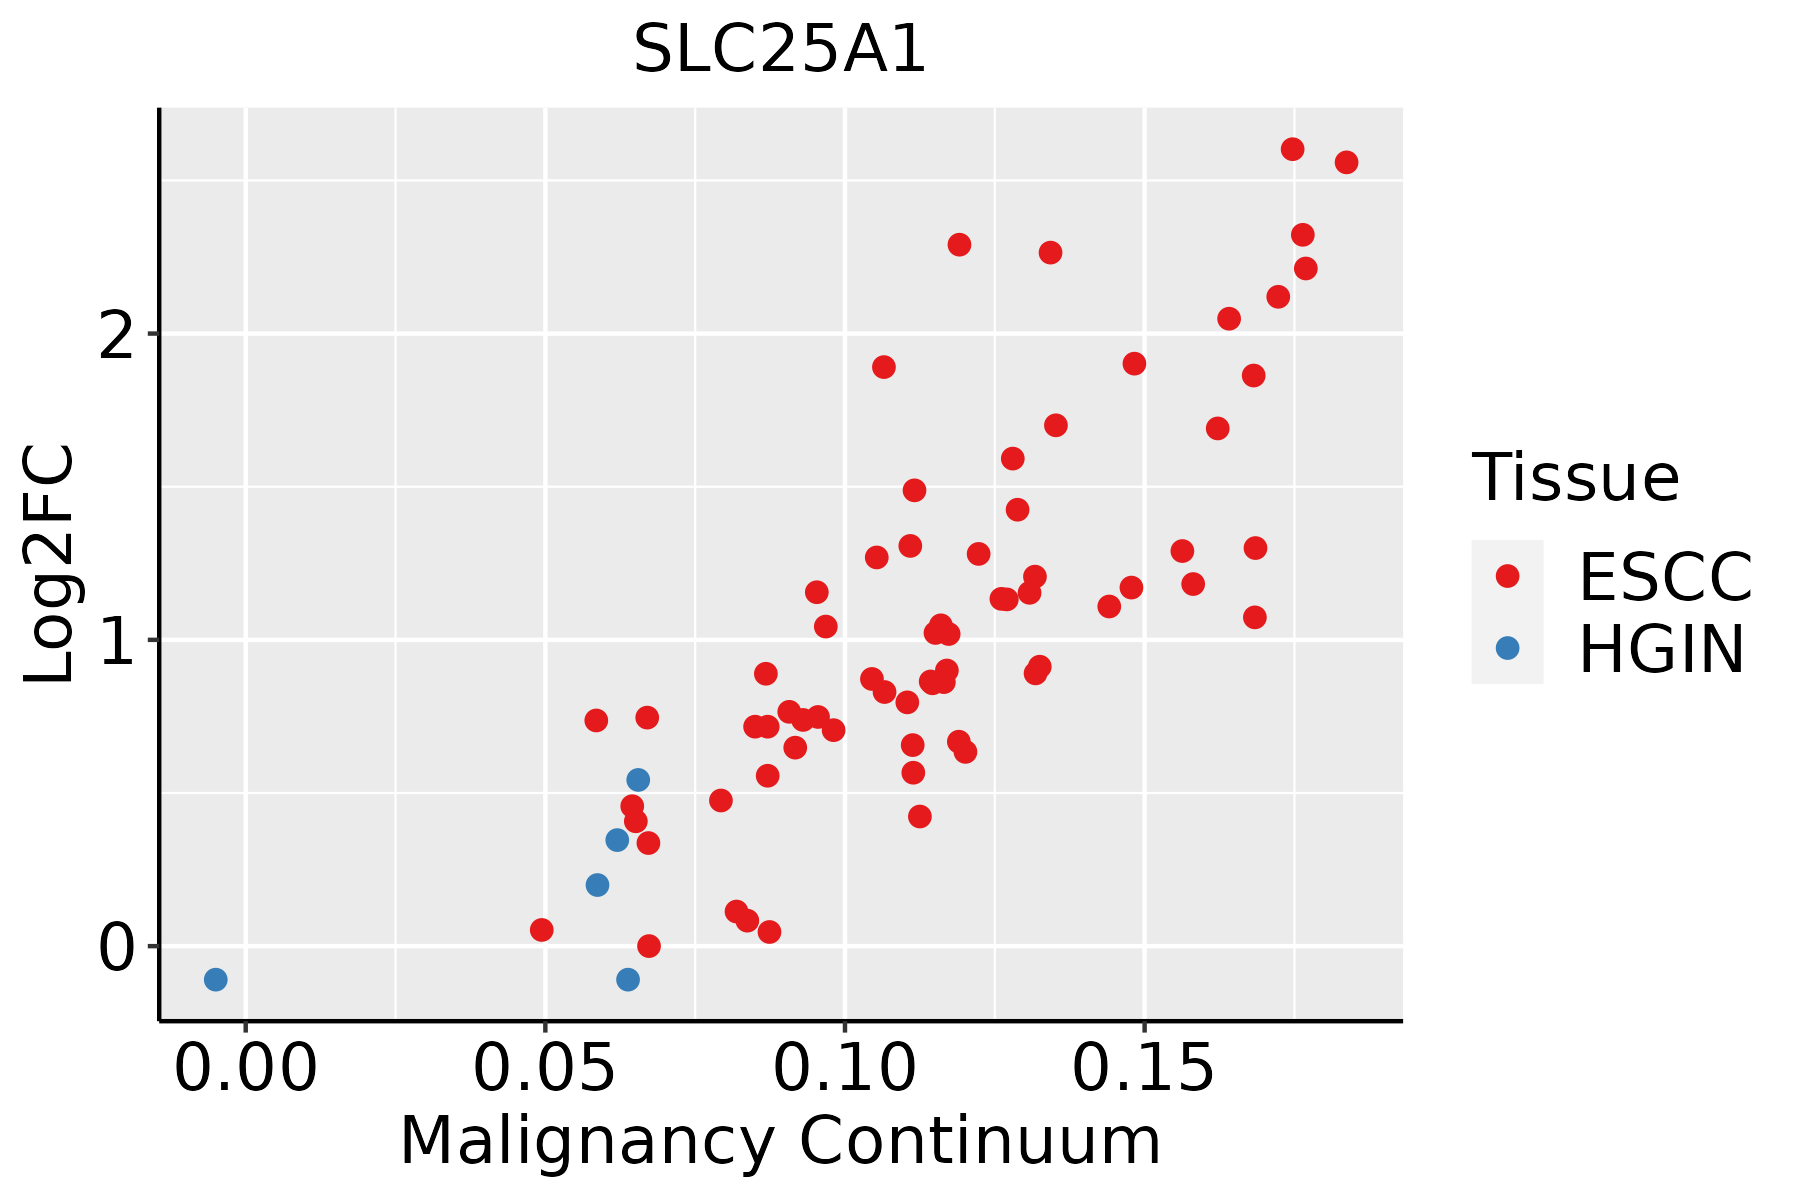
ESCC: Esophageal squamous cell carcinoma
HGIN: High-grade intraepithelial neoplasias
LGIN: Low-grade intraepithelial neoplasias
LiverThe image shows the transcriptomic changes along malignancy continuum.log2FC in expression of this searched gene in stem-like cells from each diseased tissue sample relative to stem-like cells in normal samples in each tissue plotted against the malignancy continuum. Samples are colored based on if they are from different disease stage.HCC: Hepatocellular carcinoma
NAFLD: Non-alcoholic fatty liver disease
Oral CavityThe image shows the transcriptomic changes along malignancy continuum.log2FC in expression of this searched gene in stem-like cells from each diseased tissue sample relative to stem-like cells in normal samples in each tissue plotted against the malignancy continuum. Samples are colored based on if they are from different disease stage.
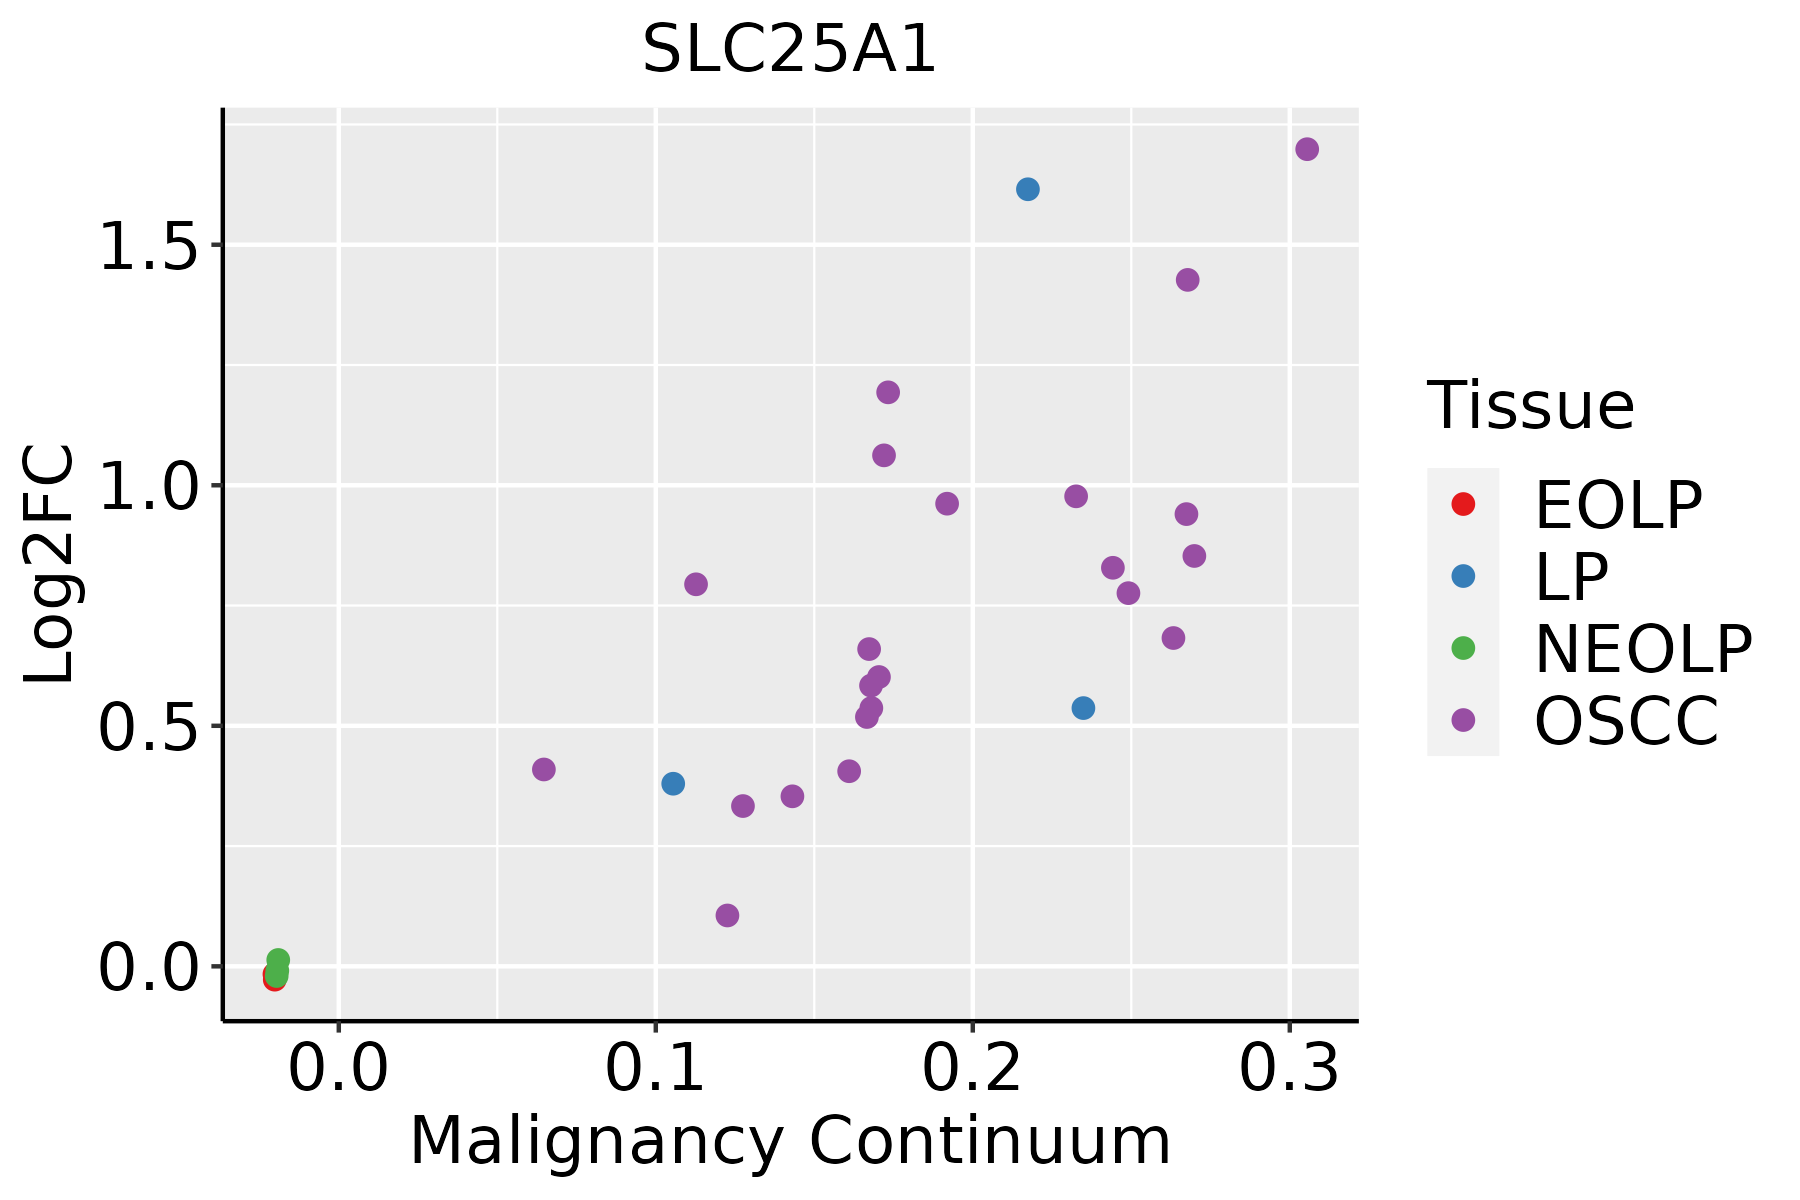
EOLP: Erosive Oral lichen planus
LP: leukoplakia
NEOLP: Non-erosive oral lichen planus
OSCC: Oral squamous cell carcinoma
ProstateThe image shows the transcriptomic changes along malignancy continuum.log2FC in expression of this searched gene in stem-like cells from each diseased tissue sample relative to stem-like cells in normal samples in each tissue plotted against the malignancy continuum. Samples are colored based on if they are from different disease stage.
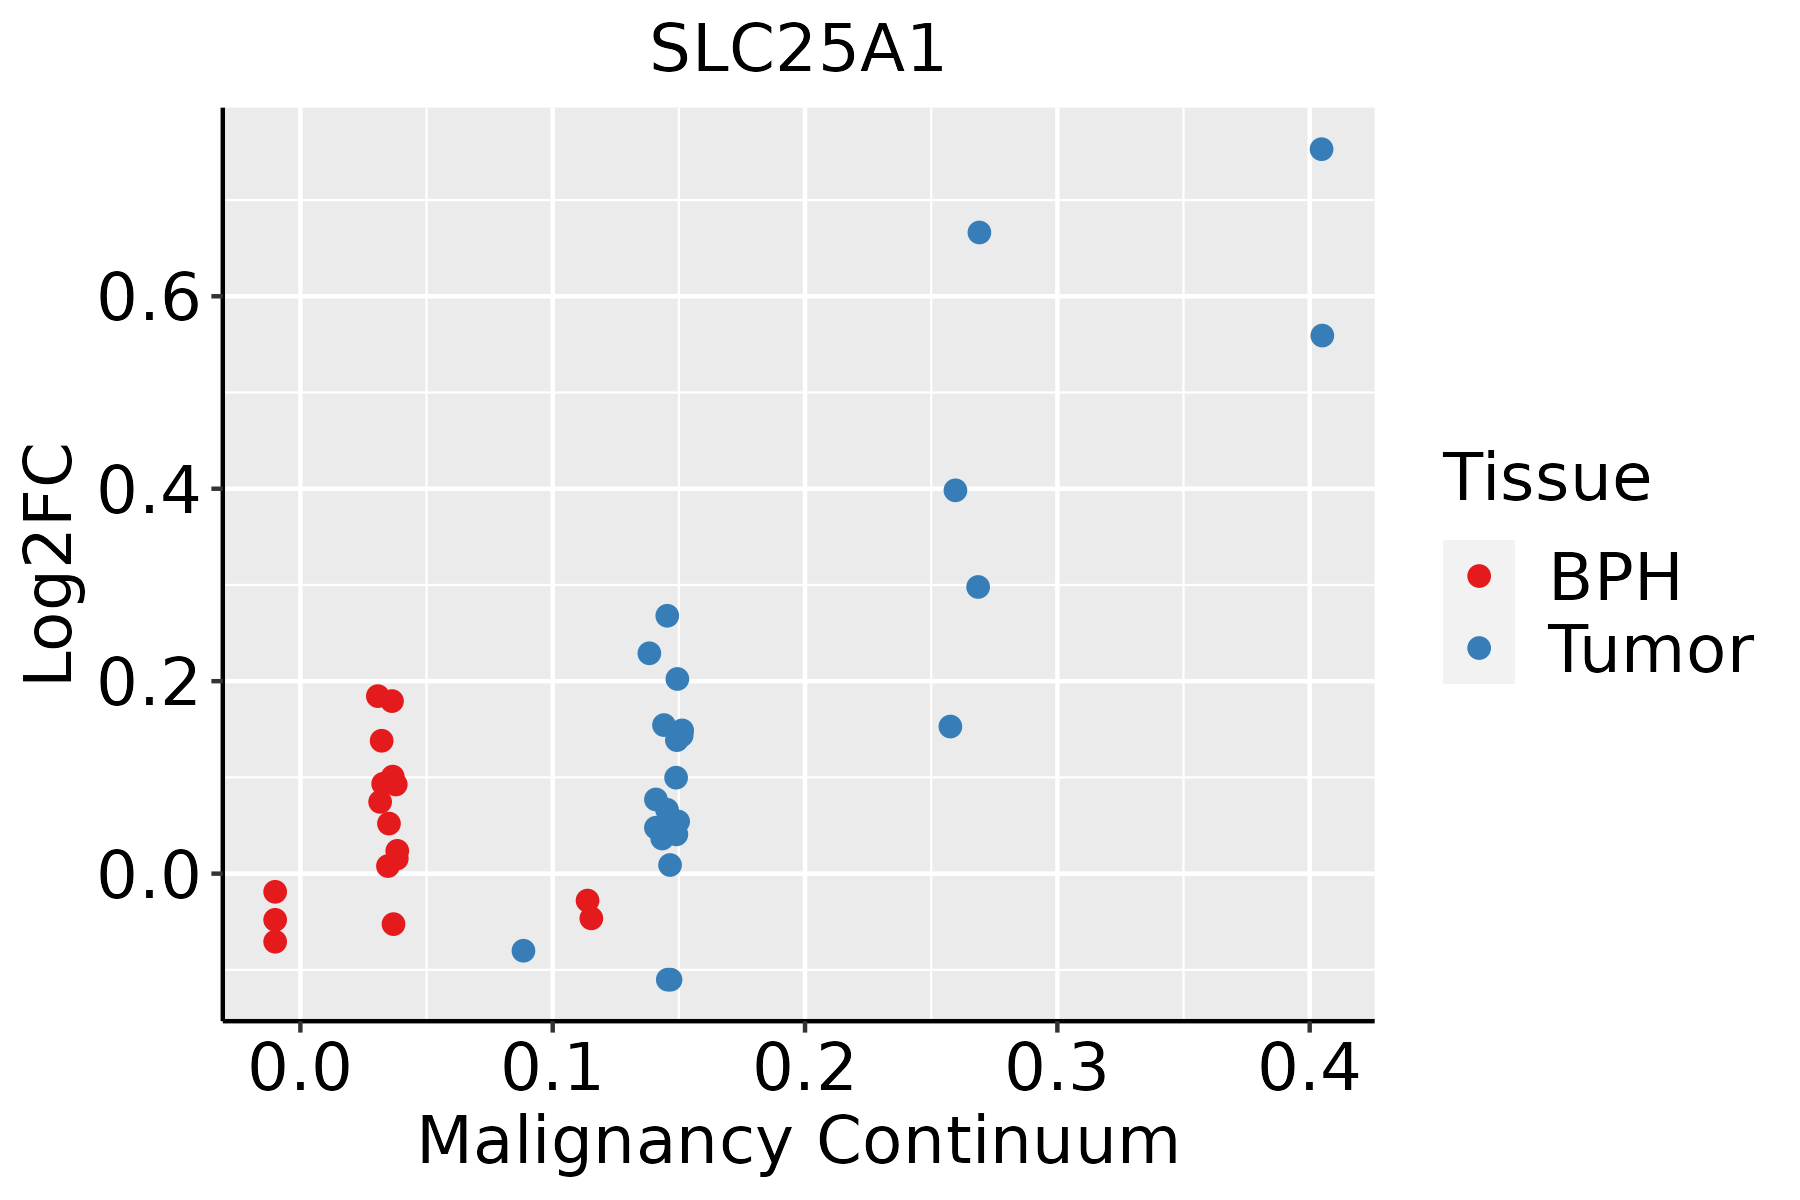
BPH: Benign Prostatic Hyperplasia
SkinThe image shows the transcriptomic changes along malignancy continuum.log2FC in expression of this searched gene in stem-like cells from each diseased tissue sample relative to stem-like cells in normal samples in each tissue plotted against the malignancy continuum. Samples are colored based on if they are from different disease stage.
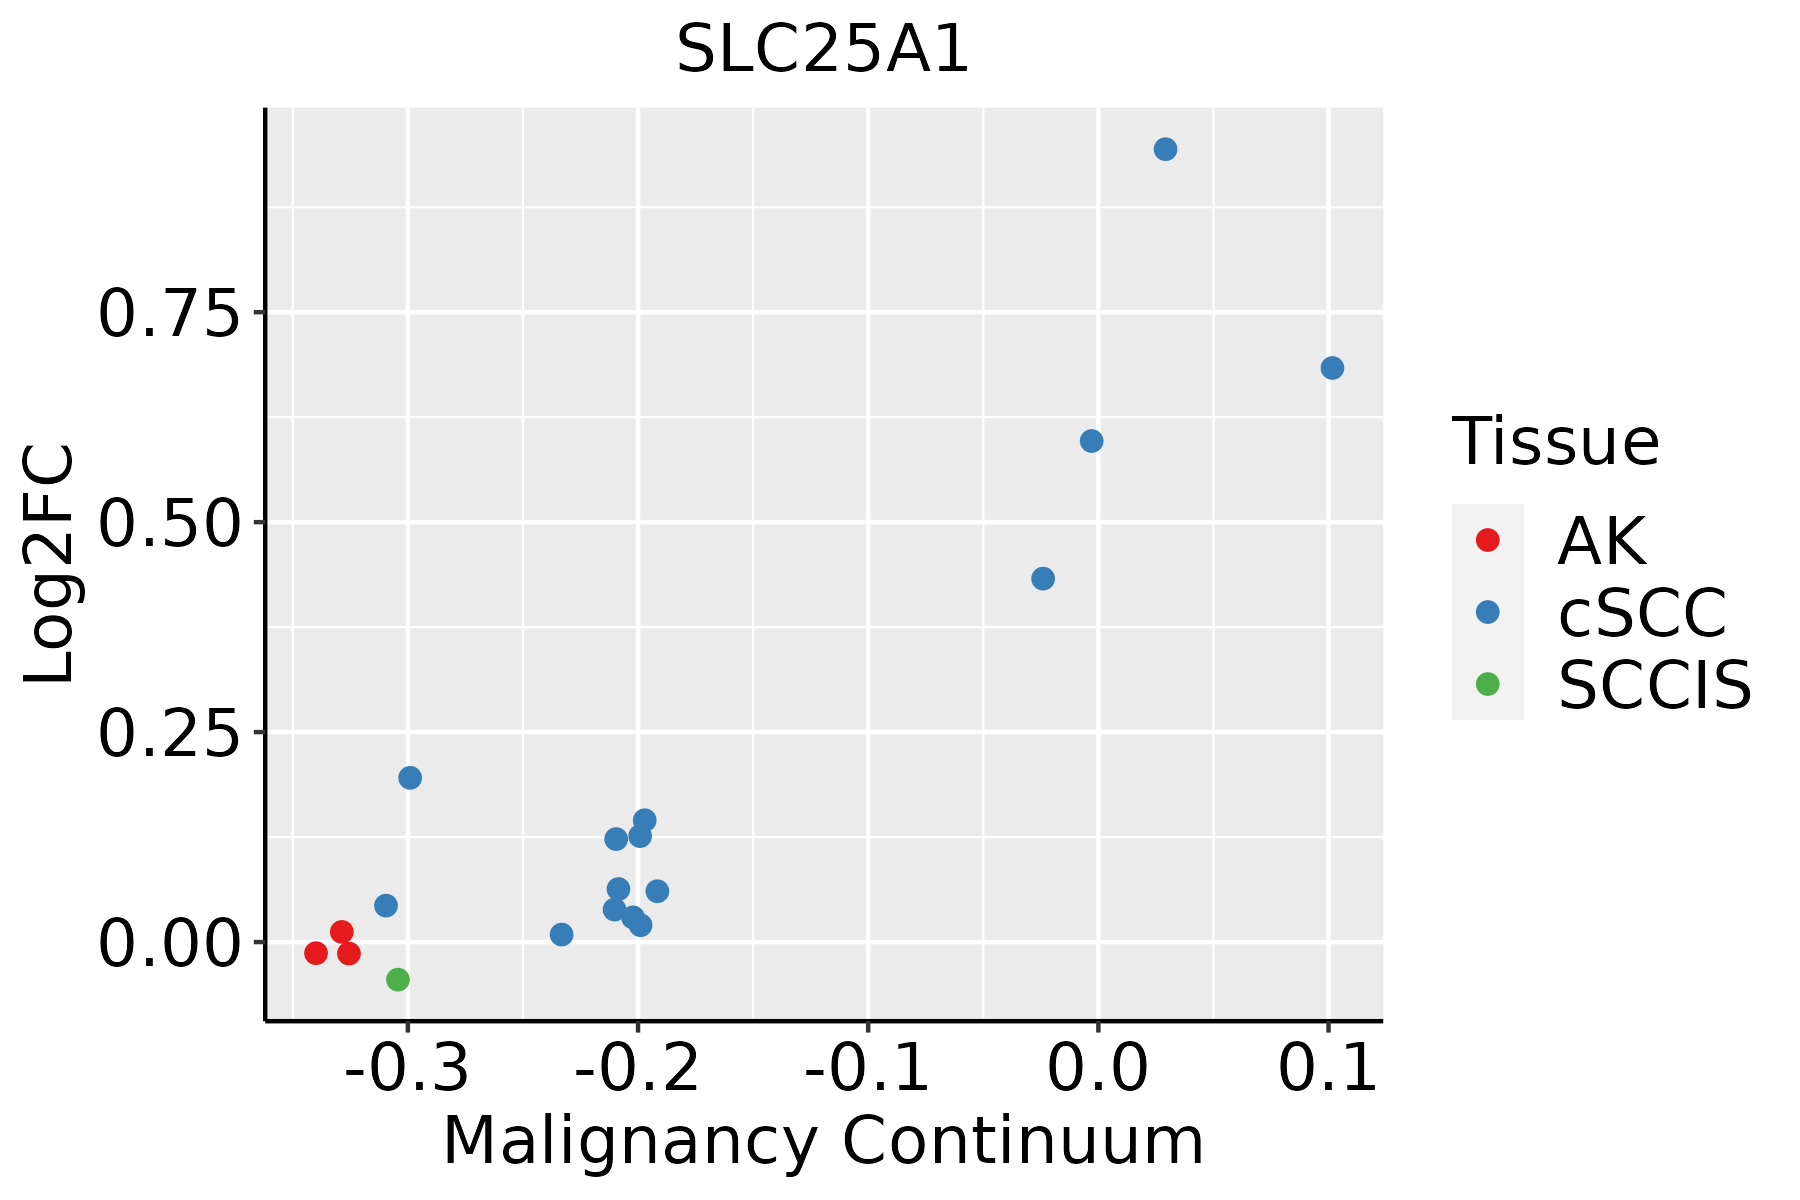
AK: Actinic keratosis
cSCC: Cutaneous squamous cell carcinoma
SCCIS:squamous cell carcinoma in situ
ThyroidThe image shows the transcriptomic changes along malignancy continuum.log2FC in expression of this searched gene in stem-like cells from each diseased tissue sample relative to stem-like cells in normal samples in each tissue plotted against the malignancy continuum. Samples are colored based on if they are from different disease stage.ATC: Anaplastic thyroid cancer
HT: Hashimoto's thyroiditis
PTC: Papillary thyroid cancer
∗log2FC in expression of this searched gene in stem-like cells from each diseased tissue sample relative to stem-like cells in normal samples in each tissue plotted against the malignancy continuum. Samples are colored based on if they are from different disease stage.

Top

Malignant transformation related pathway analysis

check buttonFind out the enriched GO biological processes and KEGG pathways involved in transition from healthy to precancer to cancer
check button Figure of enriched GO biological processes.
TissueDisease StageEnriched GO biological Processes
ColorectumADGO analysis - Figure of enriched GO biological processes: Top 15 enriched GO BP terms are showed in the bar plot of each disease state in each tissue. Each row represents a significant GO biological process which is colored according to the -log10(p.adjust).
ColorectumSERGO analysis - Figure of enriched GO biological processes: Top 15 enriched GO BP terms are showed in the bar plot of each disease state in each tissue. Each row represents a significant GO biological process which is colored according to the -log10(p.adjust).
ColorectumMSSGO analysis - Figure of enriched GO biological processes: Top 15 enriched GO BP terms are showed in the bar plot of each disease state in each tissue. Each row represents a significant GO biological process which is colored according to the -log10(p.adjust).
ColorectumMSI-HGO analysis - Figure of enriched GO biological processes: Top 15 enriched GO BP terms are showed in the bar plot of each disease state in each tissue. Each row represents a significant GO biological process which is colored according to the -log10(p.adjust).
ColorectumFAPGO analysis - Figure of enriched GO biological processes: Top 15 enriched GO BP terms are showed in the bar plot of each disease state in each tissue. Each row represents a significant GO biological process which is colored according to the -log10(p.adjust).
∗Top 15 enriched GO BP terms are showed in the bar plot of each disease state in each tissue. Each row represents a significant GO biological process which is colored according to the -log10(p.adjust).
Page: 1 2 3 4 5 6 7 8 9 

check button Enriched GO biological processes.
GO IDTissueDisease StageDescriptionGene RatioBg Ratiopvaluep.adjustCount
GO:19016051LiverCirrhoticalpha-amino acid metabolic process82/4634195/187237.72e-082.30e-0682
GO:000600611LiverCirrhoticglucose metabolic process82/4634196/187231.01e-072.93e-0682
GO:000652011LiverCirrhoticcellular amino acid metabolic process103/4634284/187238.88e-061.30e-04103
GO:005159211LiverCirrhoticresponse to calcium ion61/4634149/187239.47e-061.38e-0461
GO:00463641LiverCirrhoticmonosaccharide biosynthetic process37/463482/187234.52e-055.30e-0437
GO:00442721LiverCirrhoticsulfur compound biosynthetic process58/4634148/187236.93e-057.83e-0458
GO:00463905LiverCirrhoticribose phosphate biosynthetic process71/4634190/187237.09e-057.98e-0471
GO:00092605LiverCirrhoticribonucleotide biosynthetic process68/4634182/187231.00e-041.05e-0368
GO:00091654LiverCirrhoticnucleotide biosynthetic process89/4634254/187231.45e-041.40e-0389
GO:00160511LiverCirrhoticcarbohydrate biosynthetic process73/4634202/187231.91e-041.77e-0373
GO:19012934LiverCirrhoticnucleoside phosphate biosynthetic process89/4634256/187231.97e-041.82e-0389
GO:00338651LiverCirrhoticnucleoside bisphosphate metabolic process50/4634128/187232.32e-042.11e-0350
GO:00338751LiverCirrhoticribonucleoside bisphosphate metabolic process50/4634128/187232.32e-042.11e-0350
GO:00340321LiverCirrhoticpurine nucleoside bisphosphate metabolic process50/4634128/187232.32e-042.11e-0350
GO:00091526LiverCirrhoticpurine ribonucleotide biosynthetic process62/4634169/187233.52e-043.00e-0362
GO:19905425LiverCirrhoticmitochondrial transmembrane transport41/4634102/187234.08e-043.37e-0341
GO:00193191LiverCirrhotichexose biosynthetic process33/463478/187234.94e-043.96e-0333
GO:00060941LiverCirrhoticgluconeogenesis32/463475/187235.00e-043.98e-0332
GO:00066371LiverCirrhoticacyl-CoA metabolic process38/463496/187239.23e-046.57e-0338
GO:00353831LiverCirrhoticthioester metabolic process38/463496/187239.23e-046.57e-0338
Page: 1 2 3 4 5 6 7 8 9 10 11 12 13 14 15 16 17 18 19 20 21 22 23 24 25 26 27 28 29 30 31 32 33 34 35 36 37 38 39 

check button Enriched KEGG pathways.
Pathway IDTissueDisease StageDescriptionGene RatioBg Ratiopvaluep.adjustqvalueCount
Page: 1 

Top

Cell-cell communication analysis

check buttonIdentification of potential cell-cell interactions between two cell types and their ligand-receptor pairs for different disease states
LigandReceptorLRpairPathwayTissueDisease Stage
Page: 1 

Top

Single-cell gene regulatory network inference analysis

check buttonFind out the significant the regulons (TFs) and the target genes of each regulon across cell types for different disease states
TFCell TypeTissueDisease StageTarget GeneRSSRegulon Activity
∗The dot plots of a searched regulon are shown for all cell subpopulations in each disease state of each tissue based on the regulon specific score inferred using pySCENIC and by calculating the average expression.
Page: 1 

Top

Somatic mutation of malignant transformation related genes

check buttonAnnotation of somatic variants for genes involved in malignant transformation
Hugo SymbolVariant ClassVariant ClassificationdbSNP RSHGVScHGVSpHGVSp ShortSWISSPROTBIOTYPESIFTPolyPhenTumor Sample BarcodeTissueHistologySexAgeStageTherapy TypesDrugsOutcome
SLC25A1SNVMissense_Mutationc.709N>Ap.Gly237Argp.G237RP53007protein_codingdeleterious(0)probably_damaging(0.996)TCGA-C8-A27B-01Breastbreast invasive carcinomaFemale<65I/IIChemotherapy5-fluorouracilCR
SLC25A1SNVMissense_Mutationrs782258354c.694N>Ap.Ala232Thrp.A232TP53007protein_codingdeleterious(0.03)possibly_damaging(0.846)TCGA-LL-A7SZ-01Breastbreast invasive carcinomaFemale<65I/IIChemotherapyadriamycinCR
SLC25A1insertionFrame_Shift_Insnovelc.226_227insTTACCTTCTCACCTATCAGCTGCTTTTACTTTCAGAATTGp.Arg76LeufsTer26p.R76Lfs*26P53007protein_codingTCGA-A2-A0D1-01Breastbreast invasive carcinomaFemale>=65I/IIChemotherapytaxotereSD
SLC25A1SNVMissense_Mutationc.358G>Ap.Asp120Asnp.D120NP53007protein_codingtolerated(0.27)benign(0.007)TCGA-EX-A1H5-01Cervixcervical & endocervical cancerFemale<65I/IIUnknownUnknownSD
SLC25A1SNVMissense_Mutationrs431905510c.845N>Ap.Arg282Hisp.R282HP53007protein_codingdeleterious(0)probably_damaging(0.975)TCGA-QG-A5Z2-01Colorectumcolon adenocarcinomaMale<65I/IIUnknownUnknownSD
SLC25A1SNVMissense_Mutationnovelc.593N>Ap.Arg198Hisp.R198HP53007protein_codingdeleterious(0)probably_damaging(0.998)TCGA-AP-A051-01Endometriumuterine corpus endometrioid carcinomaFemale>=65I/IIUnknownUnknownSD
SLC25A1SNVMissense_Mutationnovelc.631N>Ap.Gly211Argp.G211RP53007protein_codingdeleterious(0.02)benign(0.445)TCGA-AP-A1DK-01Endometriumuterine corpus endometrioid carcinomaFemale<65I/IIUnknownUnknownSD
SLC25A1SNVMissense_Mutationnovelc.631N>Tp.Gly211Trpp.G211WP53007protein_codingdeleterious(0)probably_damaging(0.994)TCGA-AP-A1DM-01Endometriumuterine corpus endometrioid carcinomaFemale<65I/IIUnknownUnknownSD
SLC25A1SNVMissense_Mutationc.457N>Ap.Asp153Asnp.D153NP53007protein_codingdeleterious(0.03)possibly_damaging(0.709)TCGA-AP-A1E0-01Endometriumuterine corpus endometrioid carcinomaFemale<65III/IVChemotherapypaclitaxelSD
SLC25A1SNVMissense_Mutationnovelc.725N>Gp.Asp242Glyp.D242GP53007protein_codingdeleterious(0)probably_damaging(0.999)TCGA-B5-A3FA-01Endometriumuterine corpus endometrioid carcinomaFemale>=65I/IIUnknownUnknownSD
Page: 1 2 

Top

Related drugs of malignant transformation related genes

check buttonIdentification of chemicals and drugs interact with genes involved in malignant transfromation
(DGIdb 4.0)
Entrez IDSymbolCategoryInteraction TypesDrug Claim NameDrug NamePMIDs
6576SLC25A1TRANSPORTER, DRUGGABLE GENOMEinhibitor178101413
Page: 1