
|
|||||
|
 | |
| |
| |
| |
| |
| |
|
Gene: SELE |
Gene summary for SELE |
| Gene information | Species | Human | Gene symbol | SELE | Gene ID | 6401 |
| Gene name | selectin E | |
| Gene Alias | CD62E | |
| Cytomap | 1q24.2 | |
| Gene Type | protein-coding | GO ID | GO:0002090 | UniProtAcc | P16581 |
Top |
Malignant transformation analysis |
| Identification of the aberrant gene expression in precancerous and cancerous lesions by comparing the gene expression of stem-like cells in diseased tissues with normal stem cells |
| Entrez ID | Symbol | Replicates | Species | Organ | Tissue | Adj P-value | Log2FC | Malignancy |
| 6401 | SELE | P2T-E | Human | Esophagus | ESCC | 2.96e-09 | 9.01e-01 | 0.1177 |
| 6401 | SELE | P38T-E | Human | Esophagus | ESCC | 3.60e-04 | 2.01e-01 | 0.127 |
| 6401 | SELE | P61T-E | Human | Esophagus | ESCC | 1.63e-06 | 6.22e-02 | 0.099 |
| 6401 | SELE | P80T-E | Human | Esophagus | ESCC | 2.02e-02 | 5.43e-02 | 0.155 |
| 6401 | SELE | P127T-E | Human | Esophagus | ESCC | 7.96e-04 | 2.63e-02 | 0.0826 |
| 6401 | SELE | P128T-E | Human | Esophagus | ESCC | 5.36e-31 | 1.16e+00 | 0.1241 |
| Page: 1 |
| Tissue | Expression Dynamics | Abbreviation |
| Esophagus | 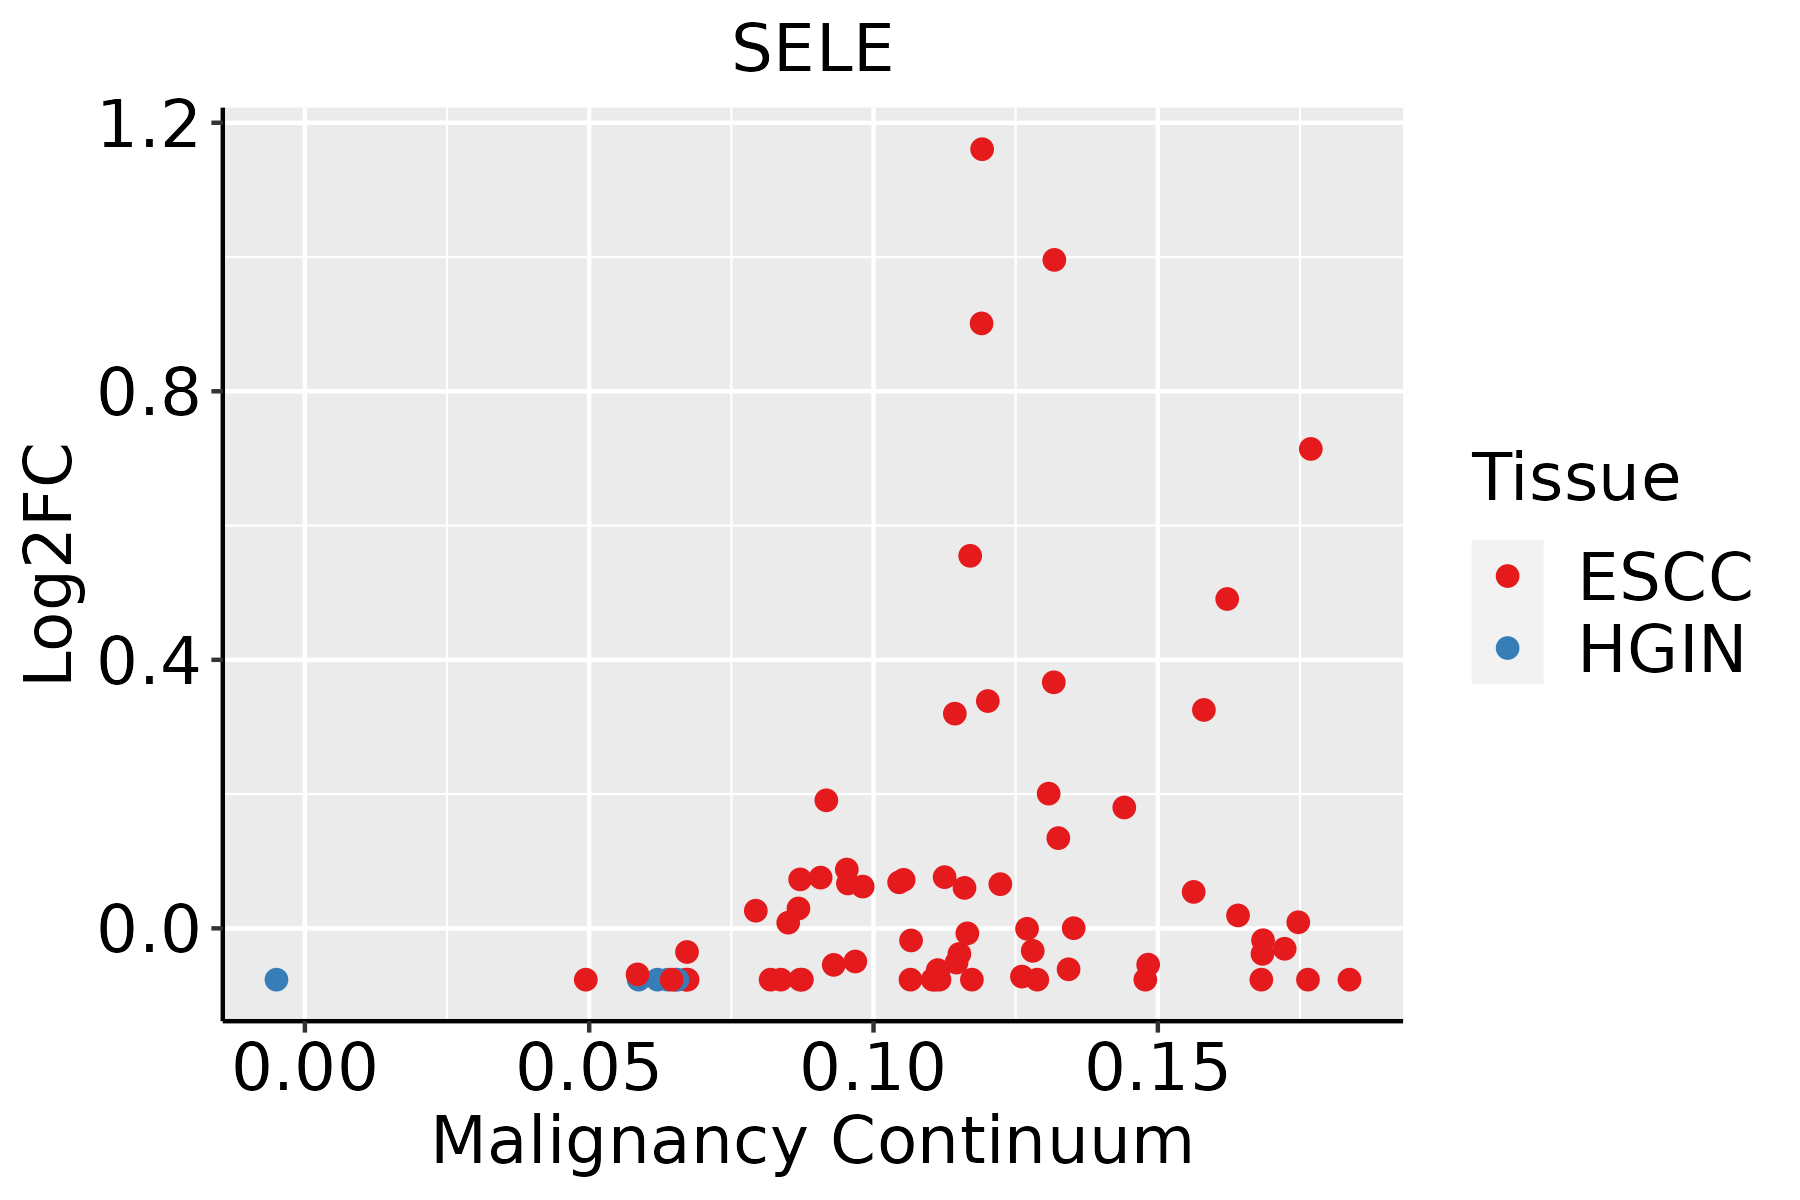 | ESCC: Esophageal squamous cell carcinoma |
| HGIN: High-grade intraepithelial neoplasias | ||
| LGIN: Low-grade intraepithelial neoplasias |
| ∗log2FC in expression of this searched gene in stem-like cells from each diseased tissue sample relative to stem-like cells in normal samples in each tissue plotted against the malignancy continuum. Samples are colored based on if they are from different disease stage. |
Top |
Malignant transformation related pathway analysis |
| Find out the enriched GO biological processes and KEGG pathways involved in transition from healthy to precancer to cancer |
| Tissue | Disease Stage | Enriched GO biological Processes |
| Colorectum | AD |  |
| Colorectum | SER |  |
| Colorectum | MSS |  |
| Colorectum | MSI-H |  |
| Colorectum | FAP |  |
| ∗Top 15 enriched GO BP terms are showed in the bar plot of each disease state in each tissue. Each row represents a significant GO biological process which is colored according to the -log10(p.adjust). |
| Page: 1 2 3 4 5 6 7 8 9 |
| GO ID | Tissue | Disease Stage | Description | Gene Ratio | Bg Ratio | pvalue | p.adjust | Count |
| GO:004211013 | Cervix | HSIL_HPV | T cell activation | 48/737 | 487/18723 | 5.12e-09 | 7.61e-07 | 48 |
| GO:190303712 | Cervix | HSIL_HPV | regulation of leukocyte cell-cell adhesion | 38/737 | 336/18723 | 5.31e-09 | 7.61e-07 | 38 |
| GO:190303912 | Cervix | HSIL_HPV | positive regulation of leukocyte cell-cell adhesion | 31/737 | 239/18723 | 5.53e-09 | 7.61e-07 | 31 |
| GO:002240913 | Cervix | HSIL_HPV | positive regulation of cell-cell adhesion | 34/737 | 284/18723 | 8.14e-09 | 1.03e-06 | 34 |
| GO:005086312 | Cervix | HSIL_HPV | regulation of T cell activation | 37/737 | 329/18723 | 9.84e-09 | 1.19e-06 | 37 |
| GO:005087012 | Cervix | HSIL_HPV | positive regulation of T cell activation | 28/737 | 216/18723 | 3.07e-08 | 2.59e-06 | 28 |
| GO:005090012 | Cervix | HSIL_HPV | leukocyte migration | 38/737 | 369/18723 | 6.67e-08 | 4.59e-06 | 38 |
| GO:000268512 | Cervix | HSIL_HPV | regulation of leukocyte migration | 25/737 | 210/18723 | 8.55e-07 | 4.16e-05 | 25 |
| GO:000181912 | Cervix | HSIL_HPV | positive regulation of cytokine production | 41/737 | 467/18723 | 1.48e-06 | 6.52e-05 | 41 |
| GO:005067012 | Cervix | HSIL_HPV | regulation of lymphocyte proliferation | 24/737 | 225/18723 | 9.64e-06 | 3.32e-04 | 24 |
| GO:004573013 | Cervix | HSIL_HPV | respiratory burst | 9/737 | 37/18723 | 9.97e-06 | 3.41e-04 | 9 |
| GO:003294412 | Cervix | HSIL_HPV | regulation of mononuclear cell proliferation | 24/737 | 227/18723 | 1.12e-05 | 3.72e-04 | 24 |
| GO:007066312 | Cervix | HSIL_HPV | regulation of leukocyte proliferation | 25/737 | 245/18723 | 1.37e-05 | 4.32e-04 | 25 |
| GO:000268712 | Cervix | HSIL_HPV | positive regulation of leukocyte migration | 17/737 | 135/18723 | 2.29e-05 | 6.89e-04 | 17 |
| GO:007167412 | Cervix | HSIL_HPV | mononuclear cell migration | 21/737 | 196/18723 | 3.20e-05 | 9.13e-04 | 21 |
| GO:007167712 | Cervix | HSIL_HPV | positive regulation of mononuclear cell migration | 11/737 | 65/18723 | 4.19e-05 | 1.10e-03 | 11 |
| GO:007167512 | Cervix | HSIL_HPV | regulation of mononuclear cell migration | 15/737 | 115/18723 | 4.52e-05 | 1.17e-03 | 15 |
| GO:004212912 | Cervix | HSIL_HPV | regulation of T cell proliferation | 19/737 | 171/18723 | 4.57e-05 | 1.18e-03 | 19 |
| GO:007066111 | Cervix | HSIL_HPV | leukocyte proliferation | 28/737 | 318/18723 | 6.39e-05 | 1.50e-03 | 28 |
| GO:005067112 | Cervix | HSIL_HPV | positive regulation of lymphocyte proliferation | 16/737 | 137/18723 | 9.89e-05 | 2.12e-03 | 16 |
| Page: 1 2 3 4 5 6 7 8 9 10 11 12 13 14 15 16 17 18 19 20 21 22 23 24 25 26 27 28 29 30 31 32 33 34 35 36 37 38 39 40 41 42 43 44 45 46 47 48 49 50 51 52 53 54 55 56 57 58 59 60 61 62 63 64 65 66 67 68 69 70 71 72 73 74 75 76 77 78 79 80 81 82 83 84 85 86 87 88 89 90 91 92 93 94 95 96 97 98 99 100 101 102 103 |
| Pathway ID | Tissue | Disease Stage | Description | Gene Ratio | Bg Ratio | pvalue | p.adjust | qvalue | Count |
| hsa05418211 | Esophagus | ESCC | Fluid shear stress and atherosclerosis | 109/4205 | 139/8465 | 2.00e-12 | 3.72e-11 | 1.90e-11 | 109 |
| hsa0466810 | Esophagus | ESCC | TNF signaling pathway | 89/4205 | 114/8465 | 3.36e-10 | 4.01e-09 | 2.06e-09 | 89 |
| hsa05417211 | Esophagus | ESCC | Lipid and atherosclerosis | 143/4205 | 215/8465 | 3.30e-07 | 2.45e-06 | 1.26e-06 | 143 |
| hsa0493310 | Esophagus | ESCC | AGE-RAGE signaling pathway in diabetic complications | 72/4205 | 100/8465 | 4.15e-06 | 2.28e-05 | 1.17e-05 | 72 |
| hsa05418310 | Esophagus | ESCC | Fluid shear stress and atherosclerosis | 109/4205 | 139/8465 | 2.00e-12 | 3.72e-11 | 1.90e-11 | 109 |
| hsa0466817 | Esophagus | ESCC | TNF signaling pathway | 89/4205 | 114/8465 | 3.36e-10 | 4.01e-09 | 2.06e-09 | 89 |
| hsa05417310 | Esophagus | ESCC | Lipid and atherosclerosis | 143/4205 | 215/8465 | 3.30e-07 | 2.45e-06 | 1.26e-06 | 143 |
| hsa0493317 | Esophagus | ESCC | AGE-RAGE signaling pathway in diabetic complications | 72/4205 | 100/8465 | 4.15e-06 | 2.28e-05 | 1.17e-05 | 72 |
| Page: 1 |
Top |
Cell-cell communication analysis |
| Identification of potential cell-cell interactions between two cell types and their ligand-receptor pairs for different disease states |
| Ligand | Receptor | LRpair | Pathway | Tissue | Disease Stage |
| SELE | CD44 | SELE_CD44 | SELE | Breast | ADJ |
| SELE | GLG1 | SELE_GLG1 | SELE | Breast | ADJ |
| SELPLG | SELE | SELPLG_SELE | SELPLG | Breast | ADJ |
| SELE | CD44 | SELE_CD44 | SELE | Breast | Healthy |
| SELE | GLG1 | SELE_GLG1 | SELE | Breast | Healthy |
| SELPLG | SELE | SELPLG_SELE | SELPLG | Breast | Healthy |
| SELE | CEACAM1 | SELE_CEACAM1 | CEACAM | Breast | Healthy |
| SELE | CD44 | SELE_CD44 | SELE | Breast | Precancer |
| SELE | CD44 | SELE_CD44 | SELE | Cervix | ADJ |
| SELE | GLG1 | SELE_GLG1 | SELE | Cervix | ADJ |
| SELPLG | SELE | SELPLG_SELE | SELPLG | Cervix | ADJ |
| SELE | CD44 | SELE_CD44 | SELE | Cervix | CC |
| SELE | GLG1 | SELE_GLG1 | SELE | Cervix | CC |
| SELE | CEACAM1 | SELE_CEACAM1 | CEACAM | Cervix | CC |
| SELPLG | SELE | SELPLG_SELE | SELPLG | Cervix | CC |
| SELE | CD44 | SELE_CD44 | SELE | Endometrium | ADJ |
| SELE | GLG1 | SELE_GLG1 | SELE | Endometrium | ADJ |
| SELPLG | SELE | SELPLG_SELE | SELPLG | Endometrium | ADJ |
| SELE | CD44 | SELE_CD44 | SELE | Endometrium | AEH |
| SELE | GLG1 | SELE_GLG1 | SELE | Endometrium | AEH |
| Page: 1 2 3 |
Top |
Single-cell gene regulatory network inference analysis |
| Find out the significant the regulons (TFs) and the target genes of each regulon across cell types for different disease states |
| TF | Cell Type | Tissue | Disease Stage | Target Gene | RSS | Regulon Activity |
| ∗The dot plots of a searched regulon are shown for all cell subpopulations in each disease state of each tissue based on the regulon specific score inferred using pySCENIC and by calculating the average expression. |
| Page: 1 |
Top |
Somatic mutation of malignant transformation related genes |
| Annotation of somatic variants for genes involved in malignant transformation |
| Hugo Symbol | Variant Class | Variant Classification | dbSNP RS | HGVSc | HGVSp | HGVSp Short | SWISSPROT | BIOTYPE | SIFT | PolyPhen | Tumor Sample Barcode | Tissue | Histology | Sex | Age | Stage | Therapy Types | Drugs | Outcome |
| SELE | SNV | Missense_Mutation | c.80N>G | p.Ser27Cys | p.S27C | P16581 | protein_coding | deleterious(0) | probably_damaging(1) | TCGA-AN-A0AL-01 | Breast | breast invasive carcinoma | Female | <65 | III/IV | Unknown | Unknown | SD | |
| SELE | SNV | Missense_Mutation | novel | c.464N>G | p.Val155Gly | p.V155G | P16581 | protein_coding | deleterious(0) | probably_damaging(0.984) | TCGA-AO-A128-01 | Breast | breast invasive carcinoma | Female | <65 | I/II | Chemotherapy | doxorubicin | SD |
| SELE | insertion | In_Frame_Ins | novel | c.465_466insACT | p.Val155_Glu156insThr | p.V155_E156insT | P16581 | protein_coding | TCGA-AO-A128-01 | Breast | breast invasive carcinoma | Female | <65 | I/II | Chemotherapy | doxorubicin | SD | ||
| SELE | SNV | Missense_Mutation | c.1681N>T | p.Leu561Phe | p.L561F | P16581 | protein_coding | deleterious(0.01) | probably_damaging(0.913) | TCGA-Q1-A5R3-01 | Cervix | cervical & endocervical cancer | Female | <65 | I/II | Chemotherapy | cisplatin | PR | |
| SELE | SNV | Missense_Mutation | c.113N>A | p.Ala38Asp | p.A38D | P16581 | protein_coding | tolerated(0.57) | benign(0.009) | TCGA-VS-A9UB-01 | Cervix | cervical & endocervical cancer | Female | <65 | I/II | Chemotherapy | cisplatin | CR | |
| SELE | SNV | Missense_Mutation | novel | c.518A>G | p.Lys173Arg | p.K173R | P16581 | protein_coding | tolerated(0.53) | benign(0.003) | TCGA-ZJ-AB0H-01 | Cervix | cervical & endocervical cancer | Female | <65 | III/IV | Unknown | Unknown | SD |
| SELE | SNV | Missense_Mutation | c.1408N>G | p.Ser470Ala | p.S470A | P16581 | protein_coding | tolerated(0.13) | benign(0.217) | TCGA-AA-3811-01 | Colorectum | colon adenocarcinoma | Female | >=65 | III/IV | Unknown | Unknown | PD | |
| SELE | SNV | Missense_Mutation | c.113N>T | p.Ala38Val | p.A38V | P16581 | protein_coding | tolerated(0.25) | benign(0.069) | TCGA-AZ-4313-01 | Colorectum | colon adenocarcinoma | Female | <65 | I/II | Unknown | Unknown | SD | |
| SELE | SNV | Missense_Mutation | novel | c.544G>A | p.Ala182Thr | p.A182T | P16581 | protein_coding | tolerated(0.24) | possibly_damaging(0.543) | TCGA-AZ-4315-01 | Colorectum | colon adenocarcinoma | Male | <65 | I/II | Unknown | Unknown | SD |
| SELE | SNV | Missense_Mutation | c.1758G>T | p.Lys586Asn | p.K586N | P16581 | protein_coding | deleterious(0) | benign(0.42) | TCGA-AZ-4614-01 | Colorectum | colon adenocarcinoma | Female | >=65 | I/II | Unknown | Unknown | PD |
| Page: 1 2 3 4 5 6 7 8 |
Top |
Related drugs of malignant transformation related genes |
| Identification of chemicals and drugs interact with genes involved in malignant transfromation |
| (DGIdb 4.0) |
| Entrez ID | Symbol | Category | Interaction Types | Drug Claim Name | Drug Name | PMIDs |
| 6401 | SELE | DRUGGABLE GENOME, EXTERNAL SIDE OF PLASMA MEMBRANE | leucovorin | LEUCOVORIN | 24980946 | |
| 6401 | SELE | DRUGGABLE GENOME, EXTERNAL SIDE OF PLASMA MEMBRANE | BIMOSIAMOSE | BIMOSIAMOSE | ||
| 6401 | SELE | DRUGGABLE GENOME, EXTERNAL SIDE OF PLASMA MEMBRANE | fluorouracil | FLUOROURACIL | 24980946 | |
| 6401 | SELE | DRUGGABLE GENOME, EXTERNAL SIDE OF PLASMA MEMBRANE | capecitabine | CAPECITABINE | 24980946 | |
| 6401 | SELE | DRUGGABLE GENOME, EXTERNAL SIDE OF PLASMA MEMBRANE | inhibitor | CHEMBL1215923 | BIMOSIAMOSE | |
| 6401 | SELE | DRUGGABLE GENOME, EXTERNAL SIDE OF PLASMA MEMBRANE | Bimosiamose | BIMOSIAMOSE | ||
| 6401 | SELE | DRUGGABLE GENOME, EXTERNAL SIDE OF PLASMA MEMBRANE | GMI-1359 | |||
| 6401 | SELE | DRUGGABLE GENOME, EXTERNAL SIDE OF PLASMA MEMBRANE | GMI-1070 | RIVIPANSEL | 20508165 | |
| 6401 | SELE | DRUGGABLE GENOME, EXTERNAL SIDE OF PLASMA MEMBRANE | antagonist | CHEMBL3707446 | RIVIPANSEL | |
| 6401 | SELE | DRUGGABLE GENOME, EXTERNAL SIDE OF PLASMA MEMBRANE | SIALYL LEWIS X | SIALYL LEWIS X |
| Page: 1 2 |

Copyright 2023-Present -The University of Texas Health Science Center at Houston |