
|
|||||
|
 | |
| |
| |
| |
| |
| |
|
Gene: SCARB2 |
Gene summary for SCARB2 |
| Gene information | Species | Human | Gene symbol | SCARB2 | Gene ID | 950 |
| Gene name | scavenger receptor class B member 2 | |
| Gene Alias | AMRF | |
| Cytomap | 4q21.1 | |
| Gene Type | protein-coding | GO ID | GO:0003008 | UniProtAcc | Q14108 |
Top |
Malignant transformation analysis |
| Identification of the aberrant gene expression in precancerous and cancerous lesions by comparing the gene expression of stem-like cells in diseased tissues with normal stem cells |
| Entrez ID | Symbol | Replicates | Species | Organ | Tissue | Adj P-value | Log2FC | Malignancy |
| 950 | SCARB2 | HTA11_3410_2000001011 | Human | Colorectum | AD | 2.57e-04 | -1.95e-01 | 0.0155 |
| 950 | SCARB2 | HTA11_347_2000001011 | Human | Colorectum | AD | 7.58e-11 | 6.27e-01 | -0.1954 |
| 950 | SCARB2 | A015-C-203 | Human | Colorectum | FAP | 4.38e-12 | -2.47e-01 | -0.1294 |
| 950 | SCARB2 | A015-C-204 | Human | Colorectum | FAP | 1.01e-03 | -3.04e-01 | -0.0228 |
| 950 | SCARB2 | A002-C-201 | Human | Colorectum | FAP | 8.34e-08 | -2.43e-01 | 0.0324 |
| 950 | SCARB2 | A001-C-119 | Human | Colorectum | FAP | 9.70e-07 | -3.78e-01 | -0.1557 |
| 950 | SCARB2 | A001-C-108 | Human | Colorectum | FAP | 1.77e-05 | -2.05e-01 | -0.0272 |
| 950 | SCARB2 | A002-C-205 | Human | Colorectum | FAP | 1.64e-14 | -3.71e-01 | -0.1236 |
| 950 | SCARB2 | A015-C-005 | Human | Colorectum | FAP | 1.09e-02 | -2.55e-01 | -0.0336 |
| 950 | SCARB2 | A015-C-006 | Human | Colorectum | FAP | 4.71e-09 | -3.33e-01 | -0.0994 |
| 950 | SCARB2 | A015-C-106 | Human | Colorectum | FAP | 4.41e-04 | -2.15e-01 | -0.0511 |
| 950 | SCARB2 | A002-C-114 | Human | Colorectum | FAP | 2.12e-11 | -3.36e-01 | -0.1561 |
| 950 | SCARB2 | A015-C-104 | Human | Colorectum | FAP | 6.89e-15 | -3.07e-01 | -0.1899 |
| 950 | SCARB2 | A001-C-014 | Human | Colorectum | FAP | 5.96e-07 | -1.78e-01 | 0.0135 |
| 950 | SCARB2 | A002-C-016 | Human | Colorectum | FAP | 4.10e-09 | -2.47e-01 | 0.0521 |
| 950 | SCARB2 | A015-C-002 | Human | Colorectum | FAP | 5.07e-07 | -3.73e-01 | -0.0763 |
| 950 | SCARB2 | A001-C-203 | Human | Colorectum | FAP | 1.29e-04 | -1.84e-01 | -0.0481 |
| 950 | SCARB2 | A002-C-116 | Human | Colorectum | FAP | 1.59e-17 | -2.34e-01 | -0.0452 |
| 950 | SCARB2 | A014-C-008 | Human | Colorectum | FAP | 2.97e-06 | -4.57e-02 | -0.191 |
| 950 | SCARB2 | A018-E-020 | Human | Colorectum | FAP | 1.03e-10 | -2.24e-01 | -0.2034 |
| Page: 1 2 3 4 5 6 7 8 9 |
| Tissue | Expression Dynamics | Abbreviation |
| Colorectum (GSE201348) |  | FAP: Familial adenomatous polyposis |
| CRC: Colorectal cancer | ||
| Colorectum (HTA11) |  | AD: Adenomas |
| SER: Sessile serrated lesions | ||
| MSI-H: Microsatellite-high colorectal cancer | ||
| MSS: Microsatellite stable colorectal cancer | ||
| Esophagus | 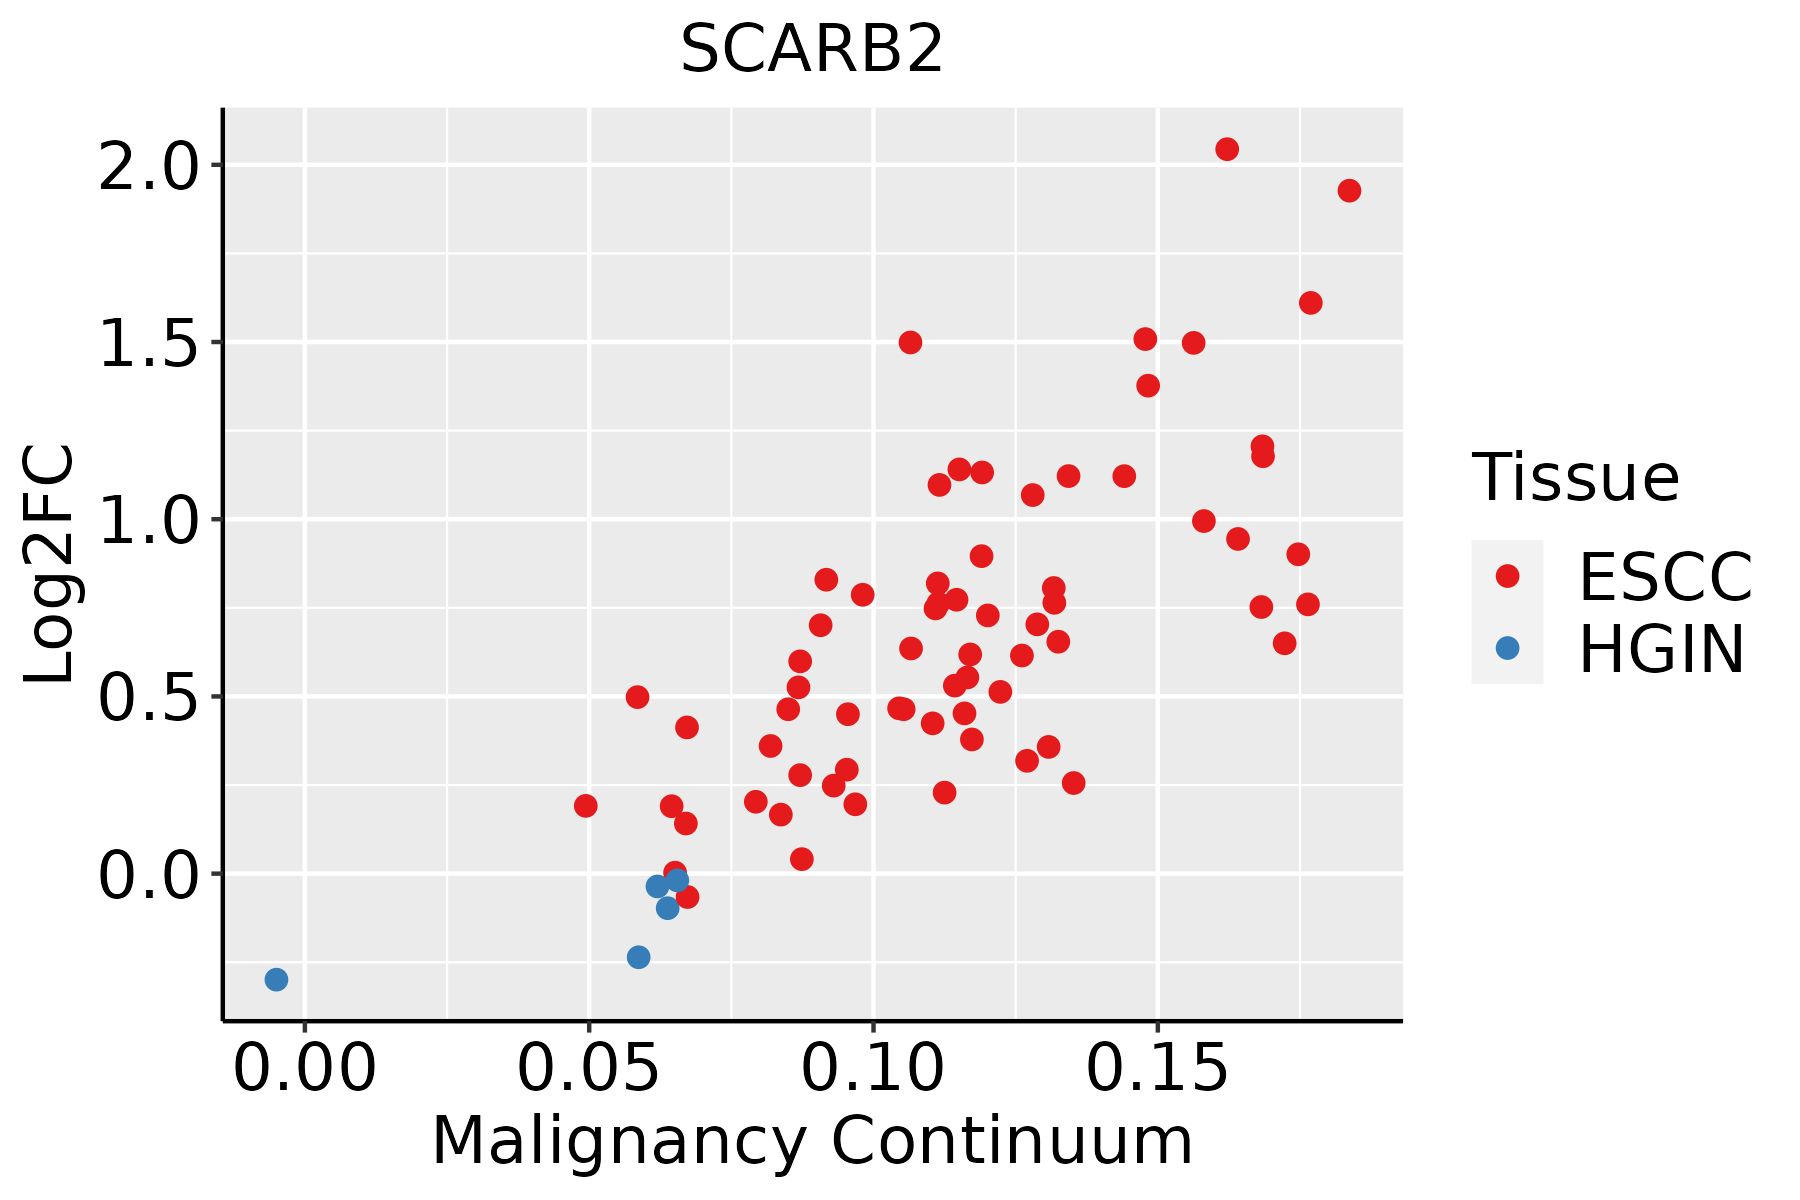 | ESCC: Esophageal squamous cell carcinoma |
| HGIN: High-grade intraepithelial neoplasias | ||
| LGIN: Low-grade intraepithelial neoplasias | ||
| Liver | 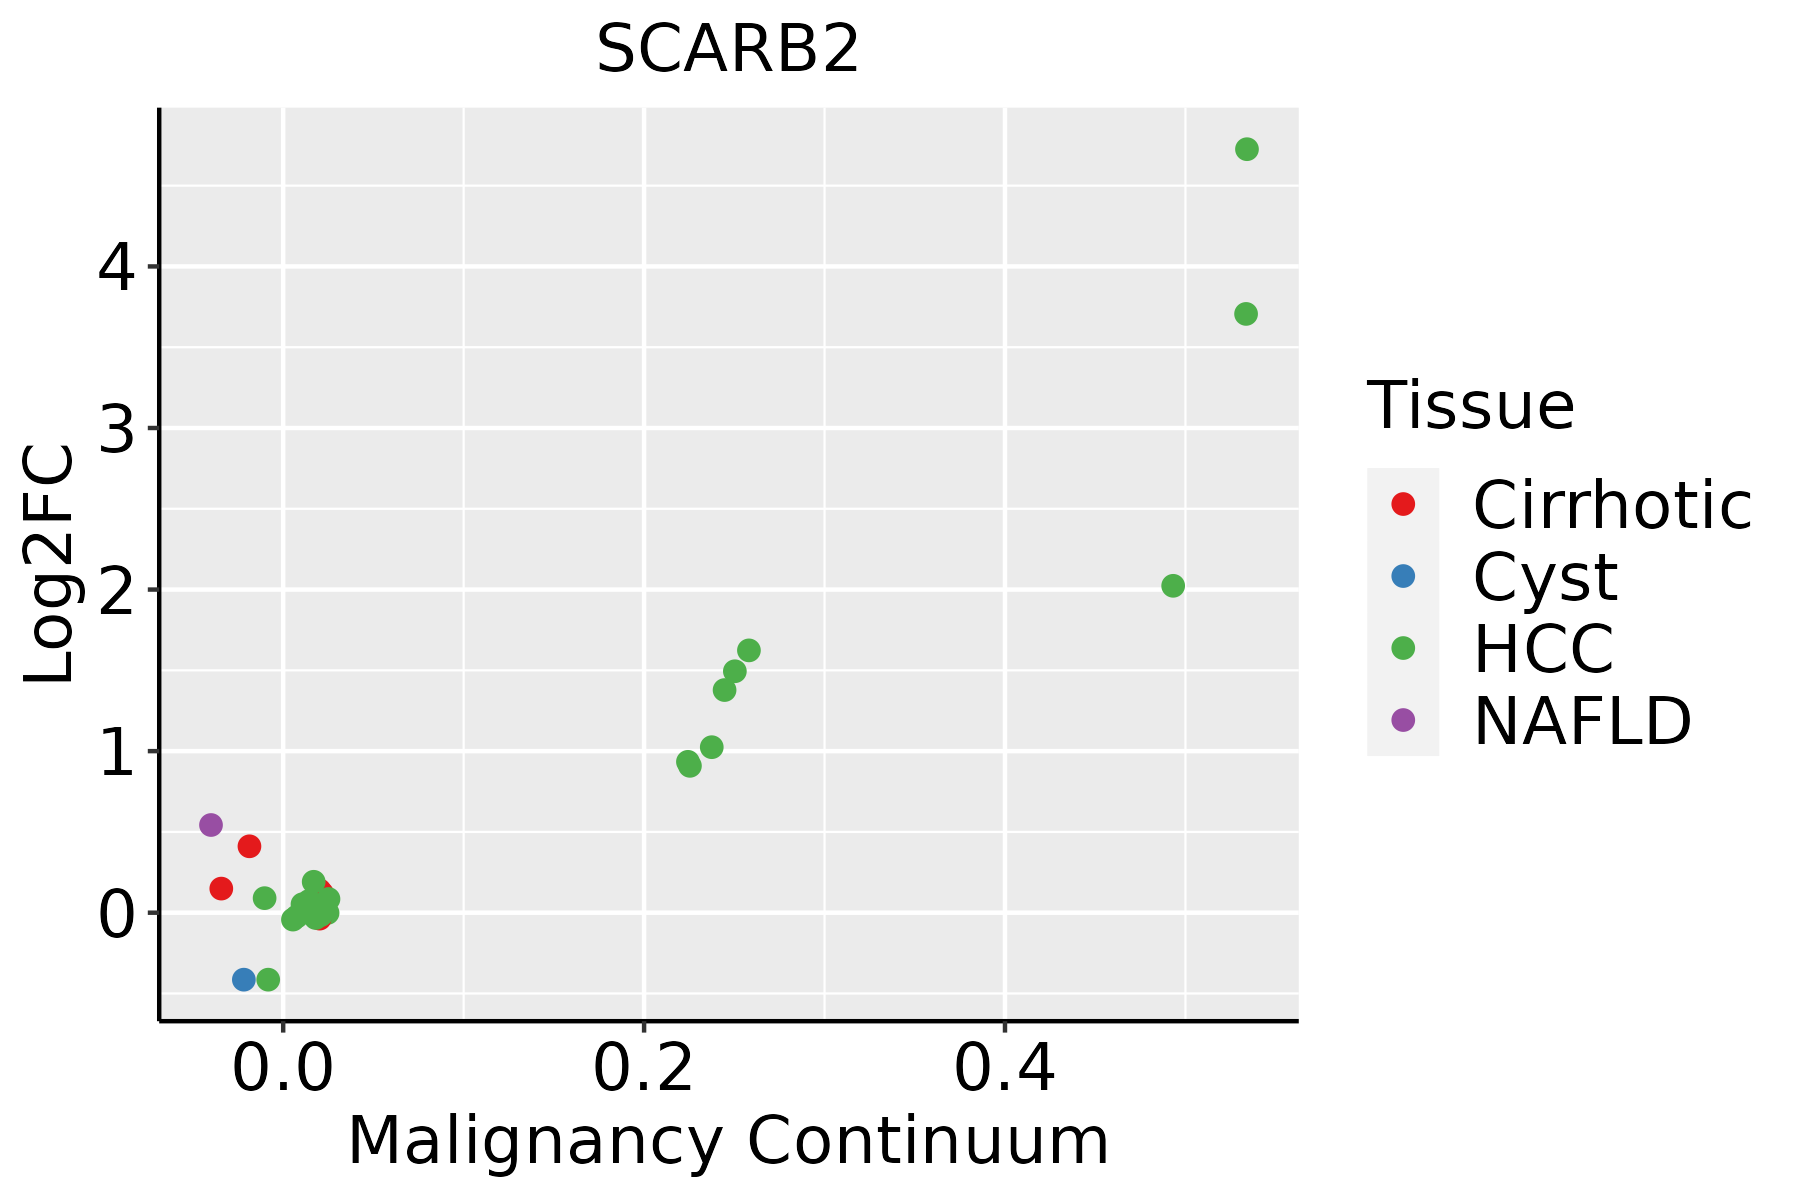 | HCC: Hepatocellular carcinoma |
| NAFLD: Non-alcoholic fatty liver disease | ||
| Oral Cavity | 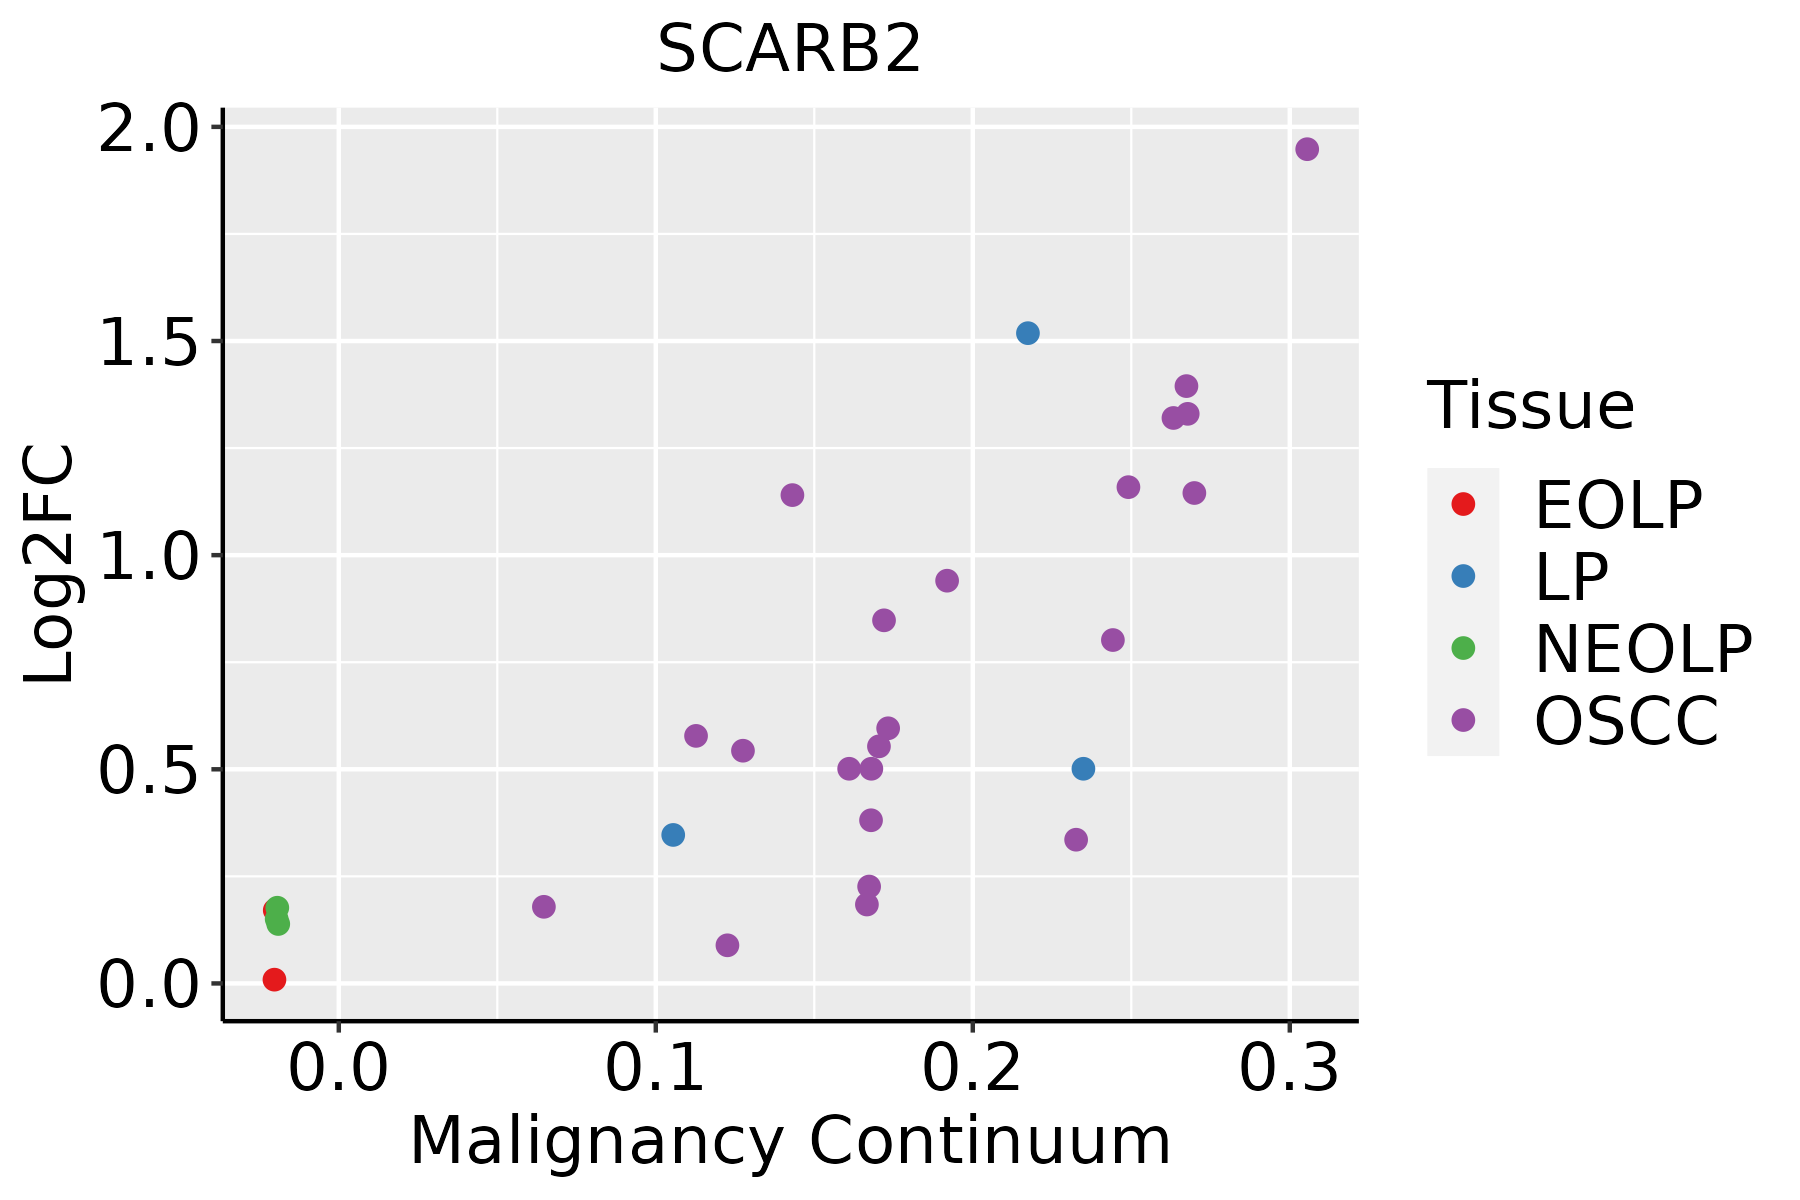 | EOLP: Erosive Oral lichen planus |
| LP: leukoplakia | ||
| NEOLP: Non-erosive oral lichen planus | ||
| OSCC: Oral squamous cell carcinoma | ||
| Prostate |  | BPH: Benign Prostatic Hyperplasia |
| Skin |  | AK: Actinic keratosis |
| cSCC: Cutaneous squamous cell carcinoma | ||
| SCCIS:squamous cell carcinoma in situ | ||
| Thyroid | 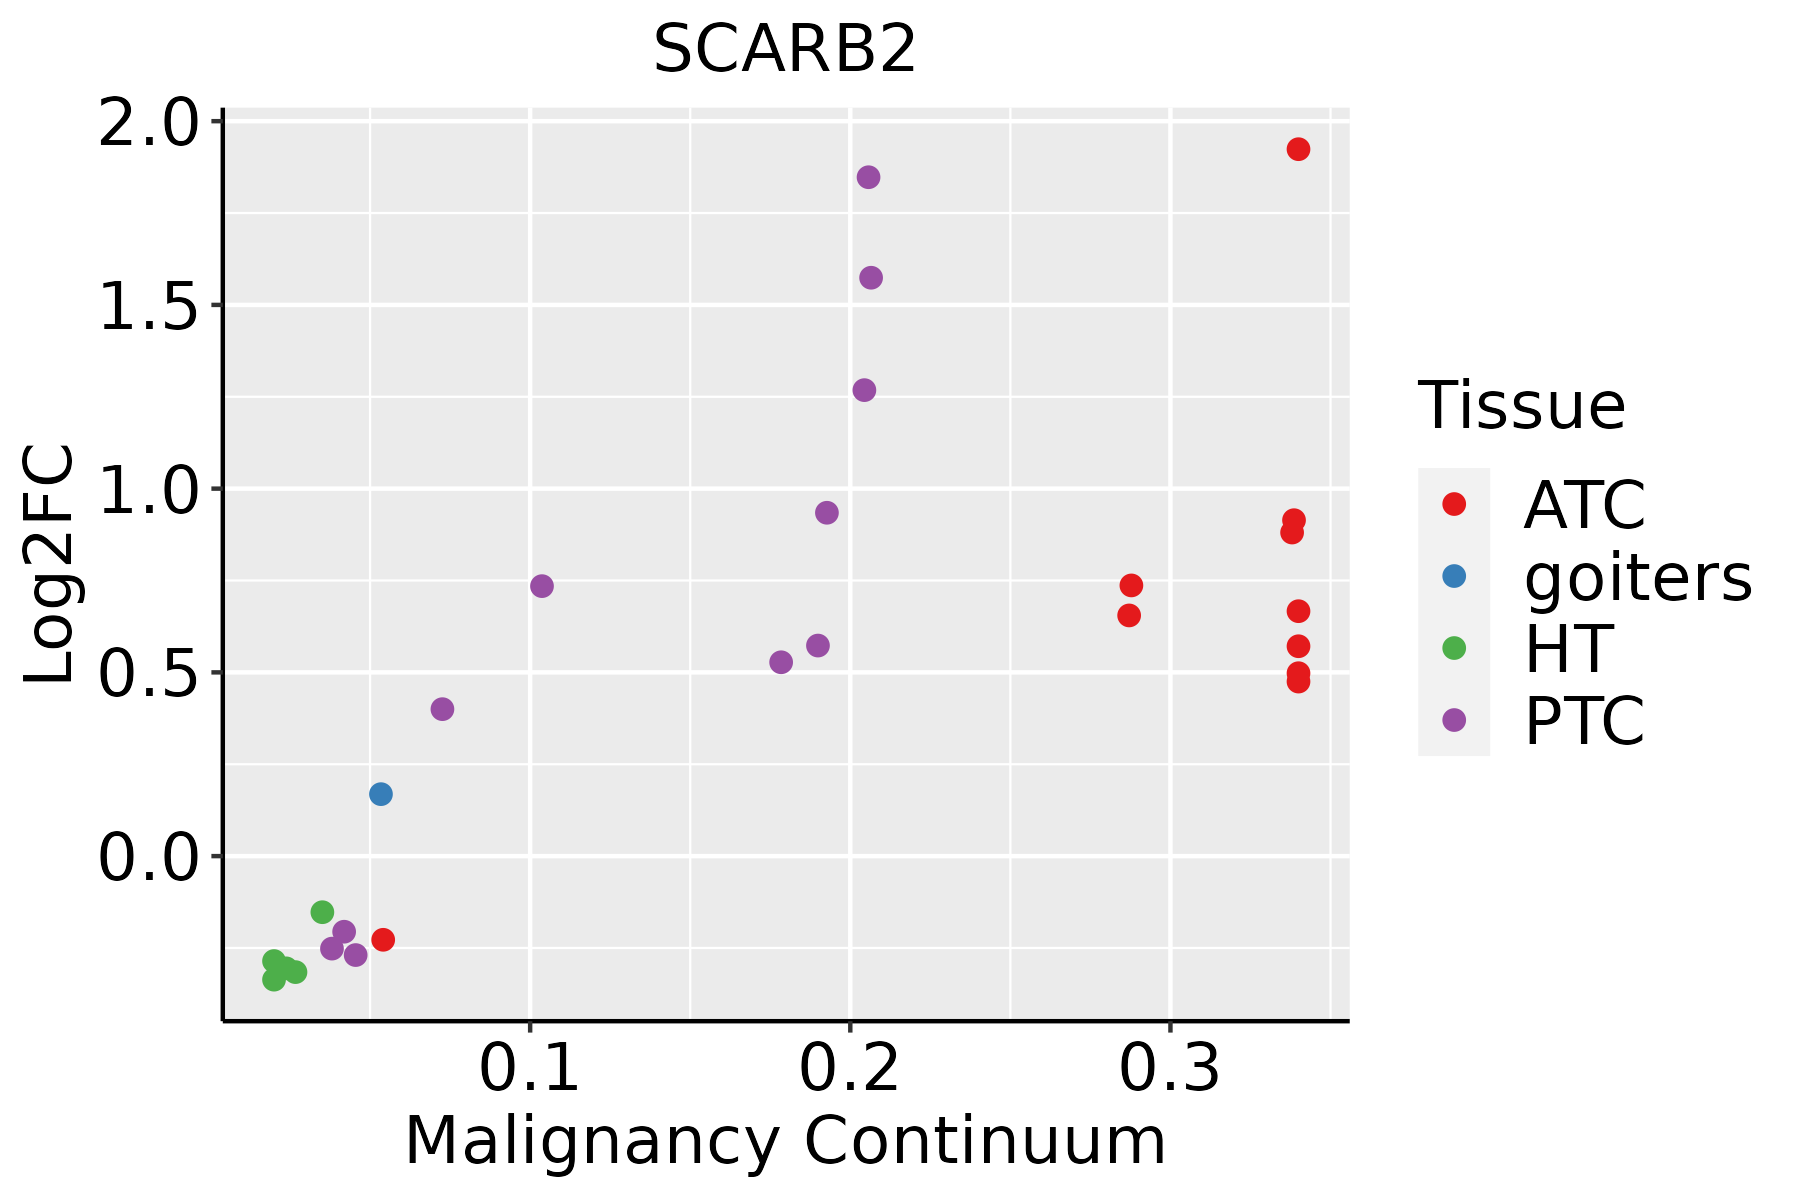 | ATC: Anaplastic thyroid cancer |
| HT: Hashimoto's thyroiditis | ||
| PTC: Papillary thyroid cancer |
| ∗log2FC in expression of this searched gene in stem-like cells from each diseased tissue sample relative to stem-like cells in normal samples in each tissue plotted against the malignancy continuum. Samples are colored based on if they are from different disease stage. |
Top |
Malignant transformation related pathway analysis |
| Find out the enriched GO biological processes and KEGG pathways involved in transition from healthy to precancer to cancer |
| Tissue | Disease Stage | Enriched GO biological Processes |
| Colorectum | AD |  |
| Colorectum | SER |  |
| Colorectum | MSS |  |
| Colorectum | MSI-H |  |
| Colorectum | FAP |  |
| ∗Top 15 enriched GO BP terms are showed in the bar plot of each disease state in each tissue. Each row represents a significant GO biological process which is colored according to the -log10(p.adjust). |
| Page: 1 2 3 4 5 6 7 8 9 |
| GO ID | Tissue | Disease Stage | Description | Gene Ratio | Bg Ratio | pvalue | p.adjust | Count |
| GO:001603234 | Thyroid | ATC | viral process | 241/6293 | 415/18723 | 5.50e-25 | 2.04e-22 | 241 |
| GO:000660533 | Thyroid | ATC | protein targeting | 180/6293 | 314/18723 | 3.54e-18 | 4.39e-16 | 180 |
| GO:001605023 | Thyroid | ATC | vesicle organization | 166/6293 | 300/18723 | 6.14e-15 | 3.92e-13 | 166 |
| GO:001905835 | Thyroid | ATC | viral life cycle | 173/6293 | 317/18723 | 9.22e-15 | 5.50e-13 | 173 |
| GO:003134623 | Thyroid | ATC | positive regulation of cell projection organization | 186/6293 | 353/18723 | 7.99e-14 | 4.23e-12 | 186 |
| GO:004440334 | Thyroid | ATC | biological process involved in symbiotic interaction | 153/6293 | 290/18723 | 1.12e-11 | 4.12e-10 | 153 |
| GO:005170134 | Thyroid | ATC | biological process involved in interaction with host | 112/6293 | 203/18723 | 1.93e-10 | 5.76e-09 | 112 |
| GO:001097523 | Thyroid | ATC | regulation of neuron projection development | 212/6293 | 445/18723 | 4.16e-10 | 1.14e-08 | 212 |
| GO:000703322 | Thyroid | ATC | vacuole organization | 100/6293 | 180/18723 | 1.07e-09 | 2.71e-08 | 100 |
| GO:000703423 | Thyroid | ATC | vacuolar transport | 89/6293 | 157/18723 | 2.26e-09 | 5.40e-08 | 89 |
| GO:005212633 | Thyroid | ATC | movement in host environment | 94/6293 | 175/18723 | 3.20e-08 | 6.00e-07 | 94 |
| GO:000689826 | Thyroid | ATC | receptor-mediated endocytosis | 118/6293 | 244/18723 | 1.17e-06 | 1.50e-05 | 118 |
| GO:000704116 | Thyroid | ATC | lysosomal transport | 63/6293 | 114/18723 | 1.58e-06 | 1.93e-05 | 63 |
| GO:000703216 | Thyroid | ATC | endosome organization | 48/6293 | 82/18723 | 3.13e-06 | 3.56e-05 | 48 |
| GO:001097614 | Thyroid | ATC | positive regulation of neuron projection development | 82/6293 | 163/18723 | 7.43e-06 | 7.61e-05 | 82 |
| GO:004440933 | Thyroid | ATC | entry into host | 76/6293 | 151/18723 | 1.54e-05 | 1.43e-04 | 76 |
| GO:004671833 | Thyroid | ATC | viral entry into host cell | 72/6293 | 144/18723 | 3.38e-05 | 2.80e-04 | 72 |
| GO:007266523 | Thyroid | ATC | protein localization to vacuole | 38/6293 | 67/18723 | 8.48e-05 | 6.33e-04 | 38 |
| GO:007266614 | Thyroid | ATC | establishment of protein localization to vacuole | 29/6293 | 49/18723 | 2.11e-04 | 1.39e-03 | 29 |
| GO:000662315 | Thyroid | ATC | protein targeting to vacuole | 23/6293 | 37/18723 | 3.49e-04 | 2.16e-03 | 23 |
| Page: 1 2 3 4 5 6 7 8 9 10 11 12 13 14 15 16 17 18 19 20 21 22 |
| Pathway ID | Tissue | Disease Stage | Description | Gene Ratio | Bg Ratio | pvalue | p.adjust | qvalue | Count |
| hsa0414222 | Esophagus | ESCC | Lysosome | 102/4205 | 132/8465 | 5.11e-11 | 7.13e-10 | 3.65e-10 | 102 |
| hsa0414232 | Esophagus | ESCC | Lysosome | 102/4205 | 132/8465 | 5.11e-11 | 7.13e-10 | 3.65e-10 | 102 |
| hsa041424 | Liver | Cirrhotic | Lysosome | 68/2530 | 132/8465 | 1.34e-07 | 1.97e-06 | 1.21e-06 | 68 |
| hsa0414211 | Liver | Cirrhotic | Lysosome | 68/2530 | 132/8465 | 1.34e-07 | 1.97e-06 | 1.21e-06 | 68 |
| hsa041422 | Liver | HCC | Lysosome | 100/4020 | 132/8465 | 2.32e-11 | 4.31e-10 | 2.40e-10 | 100 |
| hsa041423 | Liver | HCC | Lysosome | 100/4020 | 132/8465 | 2.32e-11 | 4.31e-10 | 2.40e-10 | 100 |
| hsa041425 | Oral cavity | OSCC | Lysosome | 87/3704 | 132/8465 | 1.97e-07 | 1.35e-06 | 6.86e-07 | 87 |
| hsa0414212 | Oral cavity | OSCC | Lysosome | 87/3704 | 132/8465 | 1.97e-07 | 1.35e-06 | 6.86e-07 | 87 |
| hsa0414221 | Oral cavity | LP | Lysosome | 67/2418 | 132/8465 | 5.13e-08 | 7.77e-07 | 5.01e-07 | 67 |
| hsa0414231 | Oral cavity | LP | Lysosome | 67/2418 | 132/8465 | 5.13e-08 | 7.77e-07 | 5.01e-07 | 67 |
| Page: 1 |
Top |
Cell-cell communication analysis |
| Identification of potential cell-cell interactions between two cell types and their ligand-receptor pairs for different disease states |
| Ligand | Receptor | LRpair | Pathway | Tissue | Disease Stage |
| Page: 1 |
Top |
Single-cell gene regulatory network inference analysis |
| Find out the significant the regulons (TFs) and the target genes of each regulon across cell types for different disease states |
| TF | Cell Type | Tissue | Disease Stage | Target Gene | RSS | Regulon Activity |
| ∗The dot plots of a searched regulon are shown for all cell subpopulations in each disease state of each tissue based on the regulon specific score inferred using pySCENIC and by calculating the average expression. |
| Page: 1 |
Top |
Somatic mutation of malignant transformation related genes |
| Annotation of somatic variants for genes involved in malignant transformation |
| Hugo Symbol | Variant Class | Variant Classification | dbSNP RS | HGVSc | HGVSp | HGVSp Short | SWISSPROT | BIOTYPE | SIFT | PolyPhen | Tumor Sample Barcode | Tissue | Histology | Sex | Age | Stage | Therapy Types | Drugs | Outcome |
| SCARB2 | SNV | Missense_Mutation | novel | c.1222G>A | p.Val408Met | p.V408M | Q14108 | protein_coding | deleterious(0) | probably_damaging(0.996) | TCGA-A7-A5ZX-01 | Breast | breast invasive carcinoma | Female | <65 | III/IV | Chemotherapy | doxorubicin | CR |
| SCARB2 | SNV | Missense_Mutation | rs751711805 | c.523G>A | p.Glu175Lys | p.E175K | Q14108 | protein_coding | deleterious(0) | probably_damaging(0.951) | TCGA-AN-A046-01 | Breast | breast invasive carcinoma | Female | >=65 | I/II | Unknown | Unknown | SD |
| SCARB2 | SNV | Missense_Mutation | c.511C>G | p.His171Asp | p.H171D | Q14108 | protein_coding | deleterious(0) | possibly_damaging(0.702) | TCGA-C8-A1HM-01 | Breast | breast invasive carcinoma | Female | >=65 | I/II | Chemotherapy | doxorubicin | CR | |
| SCARB2 | SNV | Missense_Mutation | c.1173N>T | p.Lys391Asn | p.K391N | Q14108 | protein_coding | deleterious(0.01) | benign(0.14) | TCGA-D8-A1JG-01 | Breast | breast invasive carcinoma | Female | <65 | I/II | Chemotherapy | doxorubicin | SD | |
| SCARB2 | insertion | Nonsense_Mutation | novel | c.509_510insAAAACTATTTTCTTCATCTTGA | p.His171LysfsTer7 | p.H171Kfs*7 | Q14108 | protein_coding | TCGA-A2-A04Y-01 | Breast | breast invasive carcinoma | Female | <65 | I/II | Chemotherapy | cytoxan | SD | ||
| SCARB2 | insertion | In_Frame_Ins | novel | c.838_839insACAAATTTATTA | p.Ile279_Thr280insAsnLysPheIle | p.I279_T280insNKFI | Q14108 | protein_coding | TCGA-A8-A08J-01 | Breast | breast invasive carcinoma | Female | <65 | III/IV | Unknown | Unknown | PD | ||
| SCARB2 | SNV | Missense_Mutation | rs760128942 | c.469G>A | p.Glu157Lys | p.E157K | Q14108 | protein_coding | tolerated(0.36) | benign(0.345) | TCGA-2W-A8YY-01 | Cervix | cervical & endocervical cancer | Female | <65 | I/II | Chemotherapy | cisplatin | CR |
| SCARB2 | SNV | Missense_Mutation | novel | c.1121G>T | p.Gly374Val | p.G374V | Q14108 | protein_coding | deleterious(0) | probably_damaging(0.999) | TCGA-EA-A3HU-01 | Cervix | cervical & endocervical cancer | Female | <65 | I/II | Unknown | Unknown | SD |
| SCARB2 | SNV | Missense_Mutation | rs375205937 | c.628N>A | p.Asp210Asn | p.D210N | Q14108 | protein_coding | deleterious(0.04) | possibly_damaging(0.796) | TCGA-EX-A1H6-01 | Cervix | cervical & endocervical cancer | Female | <65 | I/II | Unknown | Unknown | SD |
| SCARB2 | SNV | Missense_Mutation | c.860N>C | p.Val287Ala | p.V287A | Q14108 | protein_coding | deleterious(0) | possibly_damaging(0.626) | TCGA-FU-A3HZ-01 | Cervix | cervical & endocervical cancer | Female | <65 | I/II | Chemotherapy | cisplatin | CR |
| Page: 1 2 3 4 5 6 7 |
Top |
Related drugs of malignant transformation related genes |
| Identification of chemicals and drugs interact with genes involved in malignant transfromation |
| (DGIdb 4.0) |
| Entrez ID | Symbol | Category | Interaction Types | Drug Claim Name | Drug Name | PMIDs |
| Page: 1 |

Copyright 2023-Present -The University of Texas Health Science Center at Houston |