
|
|||||
|
 | |
| |
| |
| |
| |
| |
|
Gene: RAB3GAP1 |
Gene summary for RAB3GAP1 |
| Gene information | Species | Human | Gene symbol | RAB3GAP1 | Gene ID | 22930 |
| Gene name | RAB3 GTPase activating protein catalytic subunit 1 | |
| Gene Alias | MARTS2 | |
| Cytomap | 2q21.3 | |
| Gene Type | protein-coding | GO ID | GO:0000045 | UniProtAcc | Q15042 |
Top |
Malignant transformation analysis |
| Identification of the aberrant gene expression in precancerous and cancerous lesions by comparing the gene expression of stem-like cells in diseased tissues with normal stem cells |
| Entrez ID | Symbol | Replicates | Species | Organ | Tissue | Adj P-value | Log2FC | Malignancy |
| 22930 | RAB3GAP1 | CCI_1 | Human | Cervix | CC | 2.79e-06 | 7.12e-01 | 0.528 |
| 22930 | RAB3GAP1 | CCI_2 | Human | Cervix | CC | 9.04e-06 | 7.41e-01 | 0.5249 |
| 22930 | RAB3GAP1 | CCI_3 | Human | Cervix | CC | 5.48e-10 | 6.59e-01 | 0.516 |
| 22930 | RAB3GAP1 | HTA11_3410_2000001011 | Human | Colorectum | AD | 1.97e-15 | -5.46e-01 | 0.0155 |
| 22930 | RAB3GAP1 | HTA11_3361_2000001011 | Human | Colorectum | AD | 2.99e-02 | -3.50e-01 | -0.1207 |
| 22930 | RAB3GAP1 | HTA11_866_3004761011 | Human | Colorectum | AD | 3.24e-06 | -4.20e-01 | 0.096 |
| 22930 | RAB3GAP1 | HTA11_7696_3000711011 | Human | Colorectum | AD | 1.88e-10 | -4.21e-01 | 0.0674 |
| 22930 | RAB3GAP1 | HTA11_99999974143_84620 | Human | Colorectum | MSS | 4.73e-07 | -3.92e-01 | 0.3005 |
| 22930 | RAB3GAP1 | F007 | Human | Colorectum | FAP | 2.62e-04 | -2.72e-01 | 0.1176 |
| 22930 | RAB3GAP1 | A001-C-207 | Human | Colorectum | FAP | 7.72e-04 | -2.20e-01 | 0.1278 |
| 22930 | RAB3GAP1 | A015-C-203 | Human | Colorectum | FAP | 1.88e-25 | -4.37e-01 | -0.1294 |
| 22930 | RAB3GAP1 | A015-C-204 | Human | Colorectum | FAP | 3.77e-08 | -3.29e-01 | -0.0228 |
| 22930 | RAB3GAP1 | A014-C-040 | Human | Colorectum | FAP | 7.64e-05 | -3.80e-01 | -0.1184 |
| 22930 | RAB3GAP1 | A002-C-201 | Human | Colorectum | FAP | 8.20e-20 | -4.47e-01 | 0.0324 |
| 22930 | RAB3GAP1 | A002-C-203 | Human | Colorectum | FAP | 1.46e-02 | -2.17e-01 | 0.2786 |
| 22930 | RAB3GAP1 | A001-C-119 | Human | Colorectum | FAP | 2.73e-09 | -4.28e-01 | -0.1557 |
| 22930 | RAB3GAP1 | A001-C-108 | Human | Colorectum | FAP | 4.56e-20 | -3.23e-01 | -0.0272 |
| 22930 | RAB3GAP1 | A002-C-205 | Human | Colorectum | FAP | 1.23e-26 | -4.64e-01 | -0.1236 |
| 22930 | RAB3GAP1 | A001-C-104 | Human | Colorectum | FAP | 1.89e-03 | -2.67e-01 | 0.0184 |
| 22930 | RAB3GAP1 | A015-C-005 | Human | Colorectum | FAP | 1.32e-03 | -2.05e-01 | -0.0336 |
| Page: 1 2 3 4 5 6 7 8 9 |
| Tissue | Expression Dynamics | Abbreviation |
| Cervix | 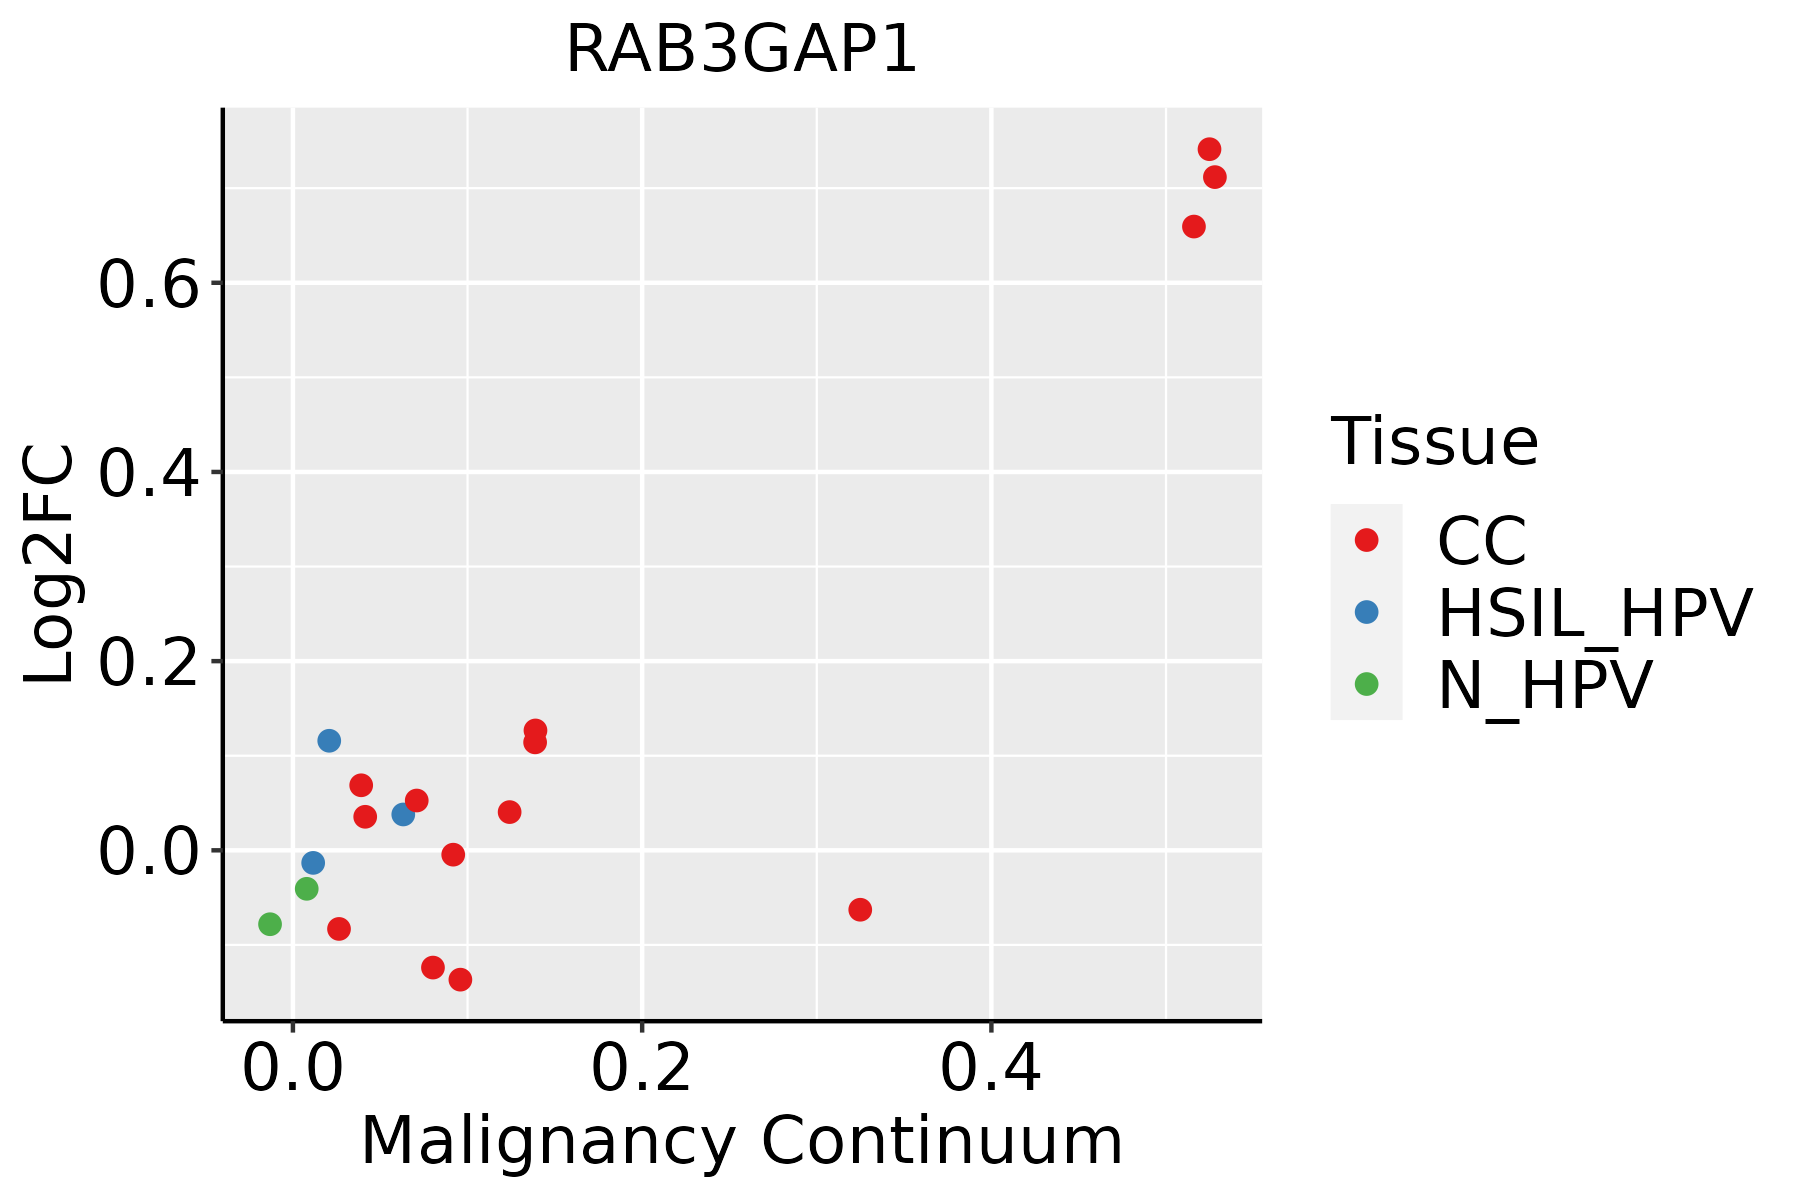 | CC: Cervix cancer |
| HSIL_HPV: HPV-infected high-grade squamous intraepithelial lesions | ||
| N_HPV: HPV-infected normal cervix | ||
| Colorectum (GSE201348) | 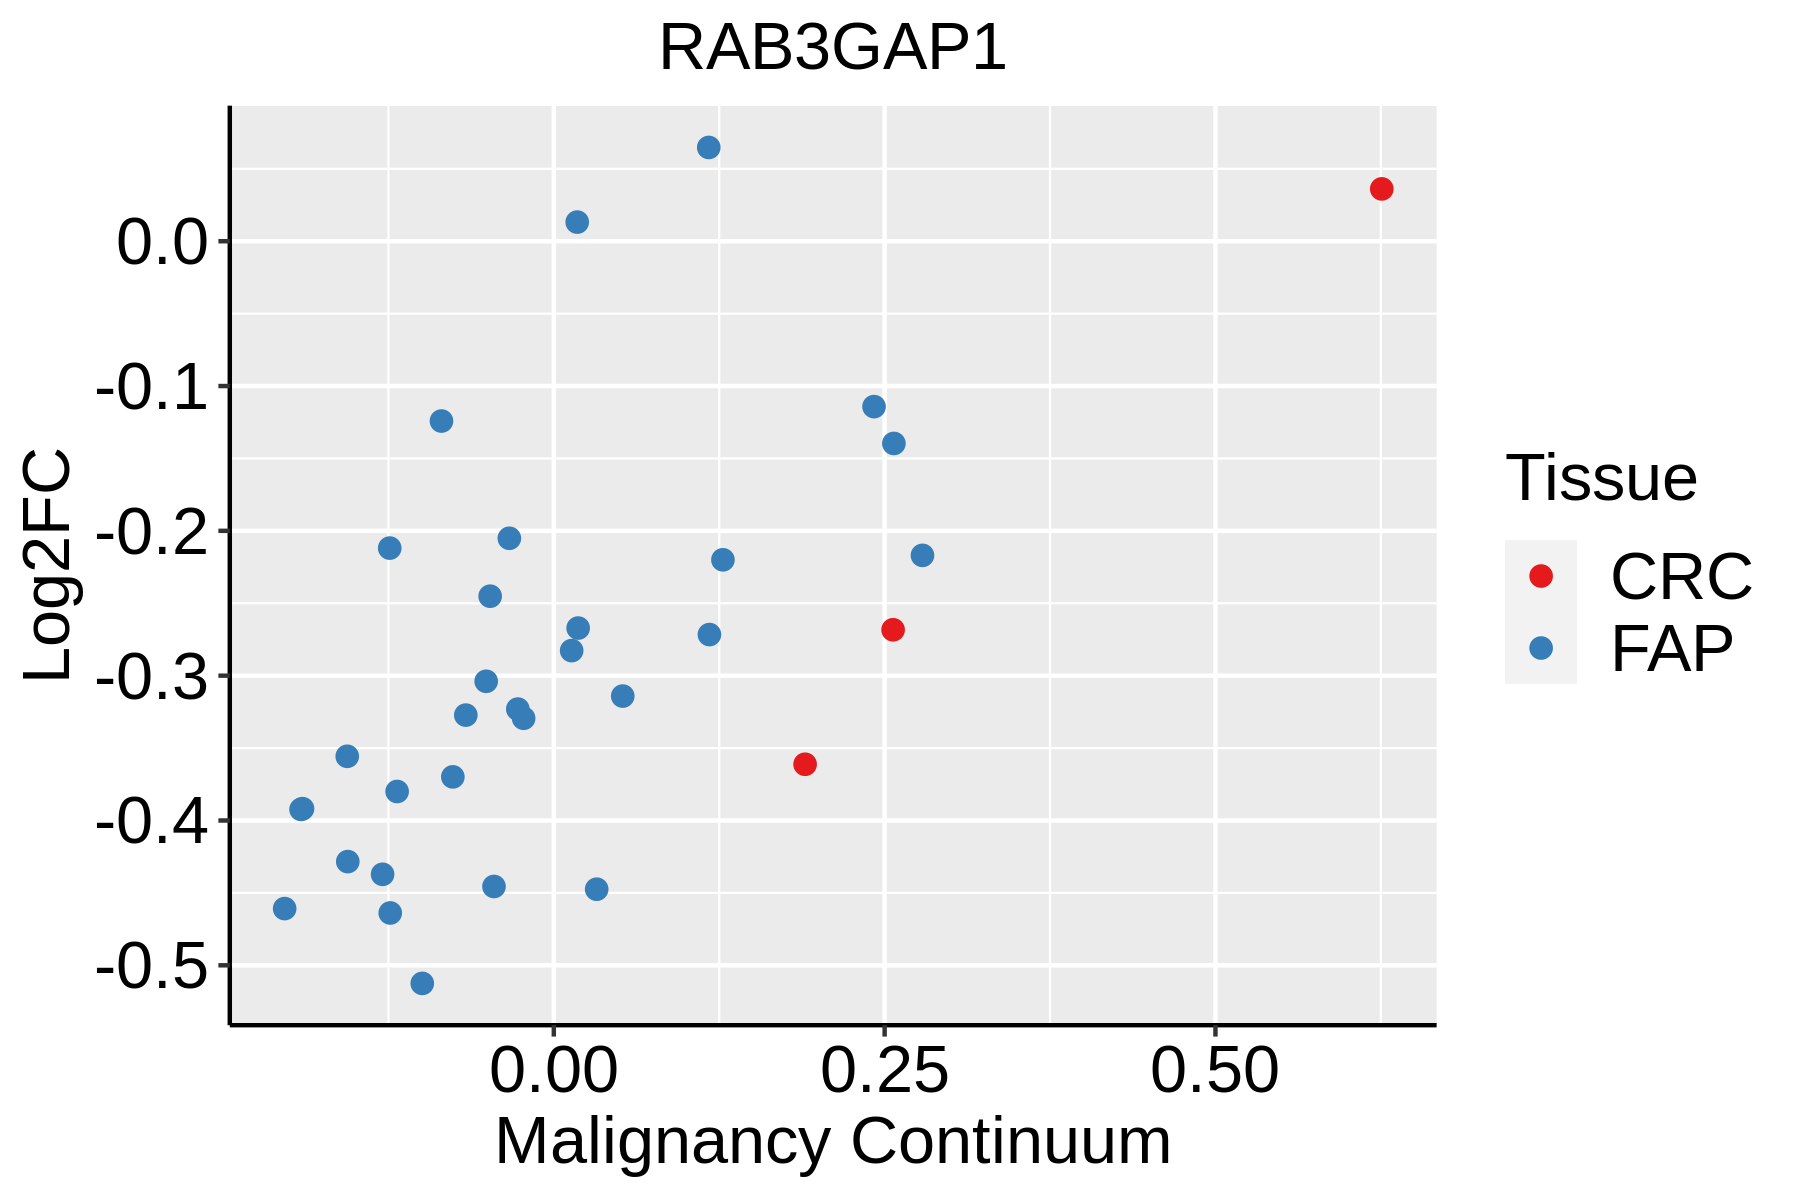 | FAP: Familial adenomatous polyposis |
| CRC: Colorectal cancer | ||
| Colorectum (HTA11) | 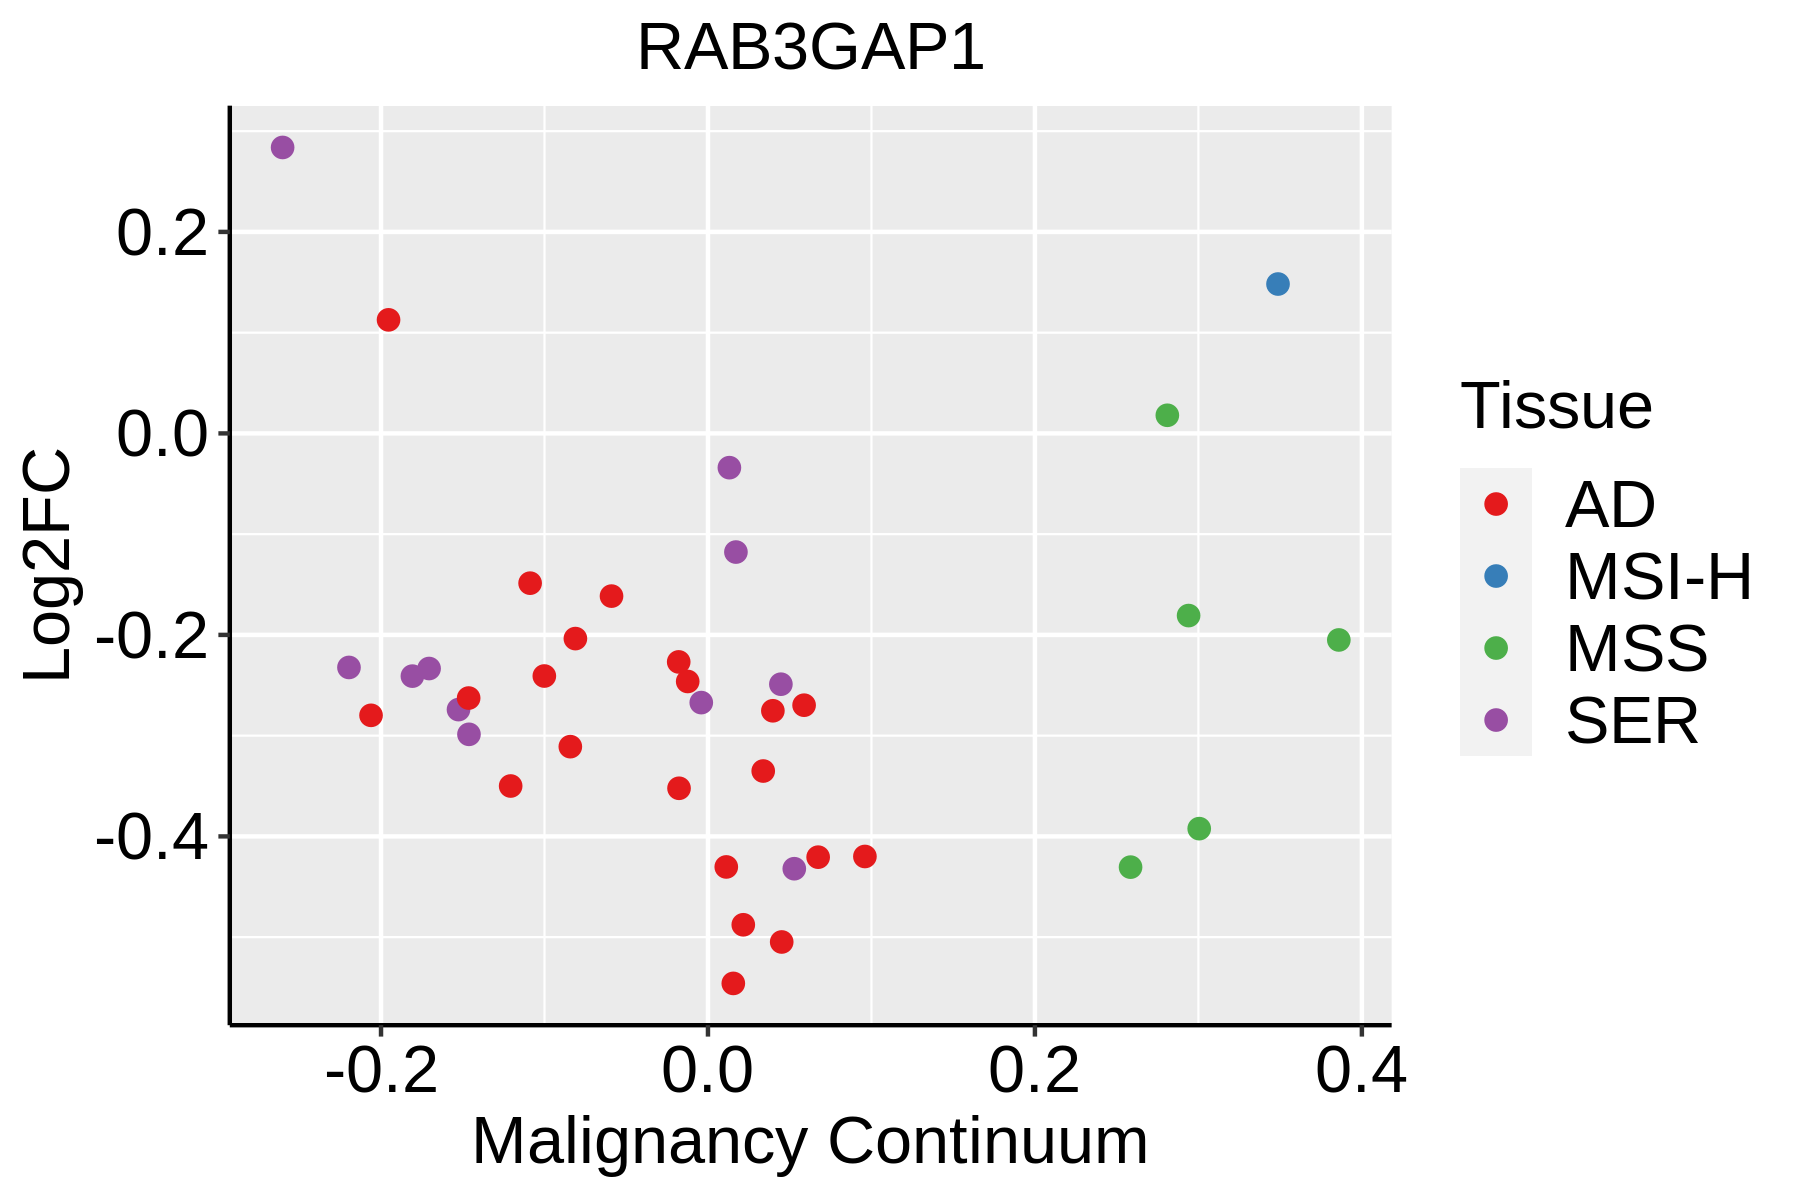 | AD: Adenomas |
| SER: Sessile serrated lesions | ||
| MSI-H: Microsatellite-high colorectal cancer | ||
| MSS: Microsatellite stable colorectal cancer | ||
| Esophagus | 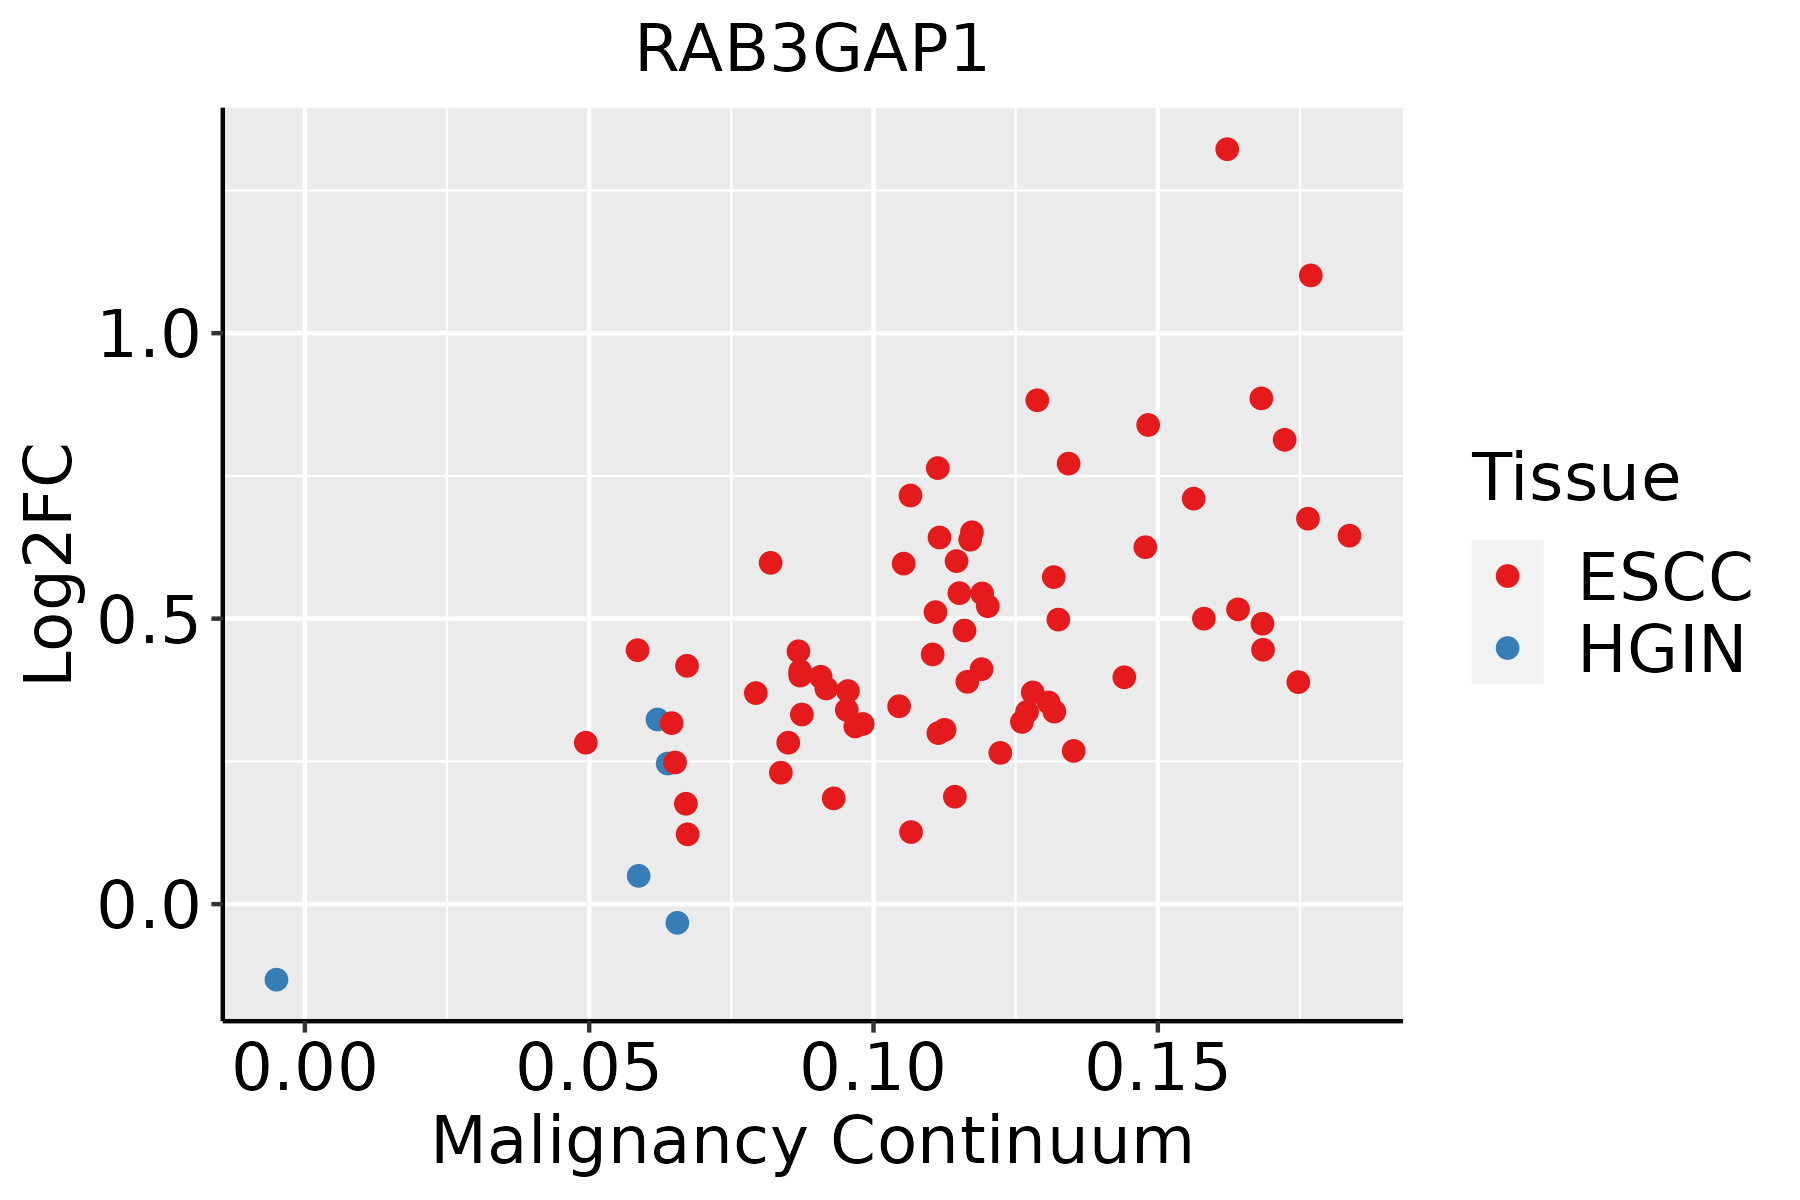 | ESCC: Esophageal squamous cell carcinoma |
| HGIN: High-grade intraepithelial neoplasias | ||
| LGIN: Low-grade intraepithelial neoplasias | ||
| Liver | 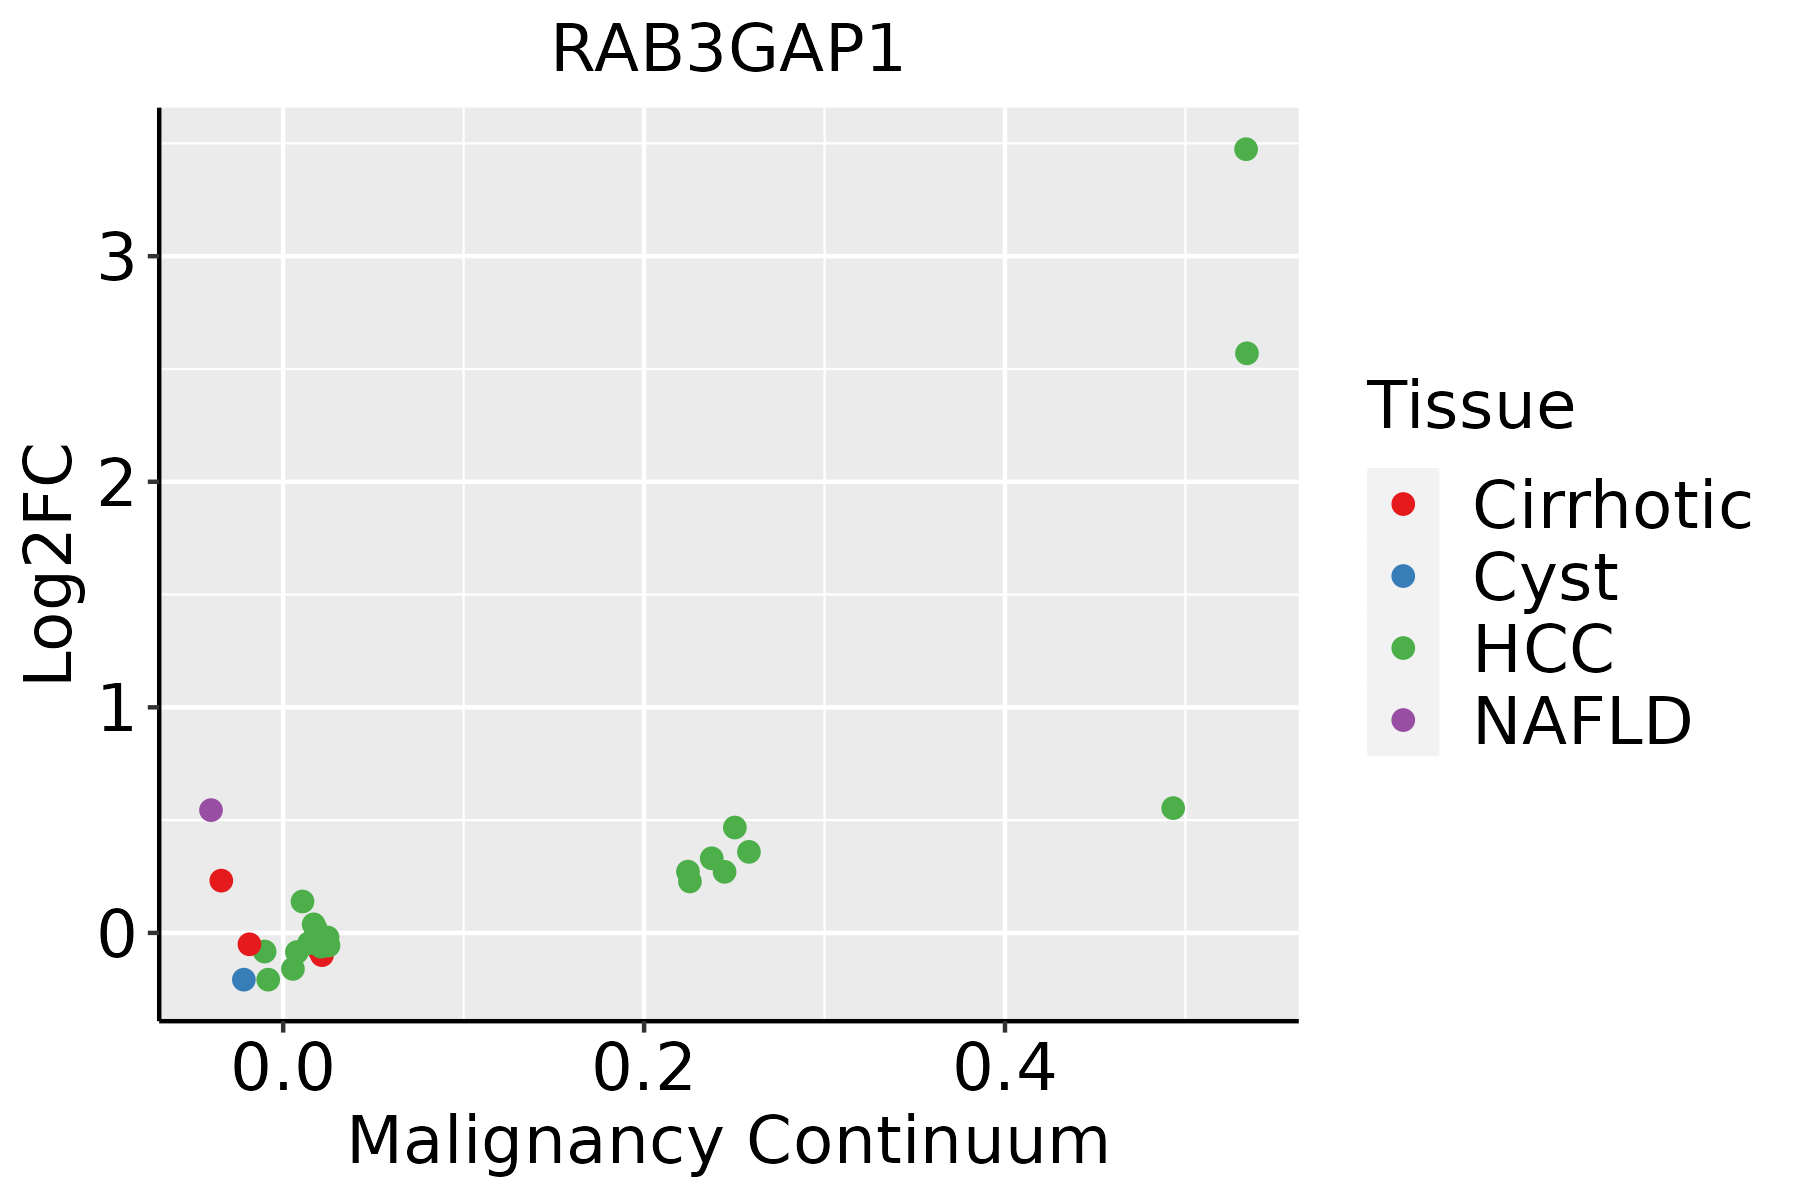 | HCC: Hepatocellular carcinoma |
| NAFLD: Non-alcoholic fatty liver disease | ||
| Lung | 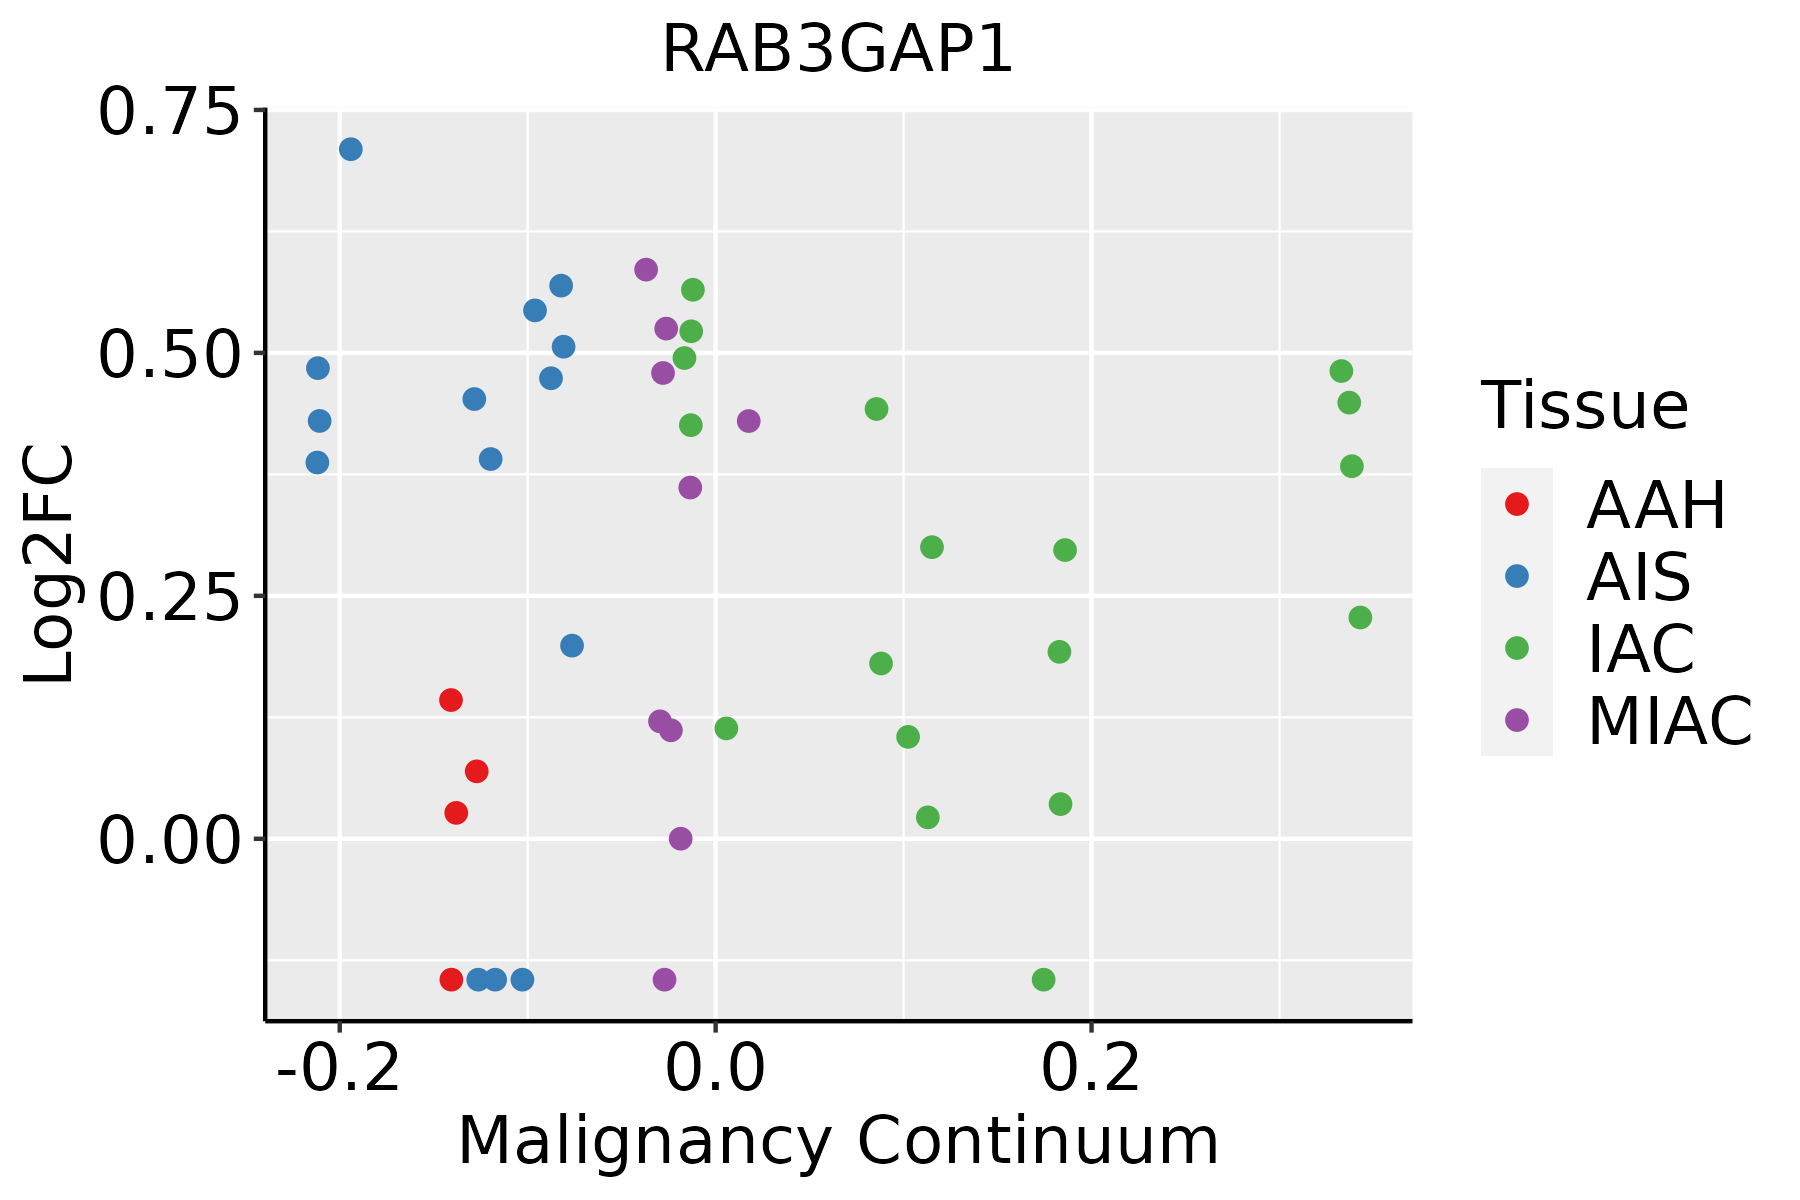 | AAH: Atypical adenomatous hyperplasia |
| AIS: Adenocarcinoma in situ | ||
| IAC: Invasive lung adenocarcinoma | ||
| MIA: Minimally invasive adenocarcinoma | ||
| Oral Cavity | 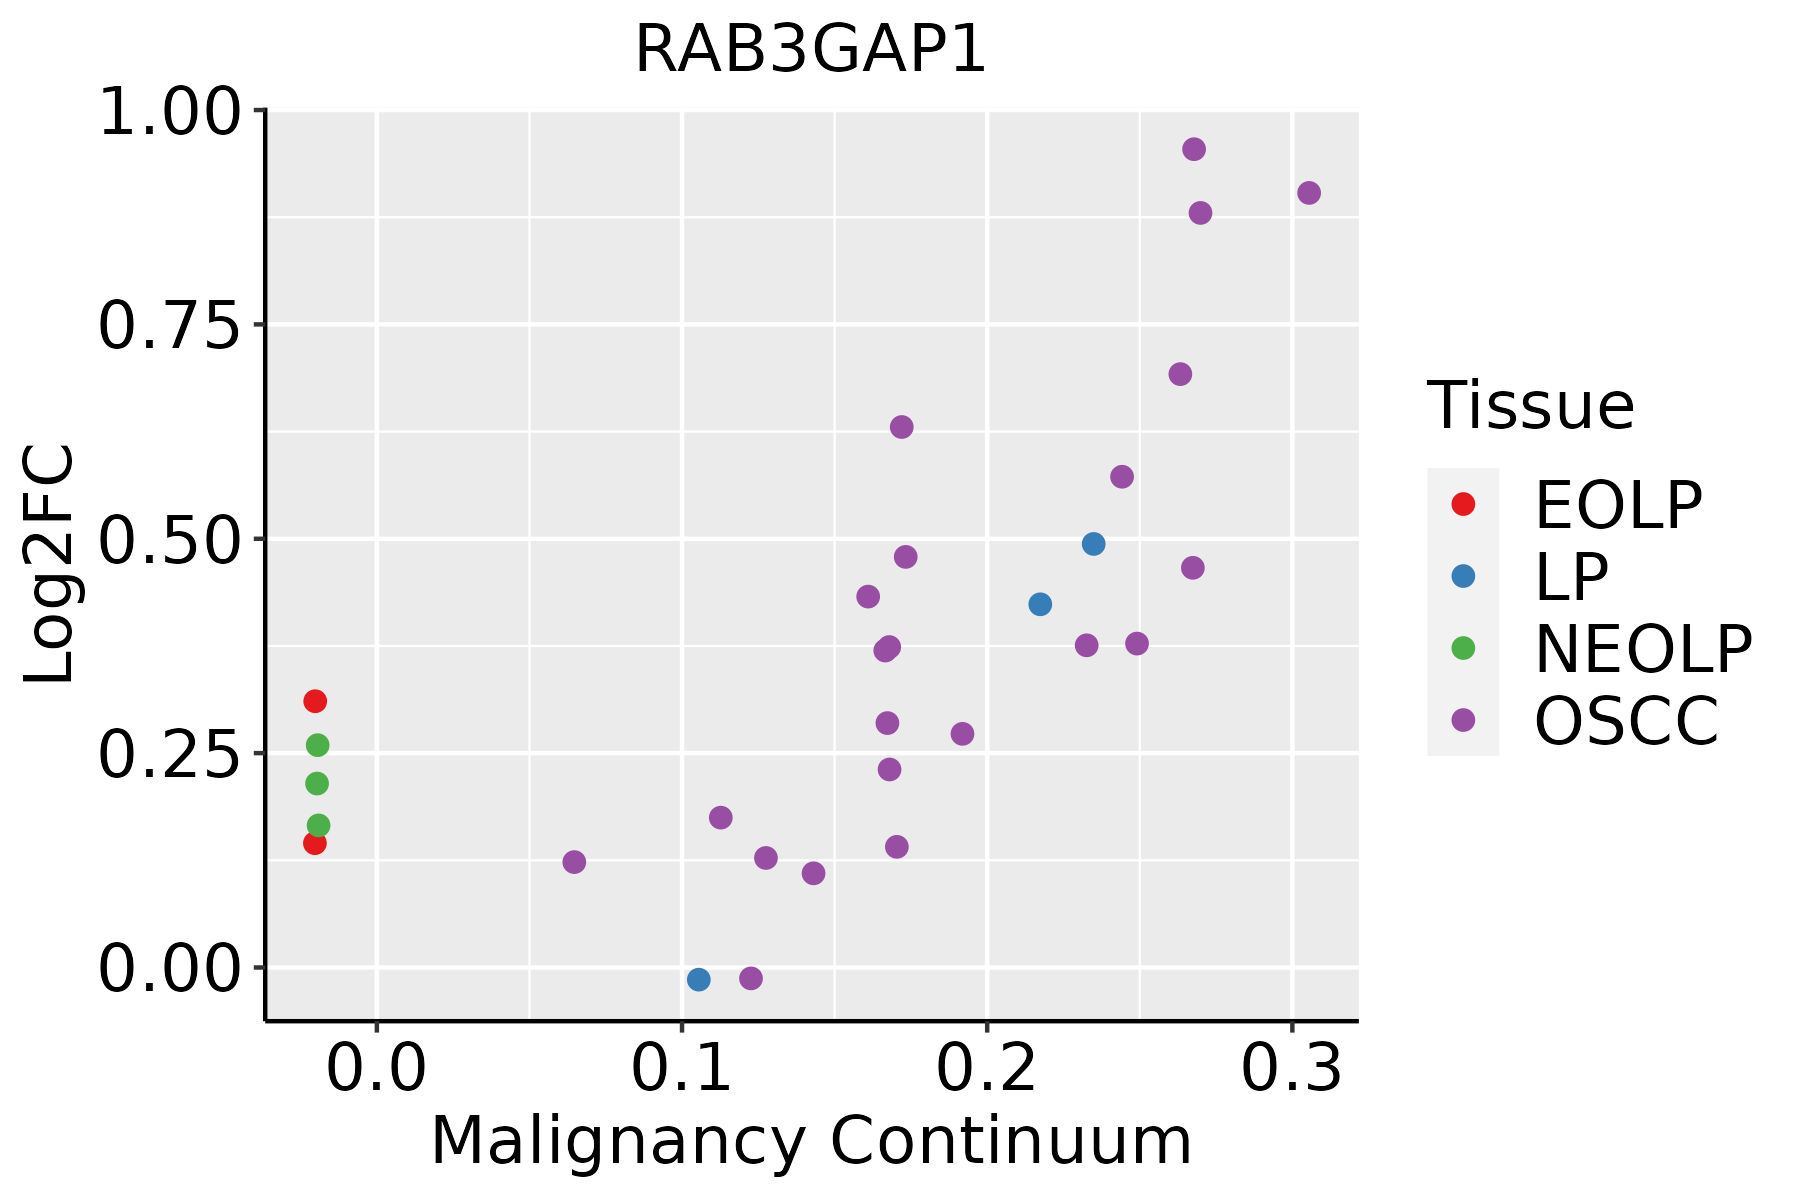 | EOLP: Erosive Oral lichen planus |
| LP: leukoplakia | ||
| NEOLP: Non-erosive oral lichen planus | ||
| OSCC: Oral squamous cell carcinoma | ||
| Prostate | 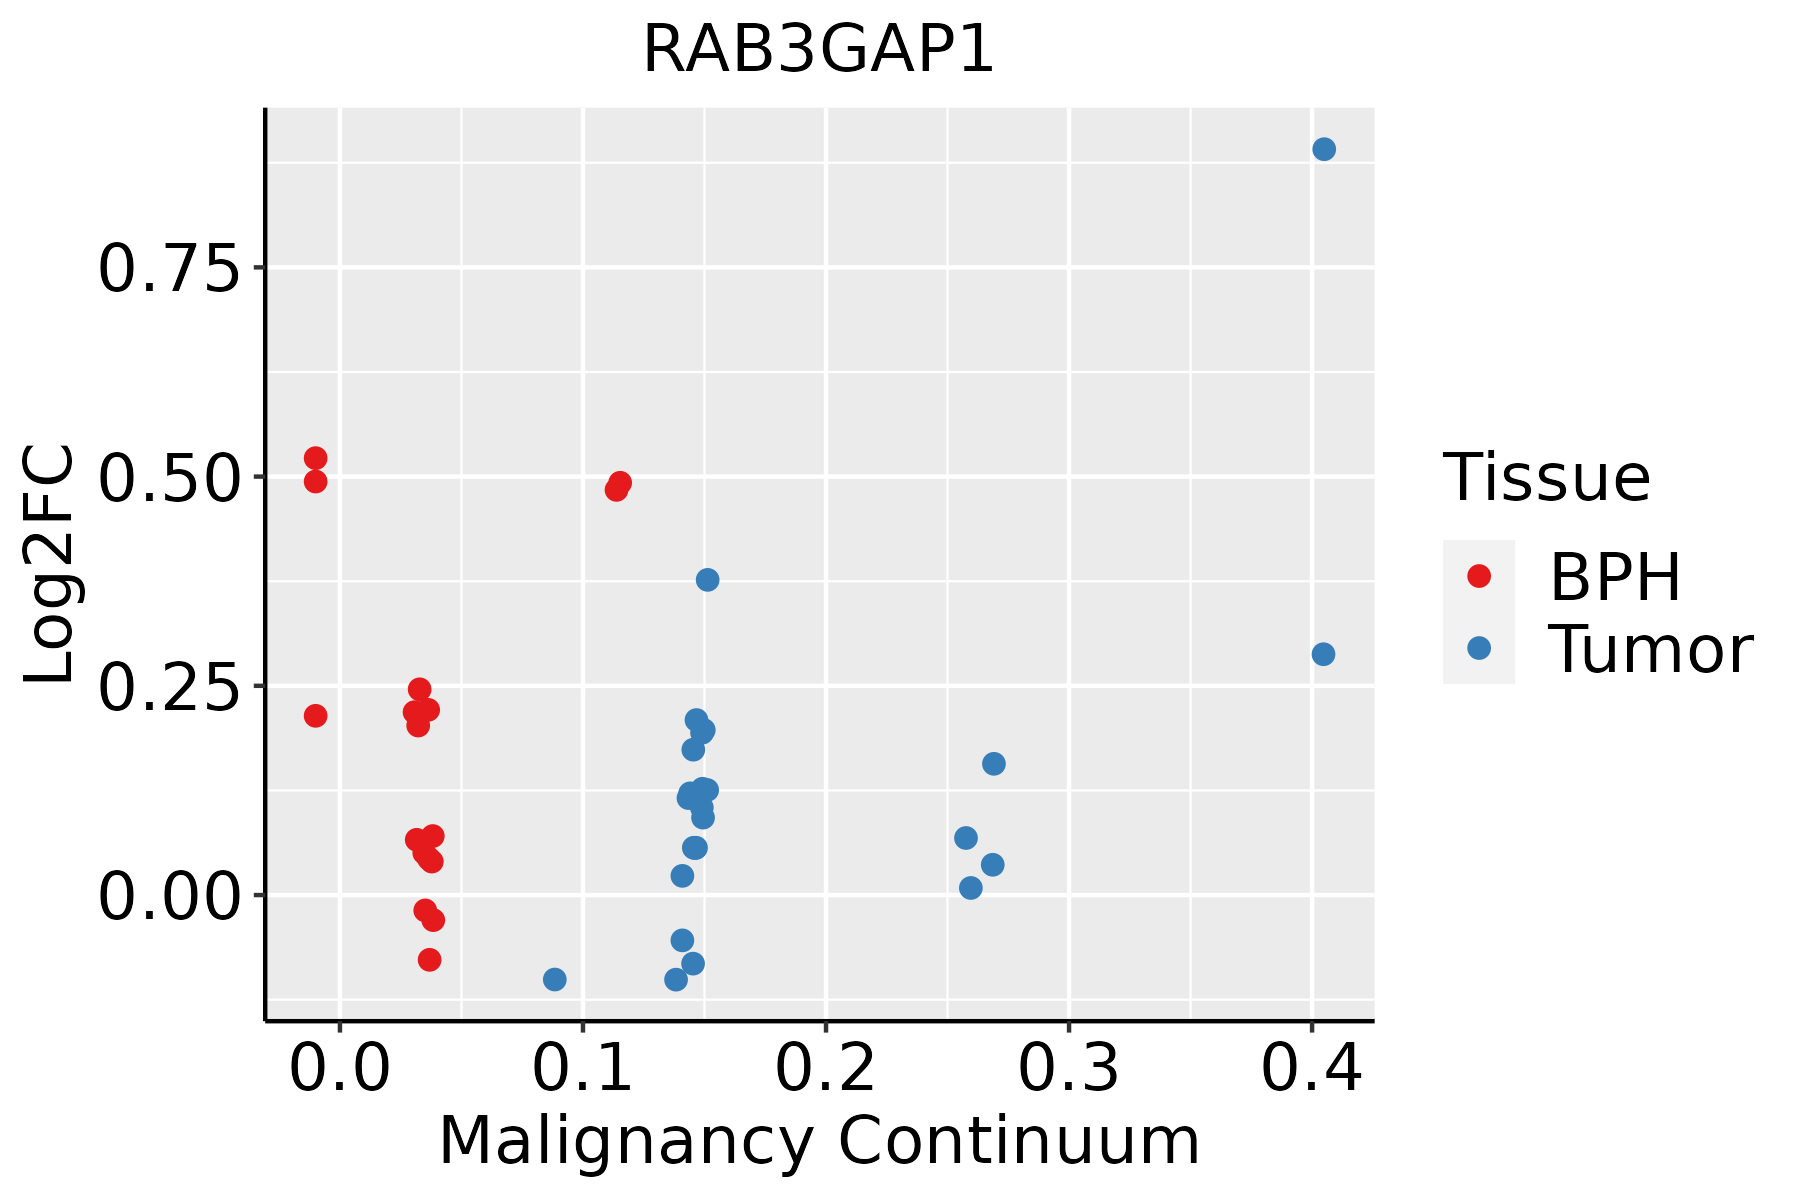 | BPH: Benign Prostatic Hyperplasia |
| Skin |  | AK: Actinic keratosis |
| cSCC: Cutaneous squamous cell carcinoma | ||
| SCCIS:squamous cell carcinoma in situ | ||
| Thyroid | 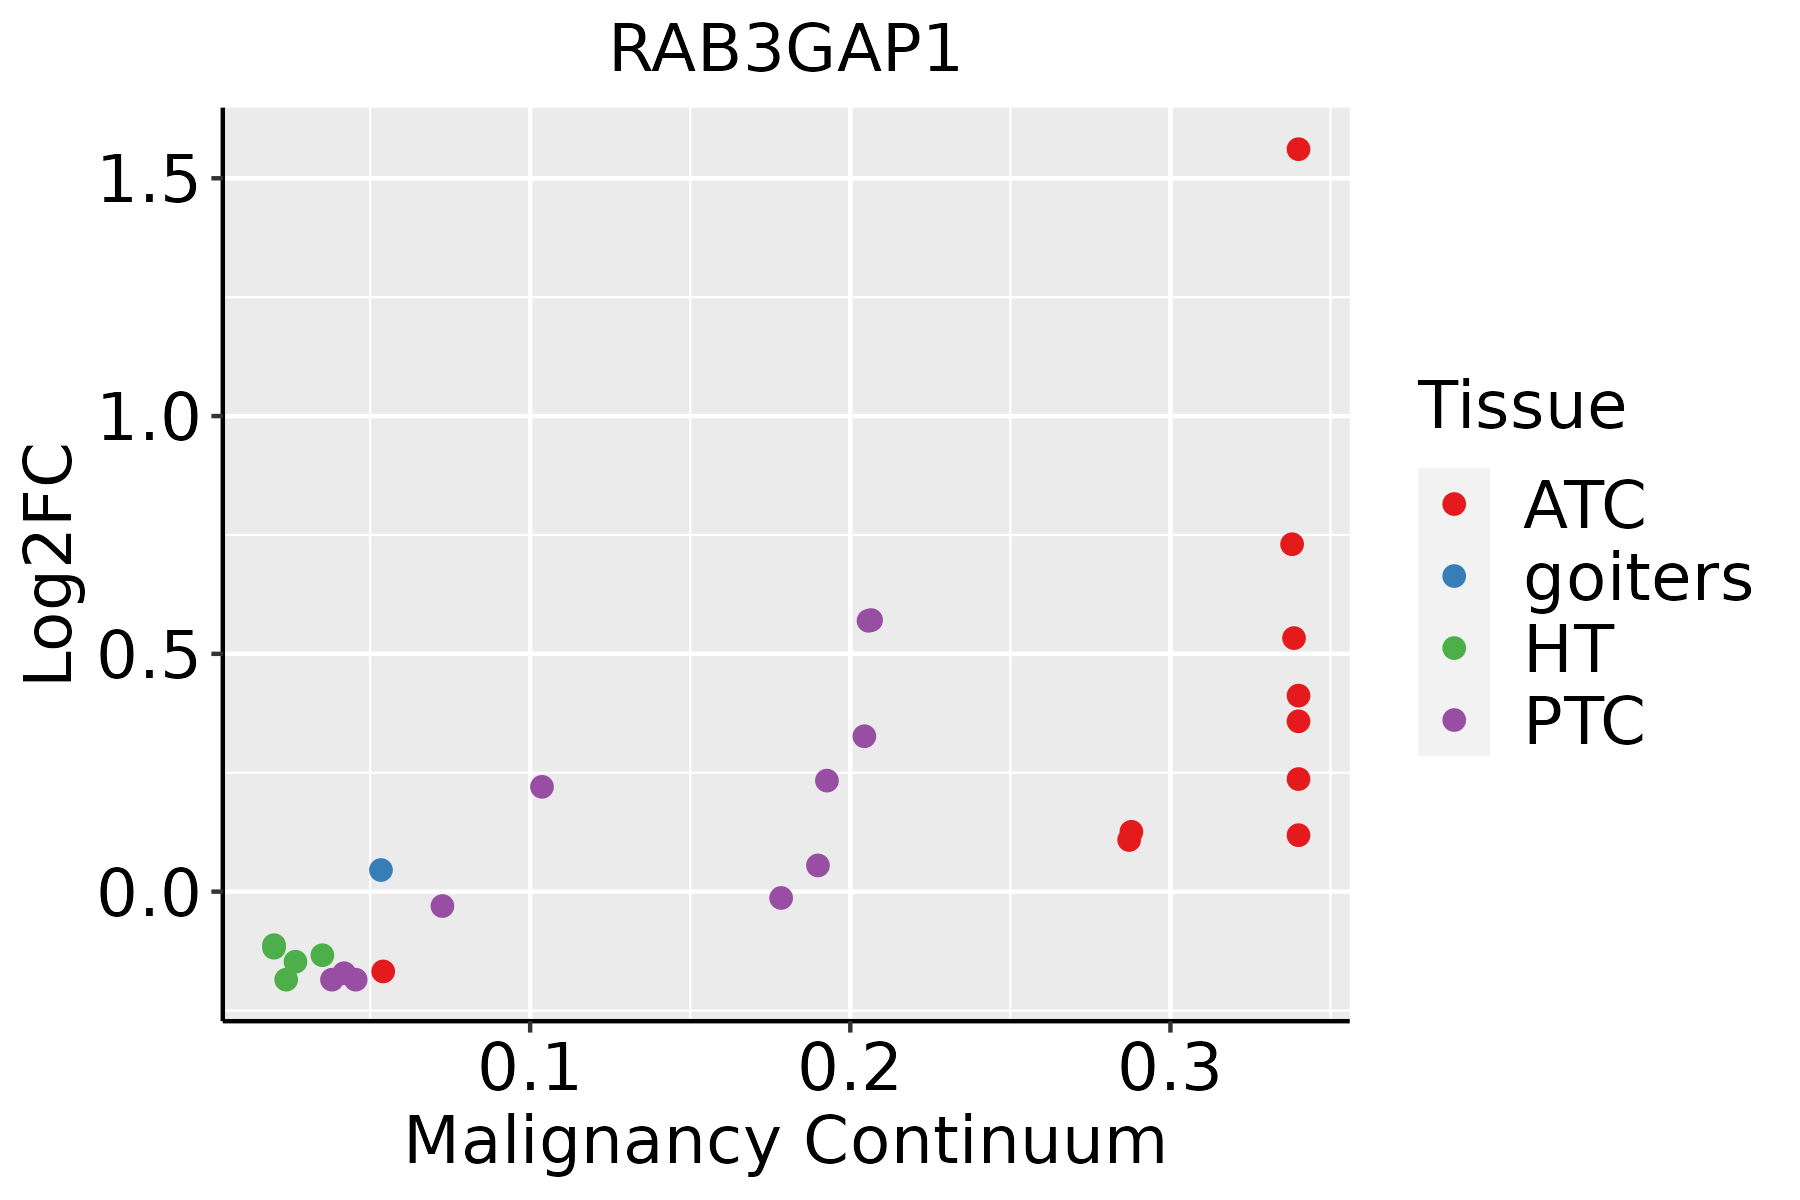 | ATC: Anaplastic thyroid cancer |
| HT: Hashimoto's thyroiditis | ||
| PTC: Papillary thyroid cancer |
| ∗log2FC in expression of this searched gene in stem-like cells from each diseased tissue sample relative to stem-like cells in normal samples in each tissue plotted against the malignancy continuum. Samples are colored based on if they are from different disease stage. |
Top |
Malignant transformation related pathway analysis |
| Find out the enriched GO biological processes and KEGG pathways involved in transition from healthy to precancer to cancer |
| Tissue | Disease Stage | Enriched GO biological Processes |
| Colorectum | AD |  |
| Colorectum | SER |  |
| Colorectum | MSS |  |
| Colorectum | MSI-H |  |
| Colorectum | FAP |  |
| ∗Top 15 enriched GO BP terms are showed in the bar plot of each disease state in each tissue. Each row represents a significant GO biological process which is colored according to the -log10(p.adjust). |
| Page: 1 2 3 4 5 6 7 8 9 |
| GO ID | Tissue | Disease Stage | Description | Gene Ratio | Bg Ratio | pvalue | p.adjust | Count |
| GO:001624115 | Thyroid | ATC | regulation of macroautophagy | 86/6293 | 141/18723 | 2.35e-11 | 8.24e-10 | 86 |
| GO:007097232 | Thyroid | ATC | protein localization to endoplasmic reticulum | 53/6293 | 74/18723 | 2.52e-11 | 8.69e-10 | 53 |
| GO:000703322 | Thyroid | ATC | vacuole organization | 100/6293 | 180/18723 | 1.07e-09 | 2.71e-08 | 100 |
| GO:001050817 | Thyroid | ATC | positive regulation of autophagy | 73/6293 | 124/18723 | 6.74e-09 | 1.46e-07 | 73 |
| GO:007259931 | Thyroid | ATC | establishment of protein localization to endoplasmic reticulum | 32/6293 | 46/18723 | 6.68e-07 | 9.13e-06 | 32 |
| GO:000702921 | Thyroid | ATC | endoplasmic reticulum organization | 51/6293 | 87/18723 | 1.47e-06 | 1.81e-05 | 51 |
| GO:000004522 | Thyroid | ATC | autophagosome assembly | 56/6293 | 99/18723 | 2.22e-06 | 2.63e-05 | 56 |
| GO:190503721 | Thyroid | ATC | autophagosome organization | 57/6293 | 103/18723 | 4.61e-06 | 5.03e-05 | 57 |
| GO:006032511 | Thyroid | ATC | face morphogenesis | 21/6293 | 28/18723 | 8.94e-06 | 8.95e-05 | 21 |
| GO:190211522 | Thyroid | ATC | regulation of organelle assembly | 90/6293 | 186/18723 | 2.00e-05 | 1.81e-04 | 90 |
| GO:001017111 | Thyroid | ATC | body morphogenesis | 28/6293 | 43/18723 | 2.35e-05 | 2.06e-04 | 28 |
| GO:004308719 | Thyroid | ATC | regulation of GTPase activity | 153/6293 | 348/18723 | 3.24e-05 | 2.68e-04 | 153 |
| GO:001623912 | Thyroid | ATC | positive regulation of macroautophagy | 37/6293 | 63/18723 | 3.73e-05 | 3.05e-04 | 37 |
| GO:006032411 | Thyroid | ATC | face development | 28/6293 | 44/18723 | 4.39e-05 | 3.54e-04 | 28 |
| GO:003090015 | Thyroid | ATC | forebrain development | 164/6293 | 379/18723 | 4.85e-05 | 3.87e-04 | 164 |
| GO:006032311 | Thyroid | ATC | head morphogenesis | 22/6293 | 32/18723 | 5.14e-05 | 3.99e-04 | 22 |
| GO:007178622 | Thyroid | ATC | endoplasmic reticulum tubular network organization | 14/6293 | 18/18723 | 1.59e-04 | 1.10e-03 | 14 |
| GO:190211713 | Thyroid | ATC | positive regulation of organelle assembly | 36/6293 | 67/18723 | 5.41e-04 | 3.13e-03 | 36 |
| GO:004408813 | Thyroid | ATC | regulation of vacuole organization | 26/6293 | 45/18723 | 7.43e-04 | 4.14e-03 | 26 |
| GO:004354715 | Thyroid | ATC | positive regulation of GTPase activity | 106/6293 | 255/18723 | 4.58e-03 | 1.89e-02 | 106 |
| Page: 1 2 3 4 5 6 7 8 9 10 11 12 13 14 15 16 17 18 19 20 21 22 |
| Pathway ID | Tissue | Disease Stage | Description | Gene Ratio | Bg Ratio | pvalue | p.adjust | qvalue | Count |
| Page: 1 |
Top |
Cell-cell communication analysis |
| Identification of potential cell-cell interactions between two cell types and their ligand-receptor pairs for different disease states |
| Ligand | Receptor | LRpair | Pathway | Tissue | Disease Stage |
| Page: 1 |
Top |
Single-cell gene regulatory network inference analysis |
| Find out the significant the regulons (TFs) and the target genes of each regulon across cell types for different disease states |
| TF | Cell Type | Tissue | Disease Stage | Target Gene | RSS | Regulon Activity |
| ∗The dot plots of a searched regulon are shown for all cell subpopulations in each disease state of each tissue based on the regulon specific score inferred using pySCENIC and by calculating the average expression. |
| Page: 1 |
Top |
Somatic mutation of malignant transformation related genes |
| Annotation of somatic variants for genes involved in malignant transformation |
| Hugo Symbol | Variant Class | Variant Classification | dbSNP RS | HGVSc | HGVSp | HGVSp Short | SWISSPROT | BIOTYPE | SIFT | PolyPhen | Tumor Sample Barcode | Tissue | Histology | Sex | Age | Stage | Therapy Types | Drugs | Outcome |
| RAB3GAP1 | SNV | Missense_Mutation | rs757654937 | c.2187N>A | p.Met729Ile | p.M729I | Q15042 | protein_coding | deleterious(0.02) | benign(0.259) | TCGA-AC-A23H-01 | Breast | breast invasive carcinoma | Female | >=65 | I/II | Unknown | Unknown | PD |
| RAB3GAP1 | SNV | Missense_Mutation | novel | c.1604N>C | p.Lys535Thr | p.K535T | Q15042 | protein_coding | deleterious(0.03) | benign(0.241) | TCGA-E2-A150-01 | Breast | breast invasive carcinoma | Female | <65 | I/II | Chemotherapy | doxorubicin | SD |
| RAB3GAP1 | SNV | Missense_Mutation | c.238G>A | p.Val80Ile | p.V80I | Q15042 | protein_coding | tolerated(0.33) | benign(0.197) | TCGA-GM-A2DA-01 | Breast | breast invasive carcinoma | Female | <65 | I/II | Chemotherapy | fluorouracil | PD | |
| RAB3GAP1 | SNV | Missense_Mutation | novel | c.442N>T | p.Leu148Phe | p.L148F | Q15042 | protein_coding | deleterious(0) | probably_damaging(0.941) | TCGA-PE-A5DE-01 | Breast | breast invasive carcinoma | Female | <65 | I/II | Chemotherapy | taxotere | CR |
| RAB3GAP1 | deletion | Frame_Shift_Del | novel | c.1153_1159delNNNNNNN | p.His385GlnfsTer11 | p.H385Qfs*11 | Q15042 | protein_coding | TCGA-A8-A094-01 | Breast | breast invasive carcinoma | Female | >=65 | I/II | Unknown | Unknown | SD | ||
| RAB3GAP1 | deletion | Frame_Shift_Del | novel | c.2923delN | p.Phe975LeufsTer53 | p.F975Lfs*53 | Q15042 | protein_coding | TCGA-EW-A2FV-01 | Breast | breast invasive carcinoma | Female | <65 | III/IV | Chemotherapy | docetaxel | SD | ||
| RAB3GAP1 | SNV | Missense_Mutation | c.1358N>T | p.Ser453Phe | p.S453F | Q15042 | protein_coding | tolerated(0.1) | probably_damaging(0.915) | TCGA-BI-A20A-01 | Cervix | cervical & endocervical cancer | Female | <65 | I/II | Unknown | Unknown | SD | |
| RAB3GAP1 | SNV | Missense_Mutation | c.1076N>G | p.Asp359Gly | p.D359G | Q15042 | protein_coding | deleterious(0) | benign(0.335) | TCGA-EK-A2PM-01 | Cervix | cervical & endocervical cancer | Female | >=65 | I/II | Unknown | Unknown | SD | |
| RAB3GAP1 | SNV | Missense_Mutation | novel | c.2680N>T | p.Ile894Phe | p.I894F | Q15042 | protein_coding | deleterious(0) | benign(0.267) | TCGA-5M-AATE-01 | Colorectum | colon adenocarcinoma | Male | >=65 | I/II | Unknown | Unknown | PD |
| RAB3GAP1 | SNV | Missense_Mutation | c.560G>A | p.Arg187Gln | p.R187Q | Q15042 | protein_coding | tolerated(0.1) | probably_damaging(0.998) | TCGA-AA-3510-01 | Colorectum | colon adenocarcinoma | Male | >=65 | I/II | Unknown | Unknown | SD |
| Page: 1 2 3 4 5 6 7 8 9 10 11 |
Top |
Related drugs of malignant transformation related genes |
| Identification of chemicals and drugs interact with genes involved in malignant transfromation |
| (DGIdb 4.0) |
| Entrez ID | Symbol | Category | Interaction Types | Drug Claim Name | Drug Name | PMIDs |
| Page: 1 |

Copyright 2023-Present -The University of Texas Health Science Center at Houston |