| Tissue | Expression Dynamics | Abbreviation |
| Breast | 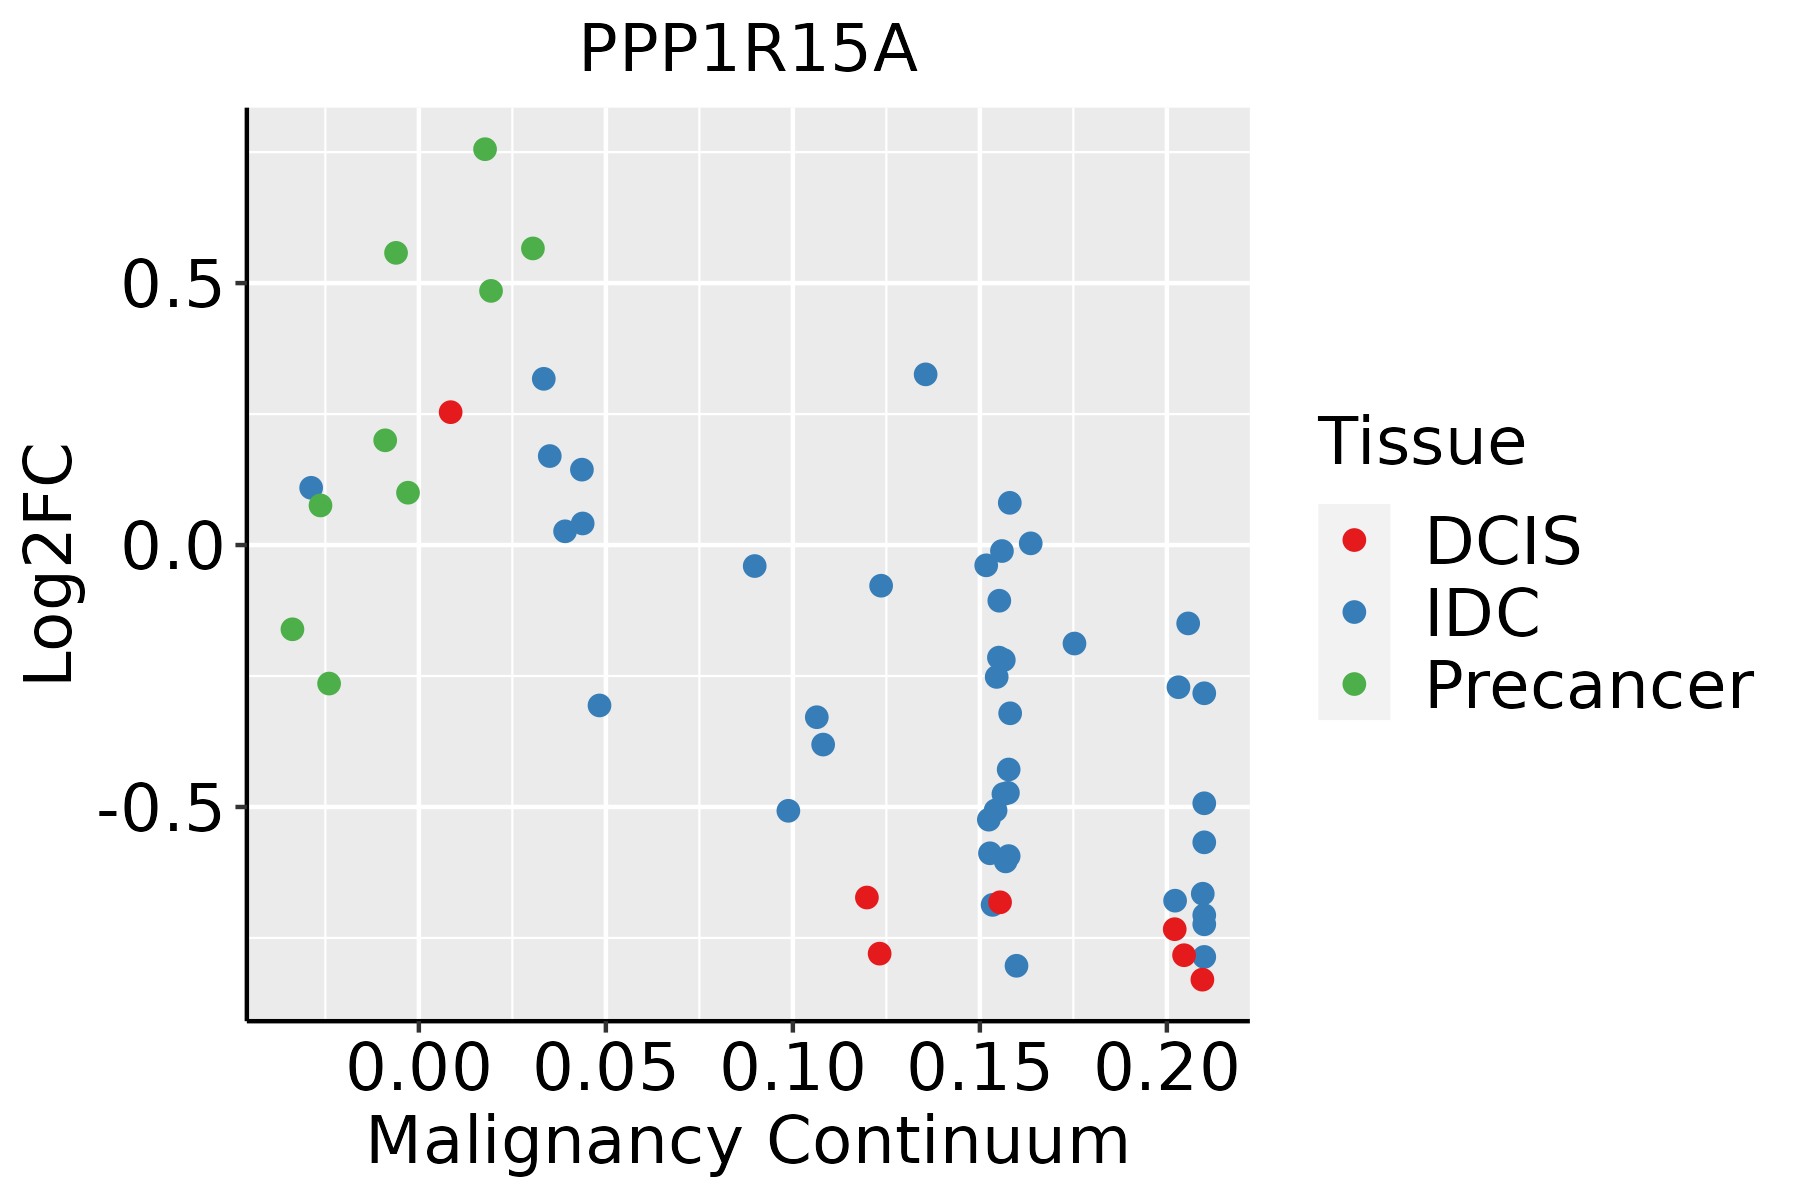 | IDC: Invasive ductal carcinoma |
| DCIS: Ductal carcinoma in situ |
| Precancer(BRCA1-mut): Precancerous lesion from BRCA1 mutation carriers |
| Cervix | 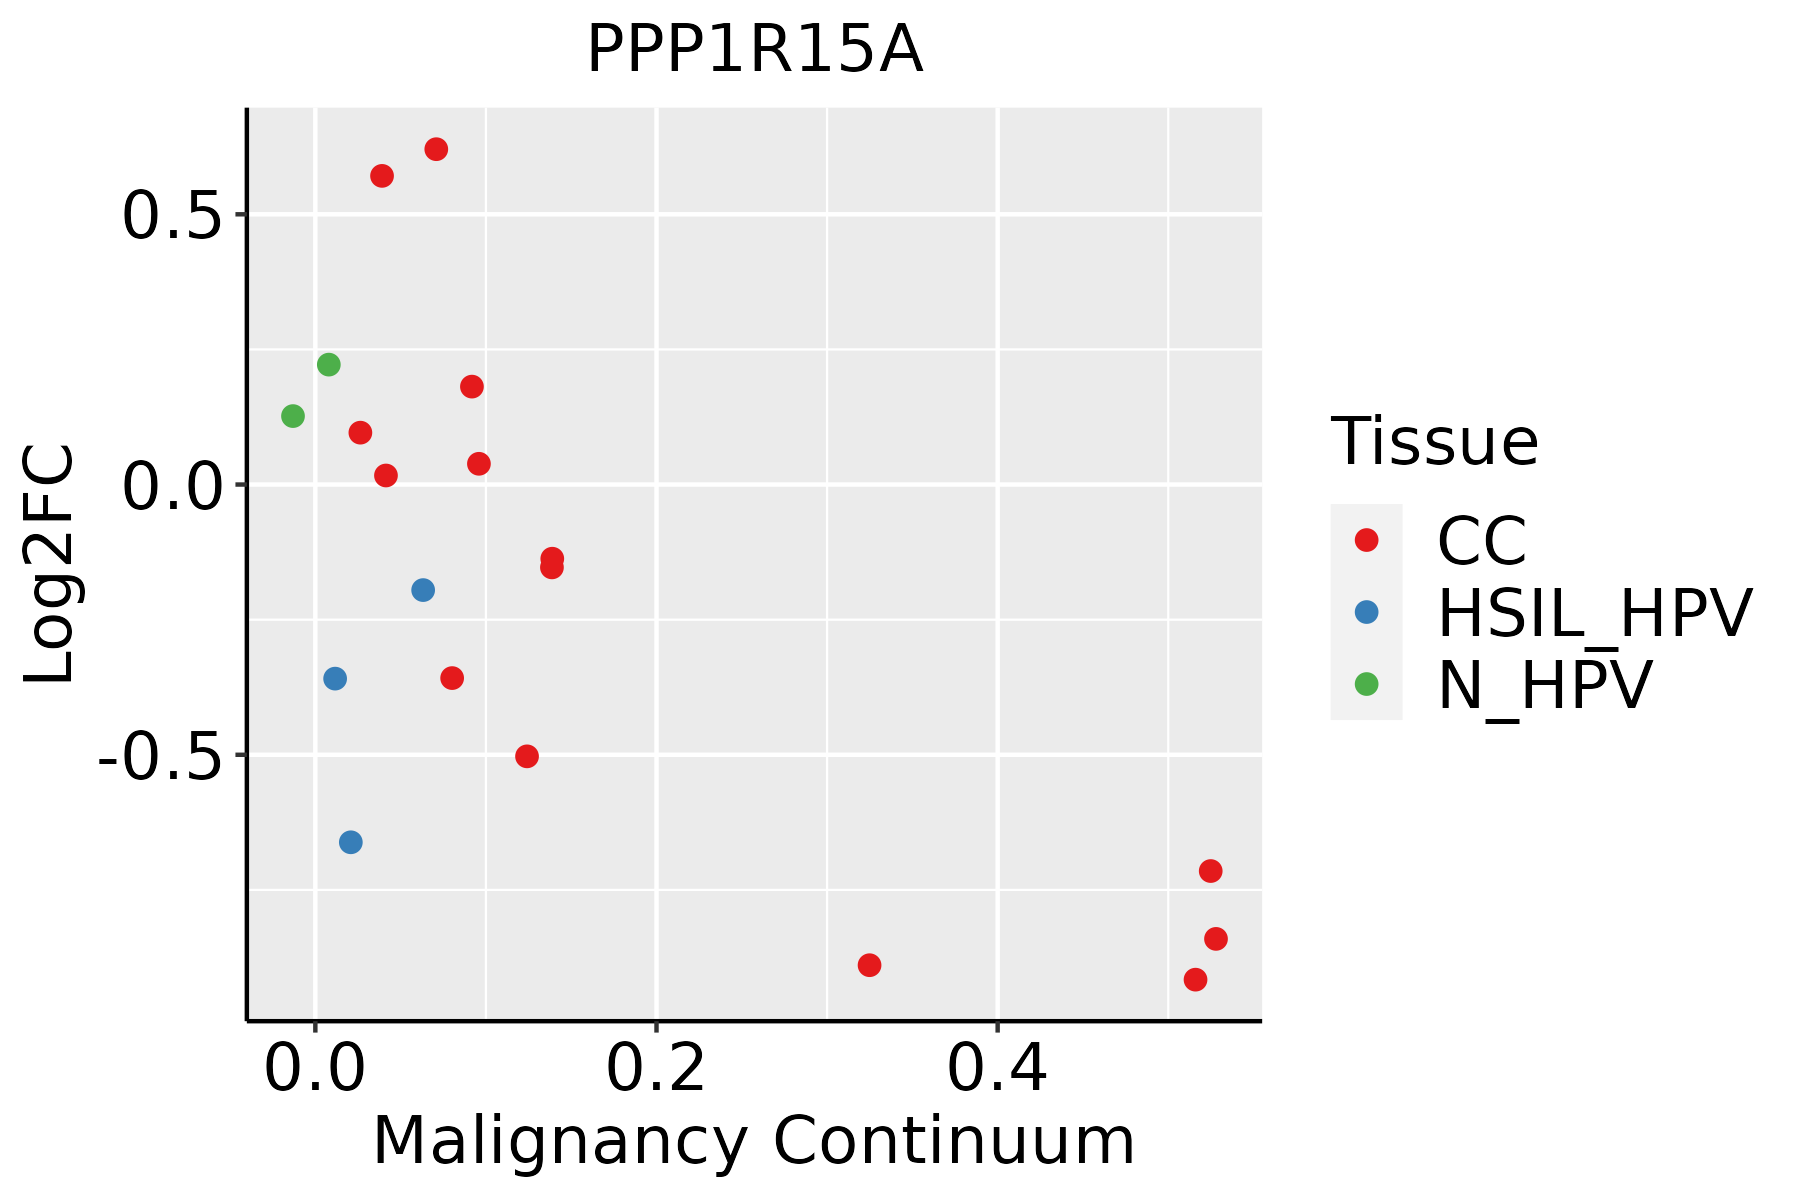 | CC: Cervix cancer |
| HSIL_HPV: HPV-infected high-grade squamous intraepithelial lesions |
| N_HPV: HPV-infected normal cervix |
| Endometrium | 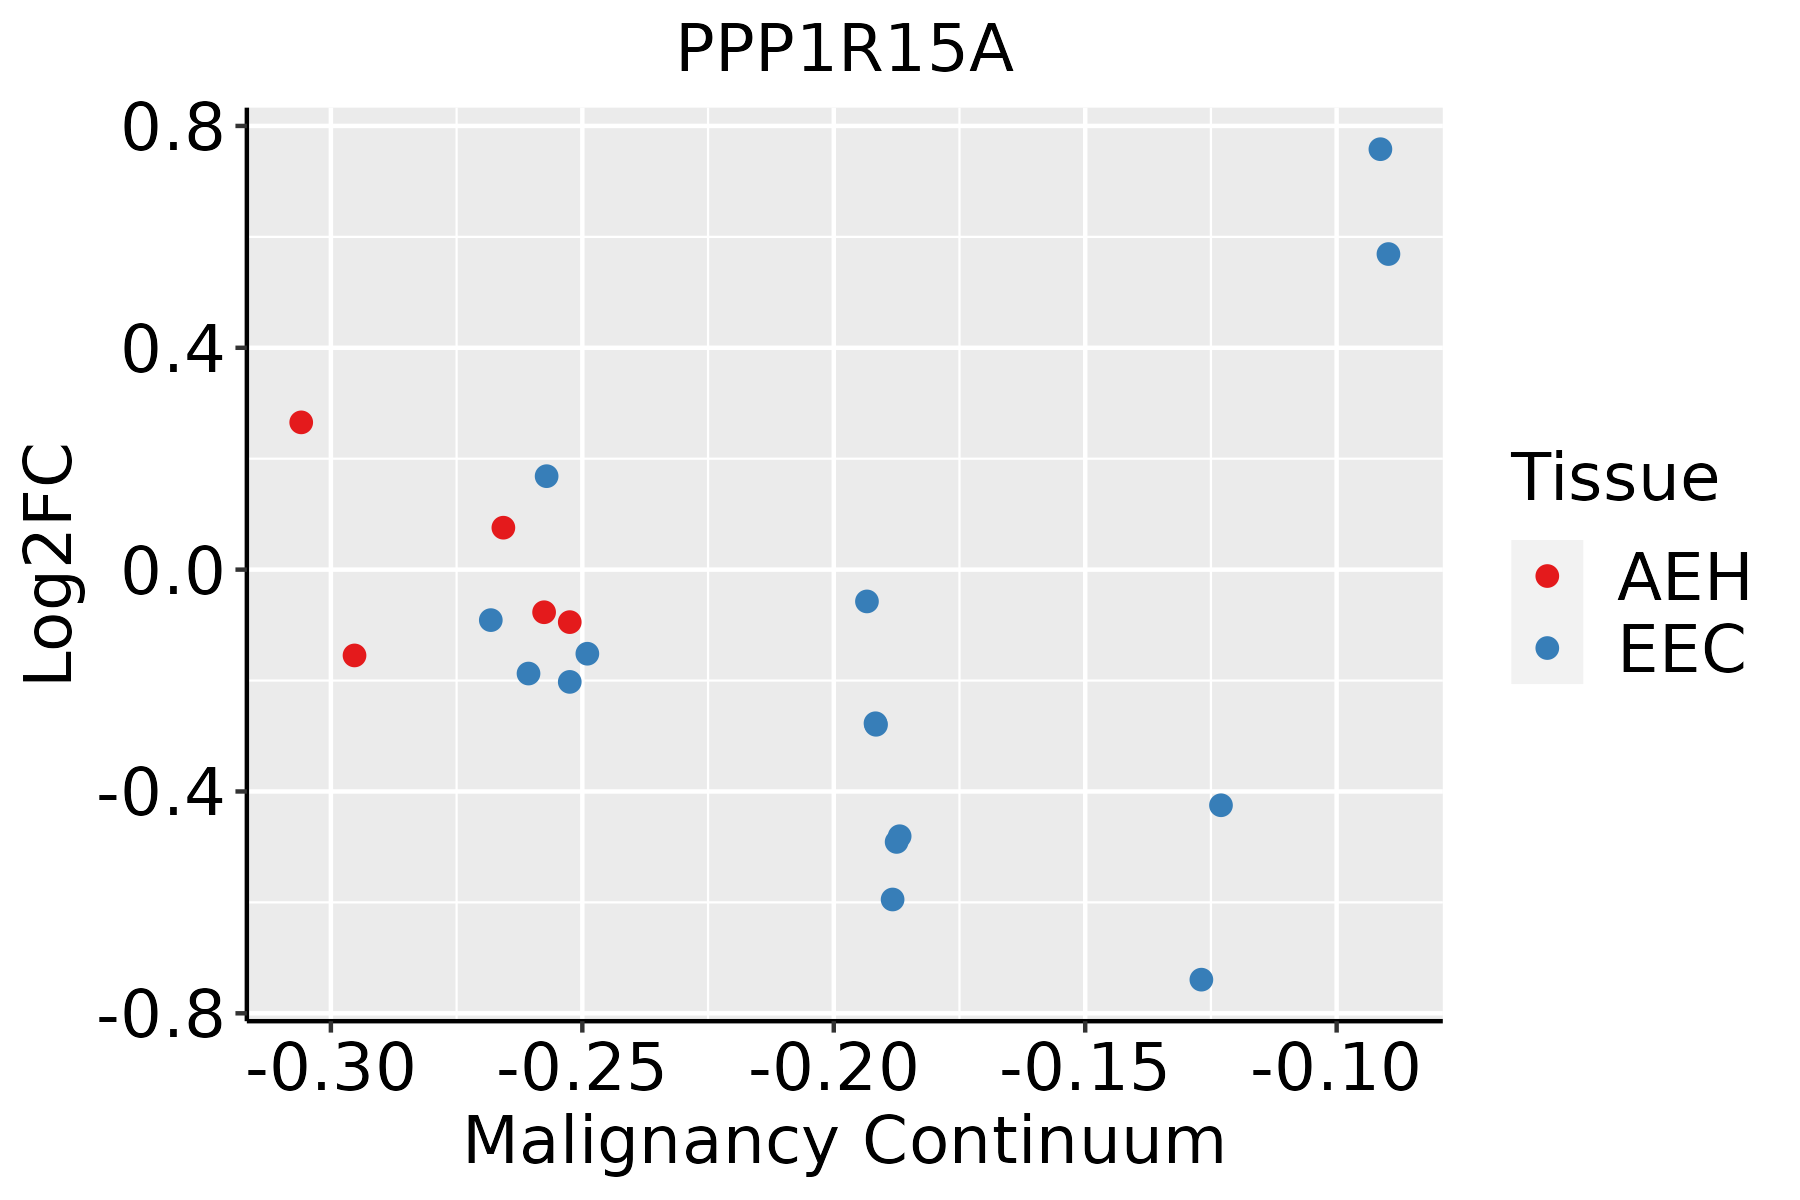 | AEH: Atypical endometrial hyperplasia |
| EEC: Endometrioid Cancer |
| Esophagus | 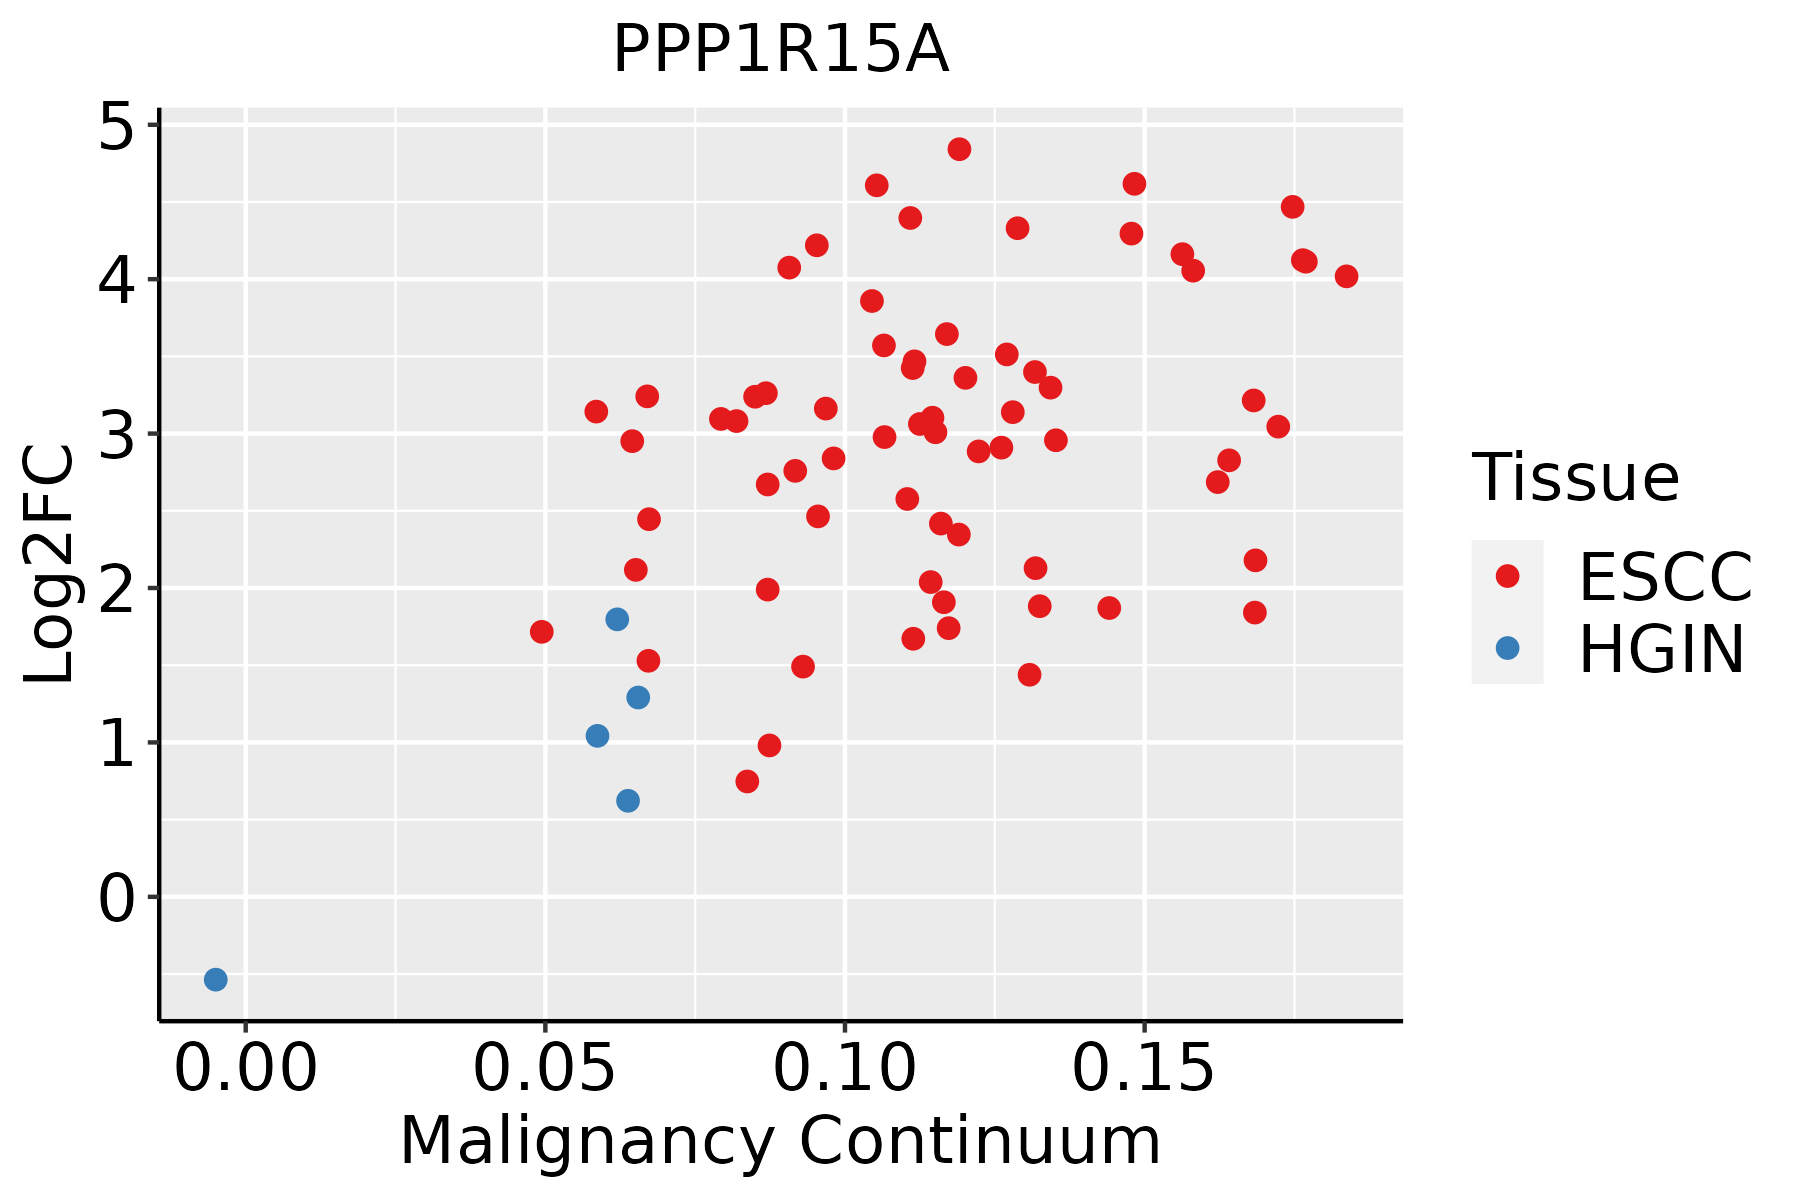 | ESCC: Esophageal squamous cell carcinoma |
| HGIN: High-grade intraepithelial neoplasias |
| LGIN: Low-grade intraepithelial neoplasias |
| GC | 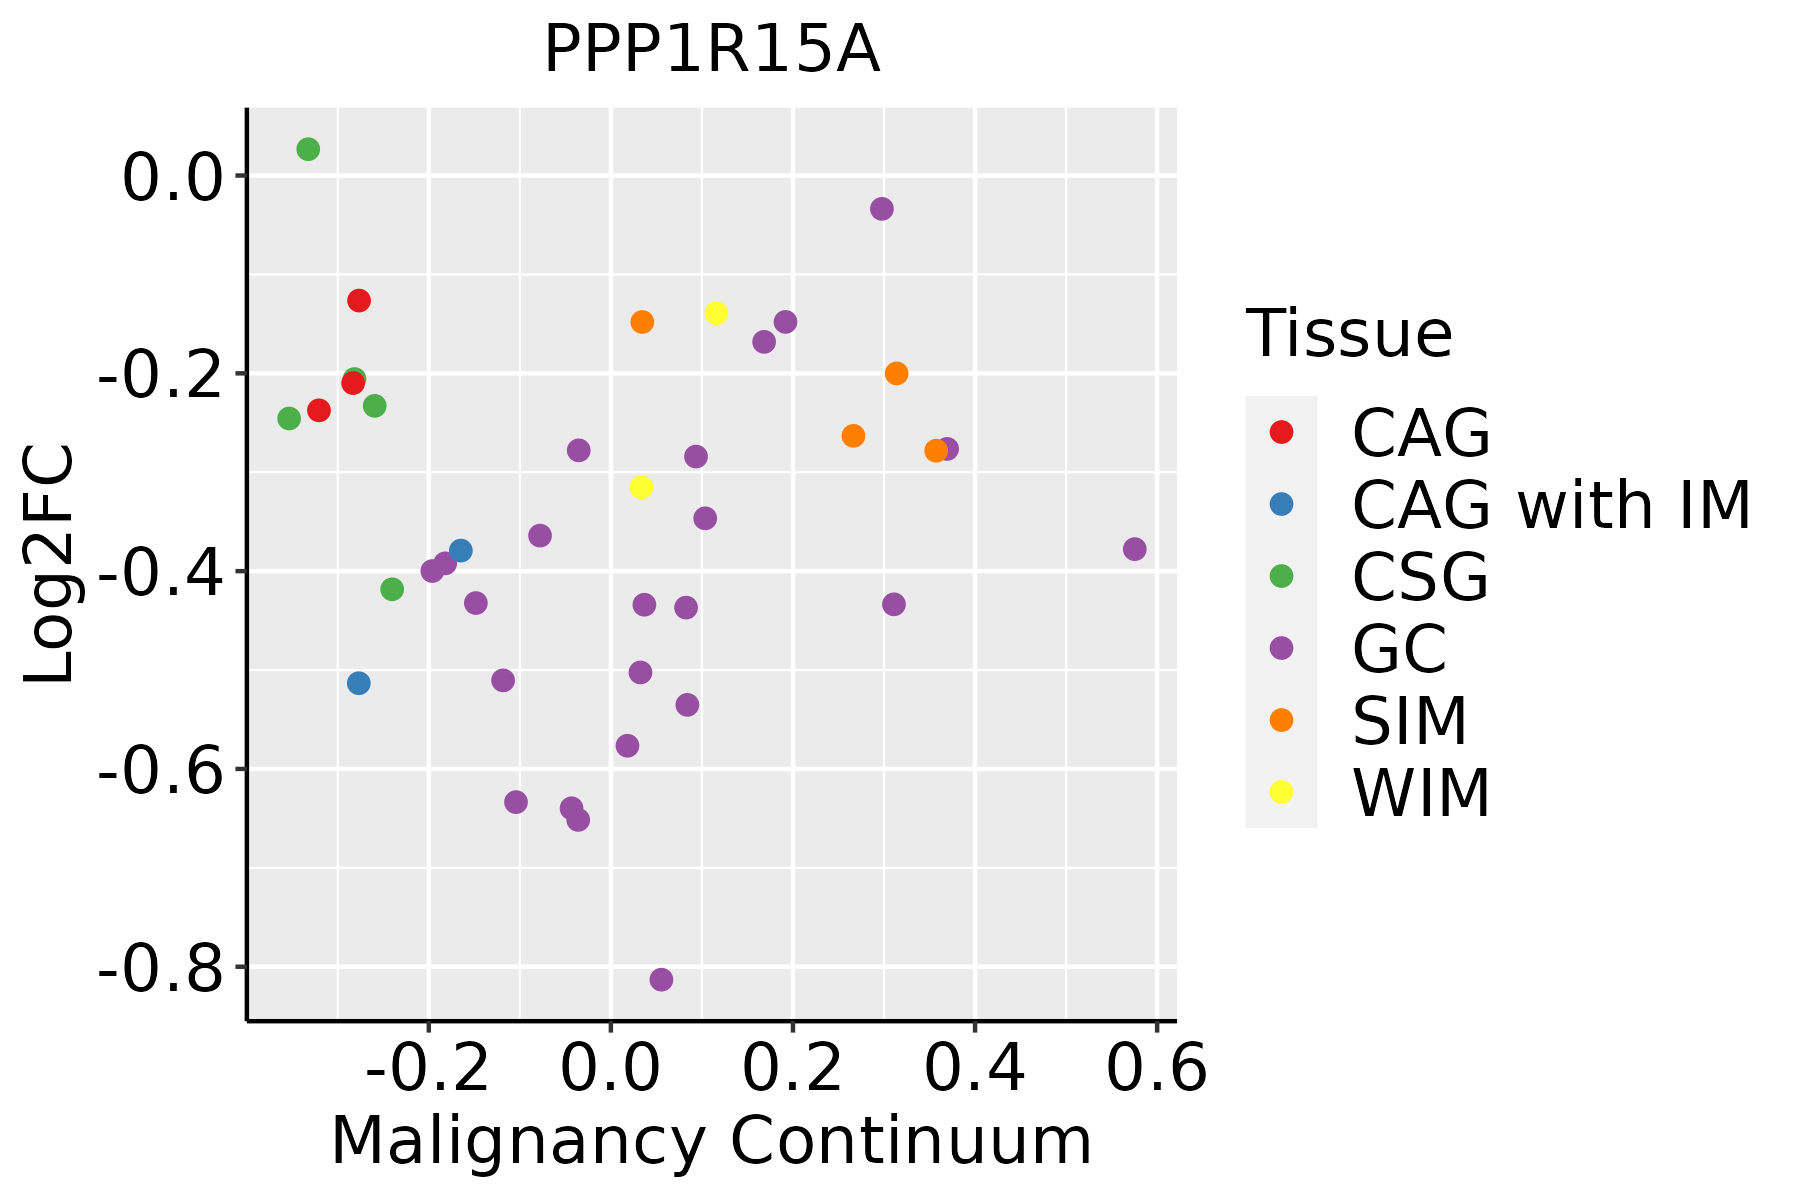 | CAG: Chronic atrophic gastritis |
| CAG with IM: Chronic atrophic gastritis with intestinal metaplasia |
| CSG: Chronic superficial gastritis |
| GC: Gastric cancer |
| SIM: Severe intestinal metaplasia |
| WIM: Wild intestinal metaplasia |
| Liver | 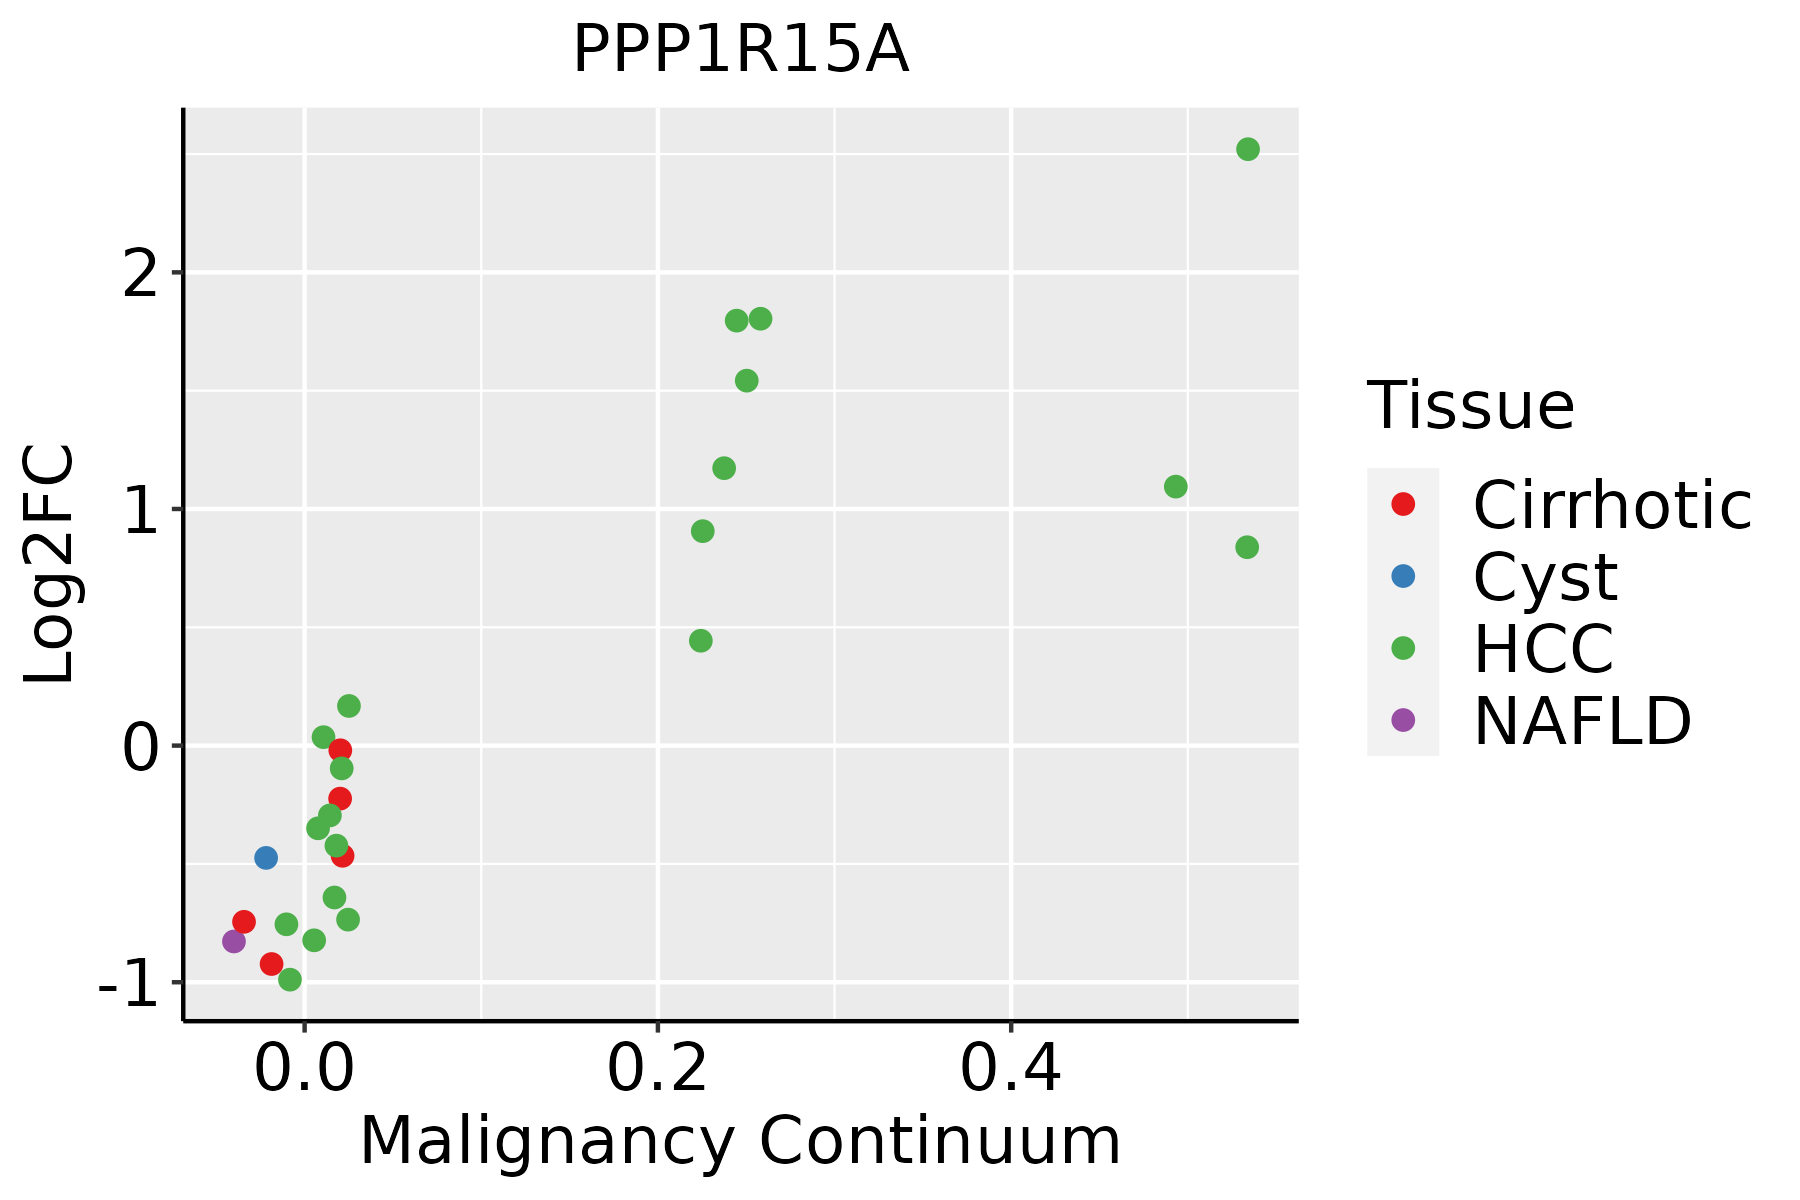 | HCC: Hepatocellular carcinoma |
| NAFLD: Non-alcoholic fatty liver disease |
| Lung | 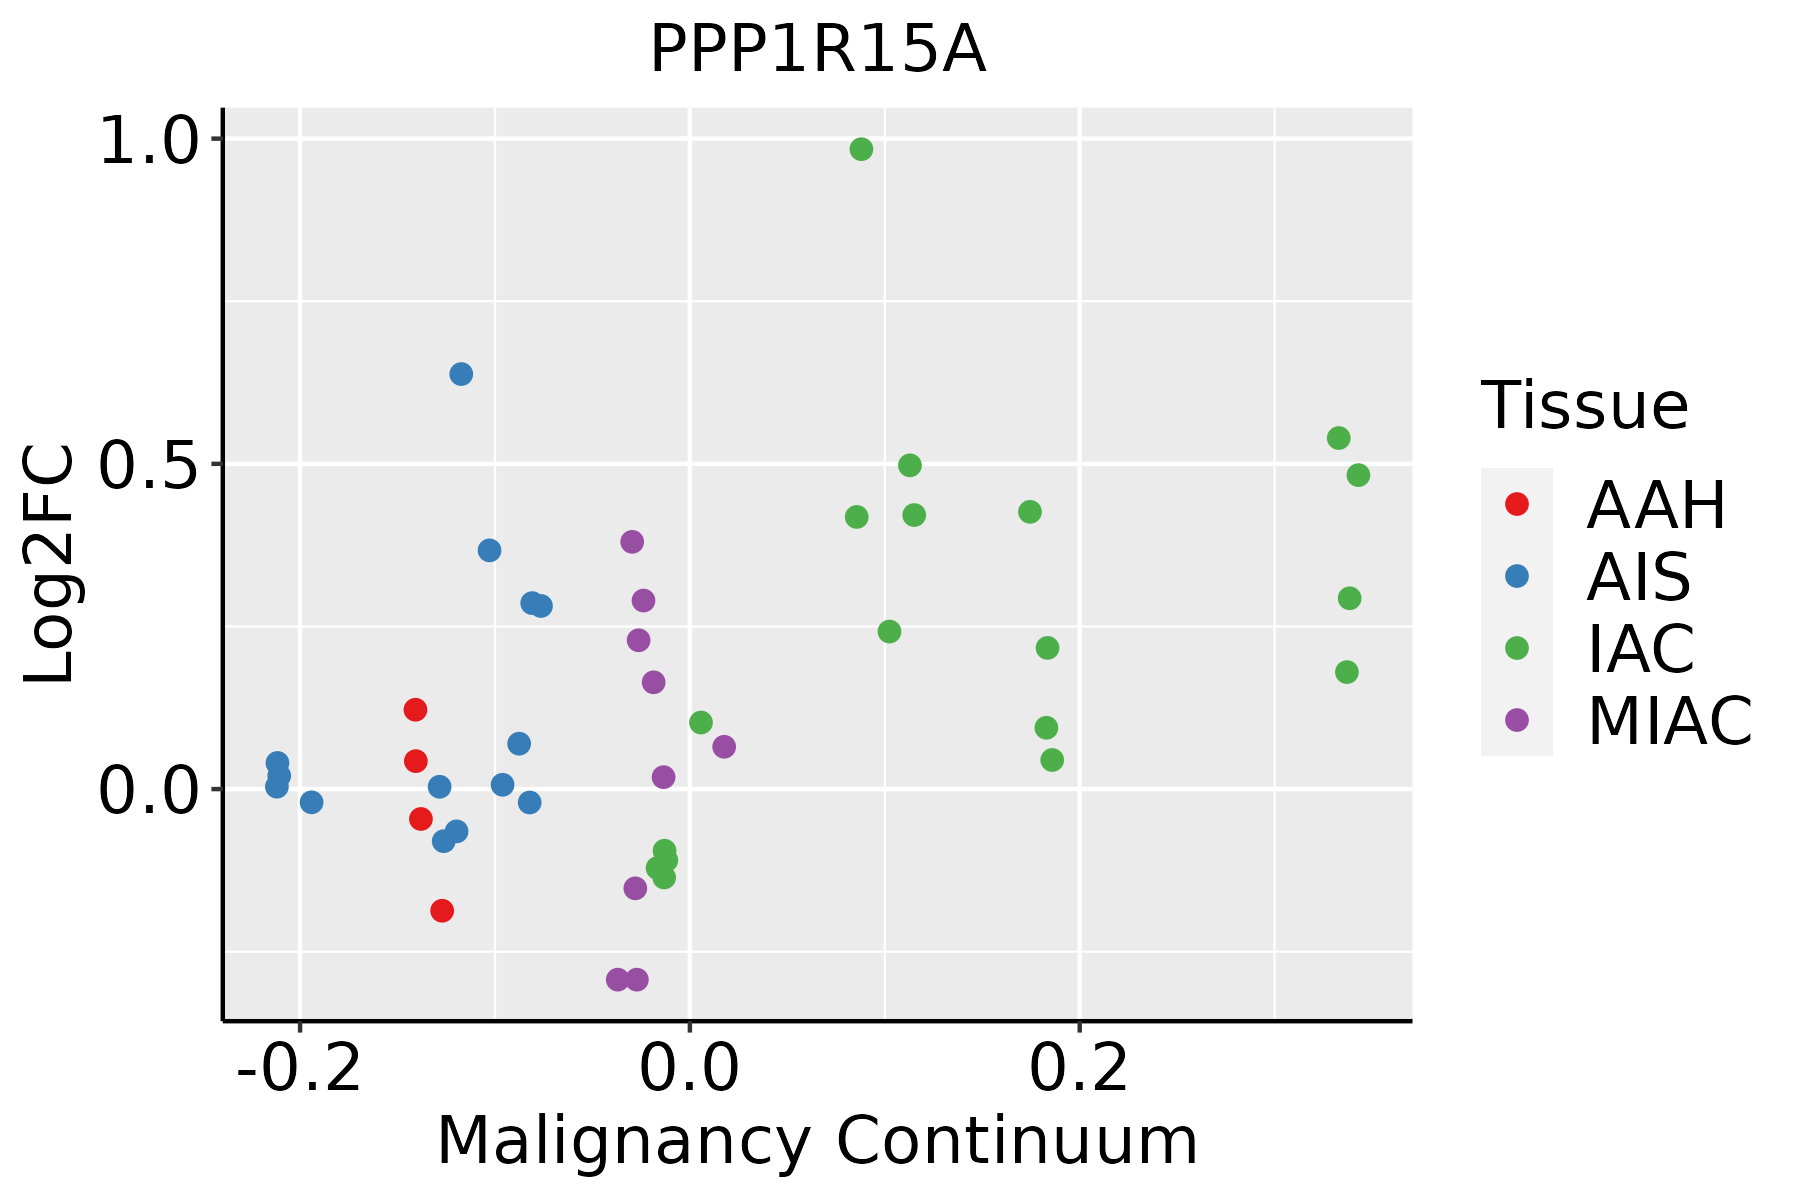 | AAH: Atypical adenomatous hyperplasia |
| AIS: Adenocarcinoma in situ |
| IAC: Invasive lung adenocarcinoma |
| MIA: Minimally invasive adenocarcinoma |
| Oral Cavity |  | EOLP: Erosive Oral lichen planus |
| LP: leukoplakia |
| NEOLP: Non-erosive oral lichen planus |
| OSCC: Oral squamous cell carcinoma |
| Prostate | 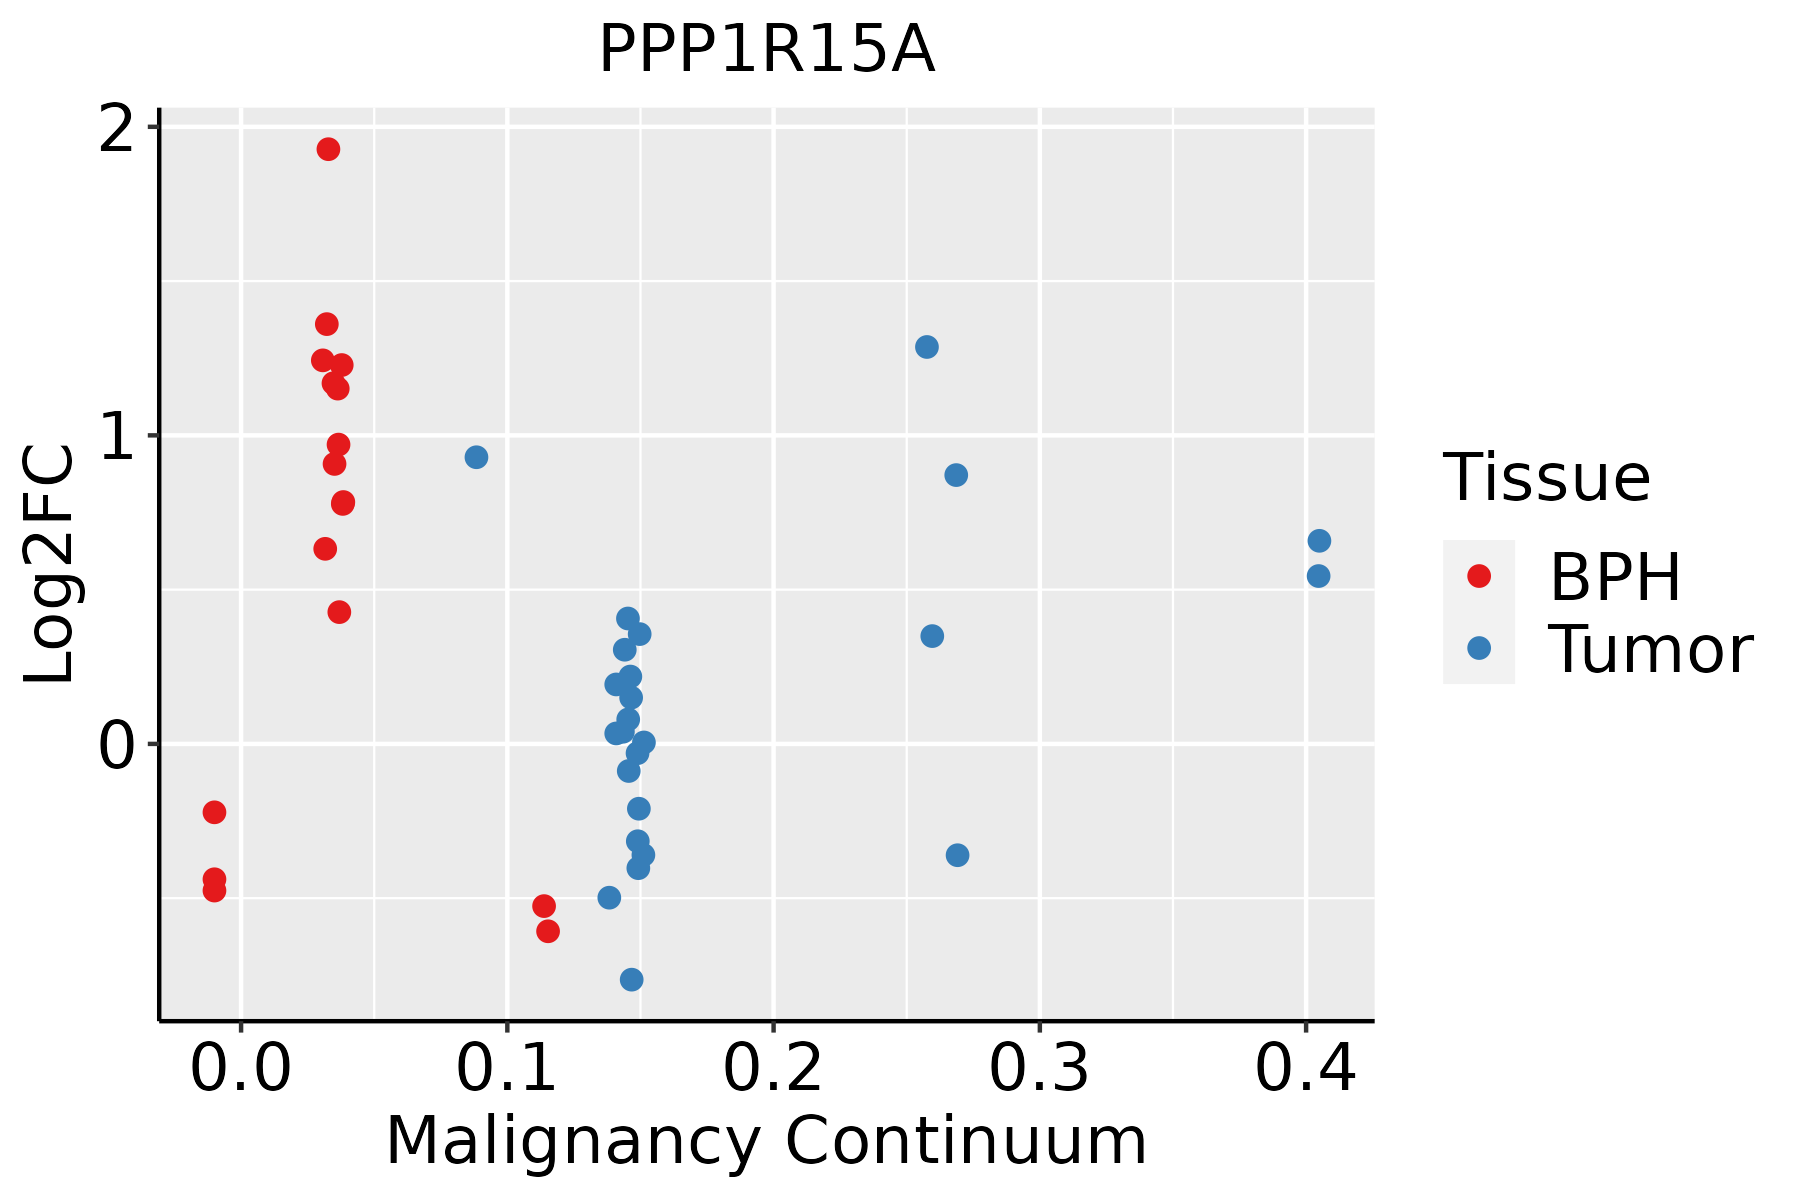 | BPH: Benign Prostatic Hyperplasia |
| Skin |  | AK: Actinic keratosis |
| cSCC: Cutaneous squamous cell carcinoma |
| SCCIS:squamous cell carcinoma in situ |
| Thyroid |  | ATC: Anaplastic thyroid cancer |
| HT: Hashimoto's thyroiditis |
| PTC: Papillary thyroid cancer |
| GO ID | Tissue | Disease Stage | Description | Gene Ratio | Bg Ratio | pvalue | p.adjust | Count |
| GO:1905897110 | Oral cavity | LP | regulation of response to endoplasmic reticulum stress | 45/4623 | 82/18723 | 4.58e-09 | 1.91e-07 | 45 |
| GO:000698415 | Oral cavity | LP | ER-nucleus signaling pathway | 30/4623 | 46/18723 | 7.25e-09 | 2.91e-07 | 30 |
| GO:007097217 | Oral cavity | LP | protein localization to endoplasmic reticulum | 41/4623 | 74/18723 | 1.52e-08 | 5.63e-07 | 41 |
| GO:003096816 | Oral cavity | LP | endoplasmic reticulum unfolded protein response | 38/4623 | 74/18723 | 6.96e-07 | 1.85e-05 | 38 |
| GO:0010563110 | Oral cavity | LP | negative regulation of phosphorus metabolic process | 153/4623 | 442/18723 | 1.47e-06 | 3.53e-05 | 153 |
| GO:0070059110 | Oral cavity | LP | intrinsic apoptotic signaling pathway in response to endoplasmic reticulum stress | 33/4623 | 63/18723 | 2.09e-06 | 4.76e-05 | 33 |
| GO:0045936110 | Oral cavity | LP | negative regulation of phosphate metabolic process | 152/4623 | 441/18723 | 2.10e-06 | 4.77e-05 | 152 |
| GO:1903573110 | Oral cavity | LP | negative regulation of response to endoplasmic reticulum stress | 25/4623 | 44/18723 | 5.32e-06 | 1.06e-04 | 25 |
| GO:014046712 | Oral cavity | LP | integrated stress response signaling | 15/4623 | 22/18723 | 2.08e-05 | 3.44e-04 | 15 |
| GO:004355512 | Oral cavity | LP | regulation of translation in response to stress | 14/4623 | 20/18723 | 2.51e-05 | 4.04e-04 | 14 |
| GO:003649912 | Oral cavity | LP | PERK-mediated unfolded protein response | 13/4623 | 18/18723 | 2.94e-05 | 4.58e-04 | 13 |
| GO:004355812 | Oral cavity | LP | regulation of translational initiation in response to stress | 11/4623 | 14/18723 | 3.49e-05 | 5.22e-04 | 11 |
| GO:0035303110 | Oral cavity | LP | regulation of dephosphorylation | 52/4623 | 128/18723 | 4.98e-05 | 7.01e-04 | 52 |
| GO:0032535110 | Oral cavity | LP | regulation of cellular component size | 128/4623 | 383/18723 | 6.56e-05 | 8.80e-04 | 128 |
| GO:0035304110 | Oral cavity | LP | regulation of protein dephosphorylation | 39/4623 | 90/18723 | 8.11e-05 | 1.04e-03 | 39 |
| GO:190010114 | Oral cavity | LP | regulation of endoplasmic reticulum unfolded protein response | 16/4623 | 30/18723 | 7.00e-04 | 6.31e-03 | 16 |
| GO:003649012 | Oral cavity | LP | regulation of translation in response to endoplasmic reticulum stress | 8/4623 | 11/18723 | 1.08e-03 | 9.01e-03 | 8 |
| GO:190389712 | Oral cavity | LP | regulation of PERK-mediated unfolded protein response | 8/4623 | 11/18723 | 1.08e-03 | 9.01e-03 | 8 |
| GO:005134619 | Oral cavity | LP | negative regulation of hydrolase activity | 120/4623 | 379/18723 | 1.16e-03 | 9.48e-03 | 120 |
| GO:000647016 | Oral cavity | LP | protein dephosphorylation | 89/4623 | 281/18723 | 4.60e-03 | 2.93e-02 | 89 |
| Pathway ID | Tissue | Disease Stage | Description | Gene Ratio | Bg Ratio | pvalue | p.adjust | qvalue | Count |
| hsa0414118 | Breast | Precancer | Protein processing in endoplasmic reticulum | 33/684 | 174/8465 | 2.78e-06 | 3.83e-05 | 2.94e-05 | 33 |
| hsa0414119 | Breast | Precancer | Protein processing in endoplasmic reticulum | 33/684 | 174/8465 | 2.78e-06 | 3.83e-05 | 2.94e-05 | 33 |
| hsa0414124 | Breast | IDC | Protein processing in endoplasmic reticulum | 36/867 | 174/8465 | 2.73e-05 | 2.86e-04 | 2.14e-04 | 36 |
| hsa0414134 | Breast | IDC | Protein processing in endoplasmic reticulum | 36/867 | 174/8465 | 2.73e-05 | 2.86e-04 | 2.14e-04 | 36 |
| hsa0414143 | Breast | DCIS | Protein processing in endoplasmic reticulum | 36/846 | 174/8465 | 1.60e-05 | 1.91e-04 | 1.41e-04 | 36 |
| hsa0414153 | Breast | DCIS | Protein processing in endoplasmic reticulum | 36/846 | 174/8465 | 1.60e-05 | 1.91e-04 | 1.41e-04 | 36 |
| hsa0414120 | Cervix | CC | Protein processing in endoplasmic reticulum | 55/1267 | 174/8465 | 1.74e-08 | 2.68e-07 | 1.58e-07 | 55 |
| hsa04141110 | Cervix | CC | Protein processing in endoplasmic reticulum | 55/1267 | 174/8465 | 1.74e-08 | 2.68e-07 | 1.58e-07 | 55 |
| hsa0414125 | Cervix | HSIL_HPV | Protein processing in endoplasmic reticulum | 21/459 | 174/8465 | 4.54e-04 | 3.80e-03 | 3.07e-03 | 21 |
| hsa0414135 | Cervix | HSIL_HPV | Protein processing in endoplasmic reticulum | 21/459 | 174/8465 | 4.54e-04 | 3.80e-03 | 3.07e-03 | 21 |
| hsa0414126 | Endometrium | AEH | Protein processing in endoplasmic reticulum | 62/1197 | 174/8465 | 5.97e-13 | 1.39e-11 | 1.01e-11 | 62 |
| hsa04141111 | Endometrium | AEH | Protein processing in endoplasmic reticulum | 62/1197 | 174/8465 | 5.97e-13 | 1.39e-11 | 1.01e-11 | 62 |
| hsa0414127 | Endometrium | EEC | Protein processing in endoplasmic reticulum | 64/1237 | 174/8465 | 2.17e-13 | 5.09e-12 | 3.80e-12 | 64 |
| hsa0414136 | Endometrium | EEC | Protein processing in endoplasmic reticulum | 64/1237 | 174/8465 | 2.17e-13 | 5.09e-12 | 3.80e-12 | 64 |
| hsa0414139 | Esophagus | HGIN | Protein processing in endoplasmic reticulum | 67/1383 | 174/8465 | 1.06e-12 | 2.16e-11 | 1.72e-11 | 67 |
| hsa04141114 | Esophagus | HGIN | Protein processing in endoplasmic reticulum | 67/1383 | 174/8465 | 1.06e-12 | 2.16e-11 | 1.72e-11 | 67 |
| hsa04141211 | Esophagus | ESCC | Protein processing in endoplasmic reticulum | 147/4205 | 174/8465 | 3.29e-22 | 1.10e-19 | 5.64e-20 | 147 |
| hsa04141310 | Esophagus | ESCC | Protein processing in endoplasmic reticulum | 147/4205 | 174/8465 | 3.29e-22 | 1.10e-19 | 5.64e-20 | 147 |
| hsa0414114 | Liver | Cirrhotic | Protein processing in endoplasmic reticulum | 114/2530 | 174/8465 | 1.16e-22 | 9.67e-21 | 5.96e-21 | 114 |
| hsa0414115 | Liver | Cirrhotic | Protein processing in endoplasmic reticulum | 114/2530 | 174/8465 | 1.16e-22 | 9.67e-21 | 5.96e-21 | 114 |
| Hugo Symbol | Variant Class | Variant Classification | dbSNP RS | HGVSc | HGVSp | HGVSp Short | SWISSPROT | BIOTYPE | SIFT | PolyPhen | Tumor Sample Barcode | Tissue | Histology | Sex | Age | Stage | Therapy Types | Drugs | Outcome |
| PPP1R15A | SNV | Missense_Mutation | novel | c.682N>A | p.Glu228Lys | p.E228K | O75807 | protein_coding | deleterious(0.03) | probably_damaging(0.914) | TCGA-AR-A2LE-01 | Breast | breast invasive carcinoma | Female | >=65 | I/II | Hormone Therapy | tamoxiphen | PD |
| PPP1R15A | SNV | Missense_Mutation | novel | c.776N>T | p.Ser259Phe | p.S259F | O75807 | protein_coding | deleterious(0) | benign(0.087) | TCGA-GM-A2DF-01 | Breast | breast invasive carcinoma | Female | <65 | I/II | Chemotherapy | taxol | CR |
| PPP1R15A | insertion | Nonsense_Mutation | novel | c.2017_2018insATAATGAATAAATAAATAAATAAATA | p.Arg673HisfsTer4 | p.R673Hfs*4 | O75807 | protein_coding | | | TCGA-B6-A0IB-01 | Breast | breast invasive carcinoma | Female | <65 | III/IV | Unknown | Unknown | PD |
| PPP1R15A | deletion | Frame_Shift_Del | rs764798313 | c.996delN | p.Pro334HisfsTer6 | p.P334Hfs*6 | O75807 | protein_coding | | | TCGA-BH-A18G-01 | Breast | breast invasive carcinoma | Female | >=65 | I/II | Unknown | Unknown | SD |
| PPP1R15A | deletion | Frame_Shift_Del | | c.1977_1992delNNNNNNNNNNNNNNNN | p.Ser660LeufsTer26 | p.S660Lfs*26 | O75807 | protein_coding | | | TCGA-D8-A13Z-01 | Breast | breast invasive carcinoma | Female | <65 | I/II | Chemotherapy | doxorubicine | SD |
| PPP1R15A | SNV | Missense_Mutation | novel | c.545C>T | p.Ser182Leu | p.S182L | O75807 | protein_coding | deleterious(0.03) | possibly_damaging(0.588) | TCGA-C5-A2LV-01 | Cervix | cervical & endocervical cancer | Female | <65 | I/II | Unknown | Unknown | SD |
| PPP1R15A | SNV | Missense_Mutation | | c.1412C>T | p.Ser471Phe | p.S471F | O75807 | protein_coding | deleterious(0.04) | benign(0.038) | TCGA-Q1-A5R2-01 | Cervix | cervical & endocervical cancer | Female | <65 | I/II | Chemotherapy | cisplatin | PR |
| PPP1R15A | SNV | Missense_Mutation | | c.403N>A | p.Ala135Thr | p.A135T | O75807 | protein_coding | tolerated(1) | benign(0.003) | TCGA-A6-4105-01 | Colorectum | colon adenocarcinoma | Male | >=65 | I/II | Unknown | Unknown | PD |
| PPP1R15A | SNV | Missense_Mutation | novel | c.849N>T | p.Glu283Asp | p.E283D | O75807 | protein_coding | tolerated(0.42) | benign(0.003) | TCGA-AA-3877-01 | Colorectum | colon adenocarcinoma | Female | >=65 | I/II | Unknown | Unknown | SD |
| PPP1R15A | SNV | Missense_Mutation | | c.697G>A | p.Glu233Lys | p.E233K | O75807 | protein_coding | tolerated(0.06) | possibly_damaging(0.876) | TCGA-AA-A00N-01 | Colorectum | colon adenocarcinoma | Male | >=65 | I/II | Unknown | Unknown | PD |


