
|
|||||
|
 | |
| |
| |
| |
| |
| |
|
Gene: PARN |
Gene summary for PARN |
| Gene information | Species | Human | Gene symbol | PARN | Gene ID | 5073 |
| Gene name | poly(A)-specific ribonuclease | |
| Gene Alias | DAN | |
| Cytomap | 16p13.12 | |
| Gene Type | protein-coding | GO ID | GO:0000003 | UniProtAcc | B3KN69 |
Top |
Malignant transformation analysis |
| Identification of the aberrant gene expression in precancerous and cancerous lesions by comparing the gene expression of stem-like cells in diseased tissues with normal stem cells |
| Entrez ID | Symbol | Replicates | Species | Organ | Tissue | Adj P-value | Log2FC | Malignancy |
| 5073 | PARN | CCI_2 | Human | Cervix | CC | 1.77e-06 | 6.79e-01 | 0.5249 |
| 5073 | PARN | CCI_3 | Human | Cervix | CC | 5.32e-03 | 5.01e-01 | 0.516 |
| 5073 | PARN | HTA11_99999965104_69814 | Human | Colorectum | MSS | 1.28e-03 | 5.37e-01 | 0.281 |
| 5073 | PARN | A015-C-203 | Human | Colorectum | FAP | 1.77e-12 | -2.66e-01 | -0.1294 |
| 5073 | PARN | A002-C-201 | Human | Colorectum | FAP | 4.61e-05 | -2.56e-01 | 0.0324 |
| 5073 | PARN | A001-C-108 | Human | Colorectum | FAP | 5.11e-06 | -1.68e-01 | -0.0272 |
| 5073 | PARN | A002-C-205 | Human | Colorectum | FAP | 7.90e-09 | -2.06e-01 | -0.1236 |
| 5073 | PARN | A015-C-006 | Human | Colorectum | FAP | 5.72e-06 | -1.60e-01 | -0.0994 |
| 5073 | PARN | A015-C-106 | Human | Colorectum | FAP | 3.45e-07 | -1.40e-01 | -0.0511 |
| 5073 | PARN | A002-C-114 | Human | Colorectum | FAP | 4.12e-08 | -2.49e-01 | -0.1561 |
| 5073 | PARN | A015-C-104 | Human | Colorectum | FAP | 5.23e-13 | -2.82e-01 | -0.1899 |
| 5073 | PARN | A001-C-014 | Human | Colorectum | FAP | 7.88e-06 | -1.78e-01 | 0.0135 |
| 5073 | PARN | A002-C-016 | Human | Colorectum | FAP | 7.22e-12 | -2.23e-01 | 0.0521 |
| 5073 | PARN | A015-C-002 | Human | Colorectum | FAP | 3.47e-04 | -2.28e-01 | -0.0763 |
| 5073 | PARN | A001-C-203 | Human | Colorectum | FAP | 2.21e-04 | 5.73e-03 | -0.0481 |
| 5073 | PARN | A002-C-116 | Human | Colorectum | FAP | 5.15e-17 | -2.31e-01 | -0.0452 |
| 5073 | PARN | A014-C-008 | Human | Colorectum | FAP | 2.25e-04 | -2.51e-01 | -0.191 |
| 5073 | PARN | A018-E-020 | Human | Colorectum | FAP | 2.49e-08 | -2.30e-01 | -0.2034 |
| 5073 | PARN | F034 | Human | Colorectum | FAP | 1.42e-09 | -1.92e-01 | -0.0665 |
| 5073 | PARN | CRC-1-8810 | Human | Colorectum | CRC | 1.69e-02 | 7.61e-02 | 0.6257 |
| Page: 1 2 3 4 5 6 7 |
| Tissue | Expression Dynamics | Abbreviation |
| Cervix | 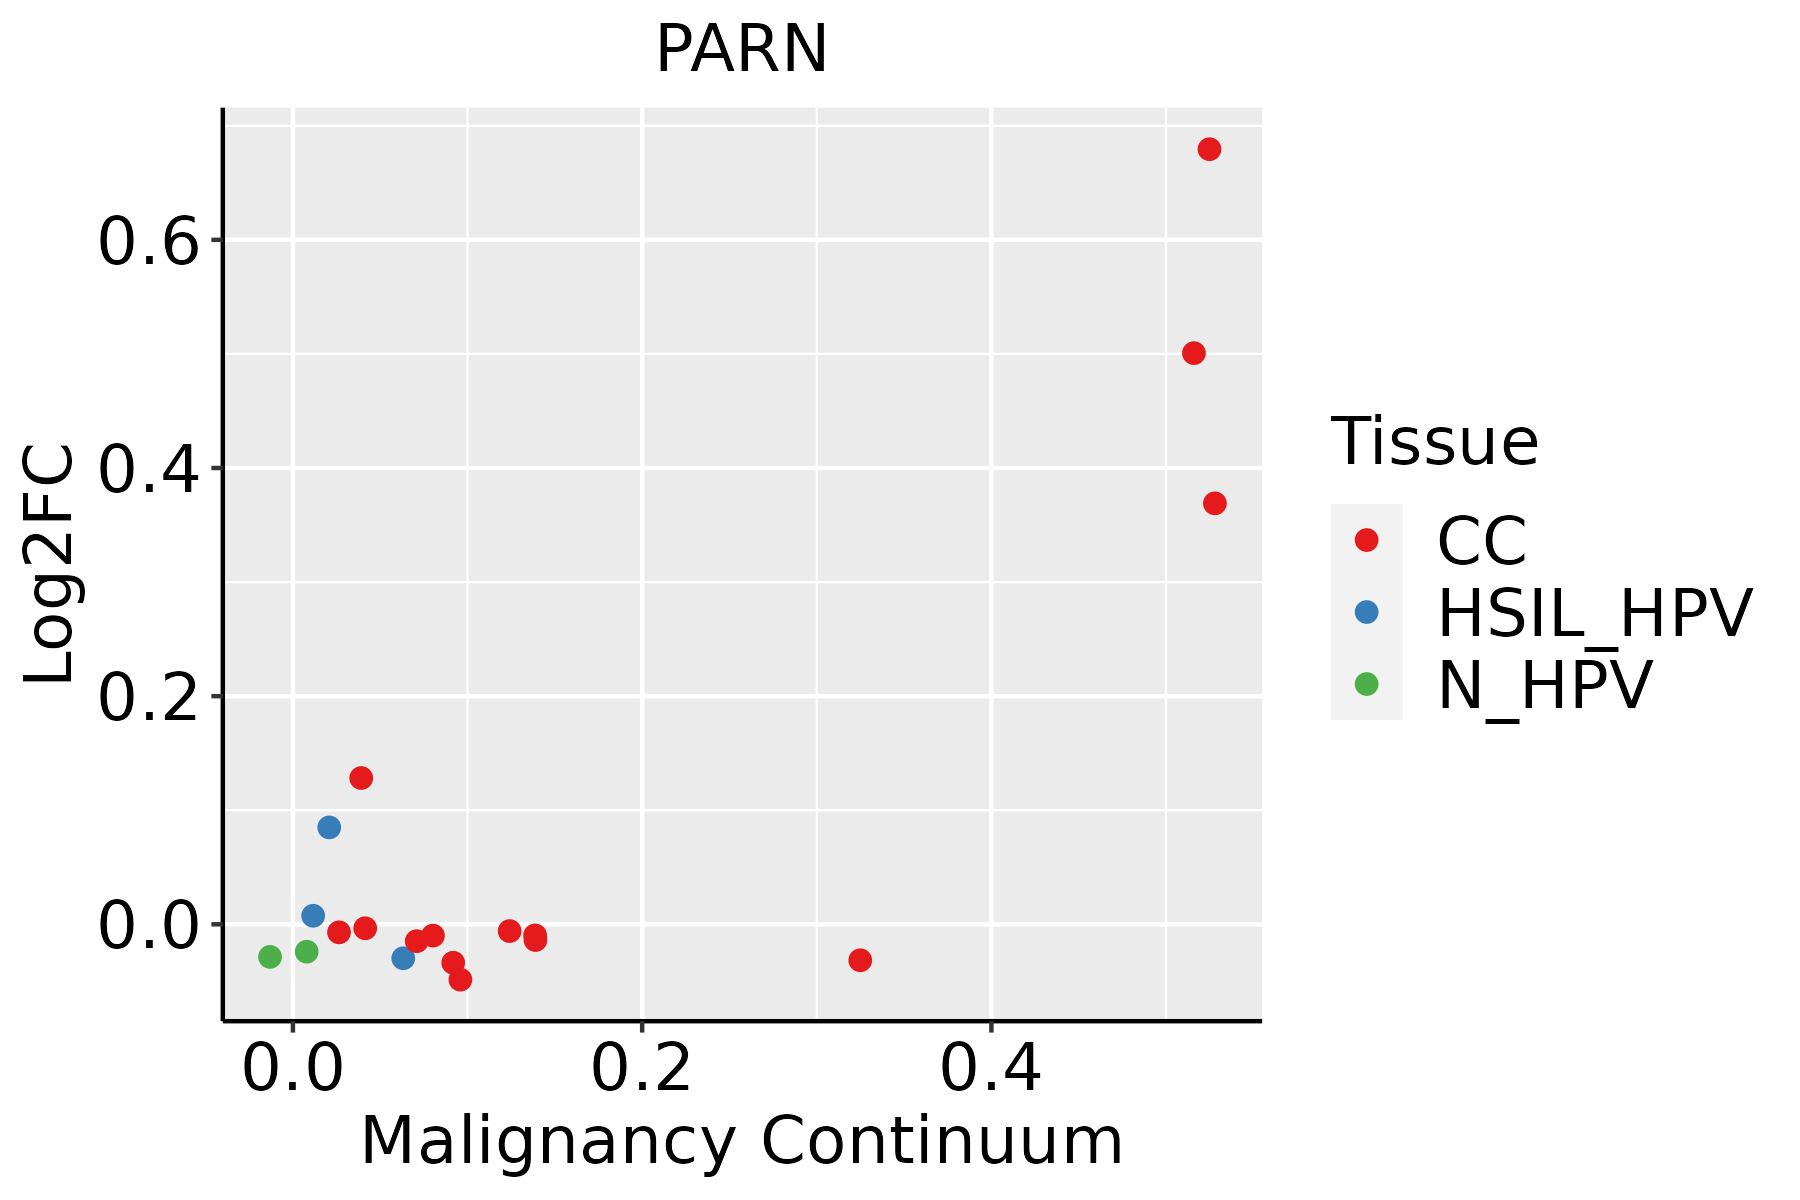 | CC: Cervix cancer |
| HSIL_HPV: HPV-infected high-grade squamous intraepithelial lesions | ||
| N_HPV: HPV-infected normal cervix | ||
| Colorectum (GSE201348) |  | FAP: Familial adenomatous polyposis |
| CRC: Colorectal cancer | ||
| Colorectum (HTA11) |  | AD: Adenomas |
| SER: Sessile serrated lesions | ||
| MSI-H: Microsatellite-high colorectal cancer | ||
| MSS: Microsatellite stable colorectal cancer | ||
| Endometrium | 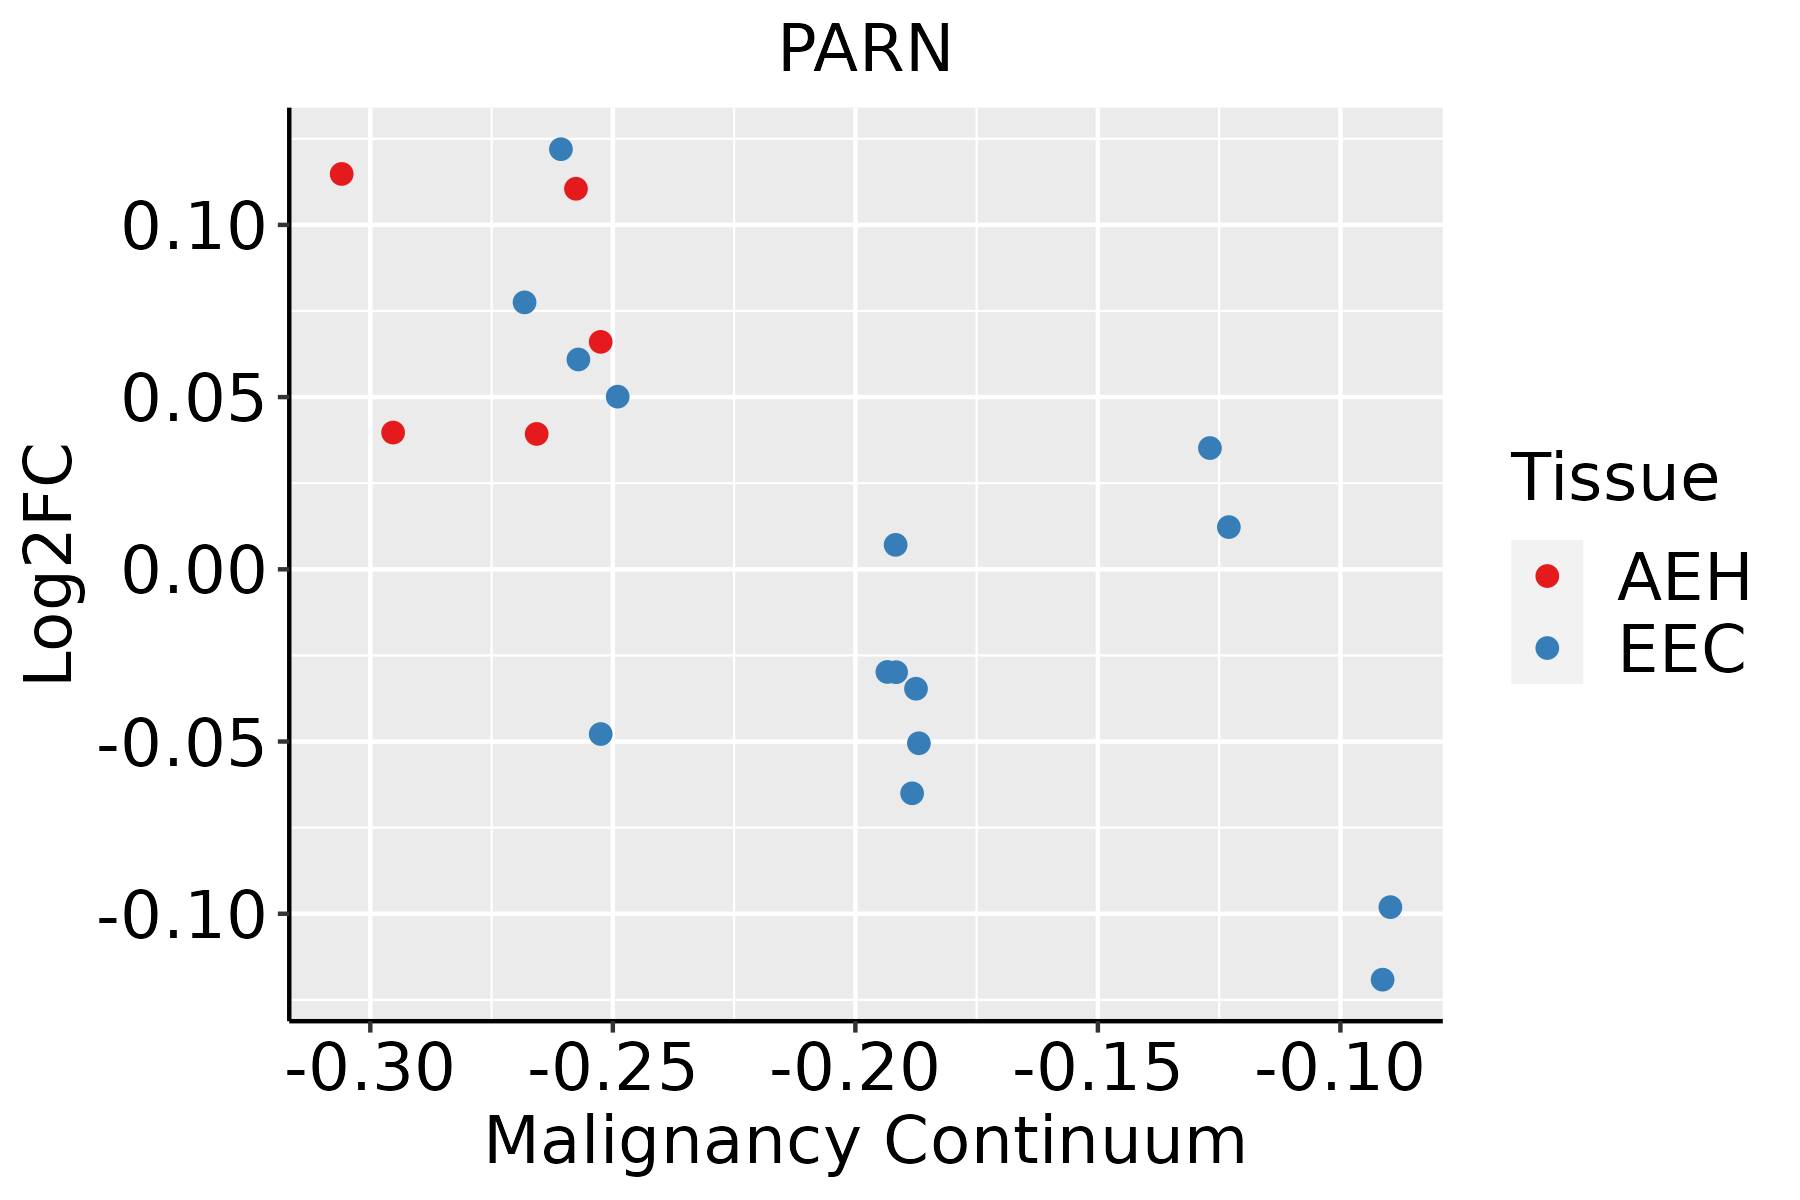 | AEH: Atypical endometrial hyperplasia |
| EEC: Endometrioid Cancer | ||
| Esophagus | 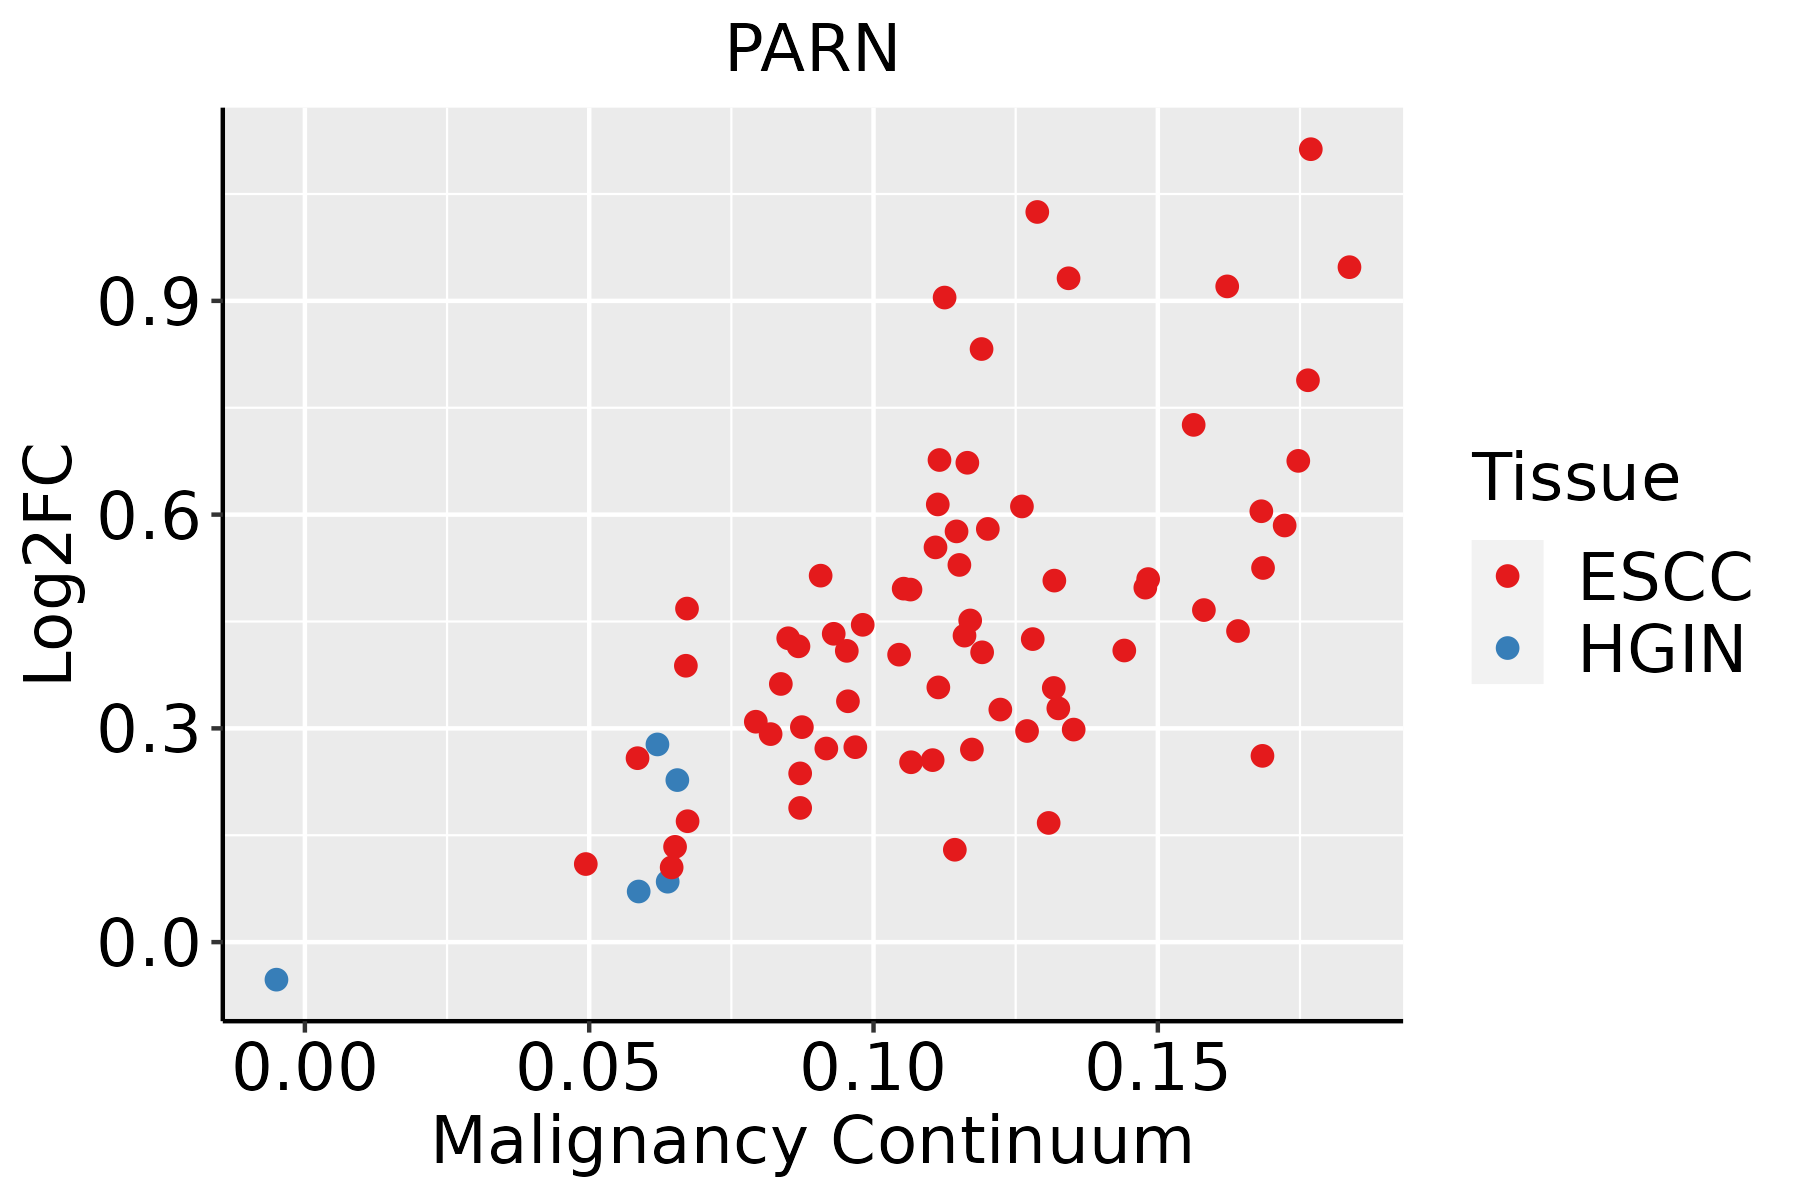 | ESCC: Esophageal squamous cell carcinoma |
| HGIN: High-grade intraepithelial neoplasias | ||
| LGIN: Low-grade intraepithelial neoplasias | ||
| Oral Cavity |  | EOLP: Erosive Oral lichen planus |
| LP: leukoplakia | ||
| NEOLP: Non-erosive oral lichen planus | ||
| OSCC: Oral squamous cell carcinoma | ||
| Skin | 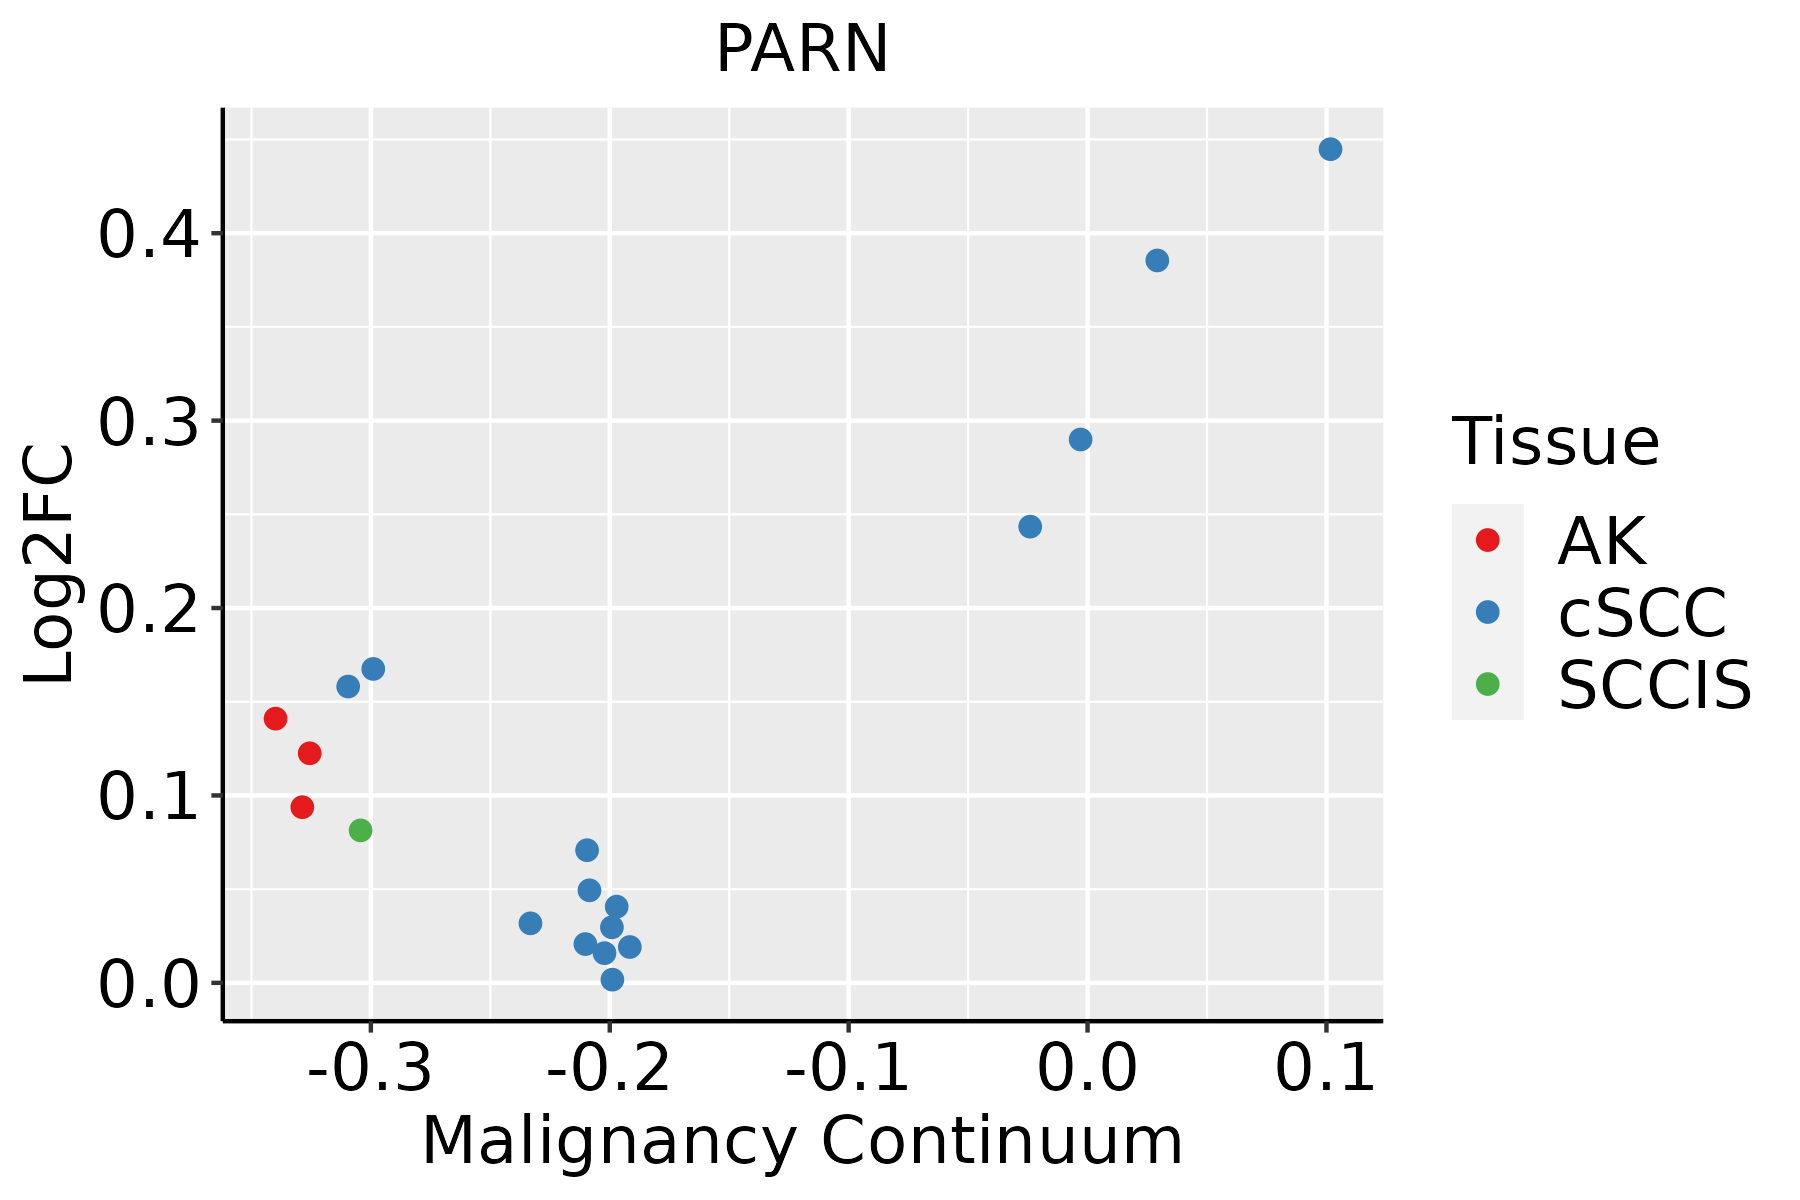 | AK: Actinic keratosis |
| cSCC: Cutaneous squamous cell carcinoma | ||
| SCCIS:squamous cell carcinoma in situ | ||
| Thyroid | 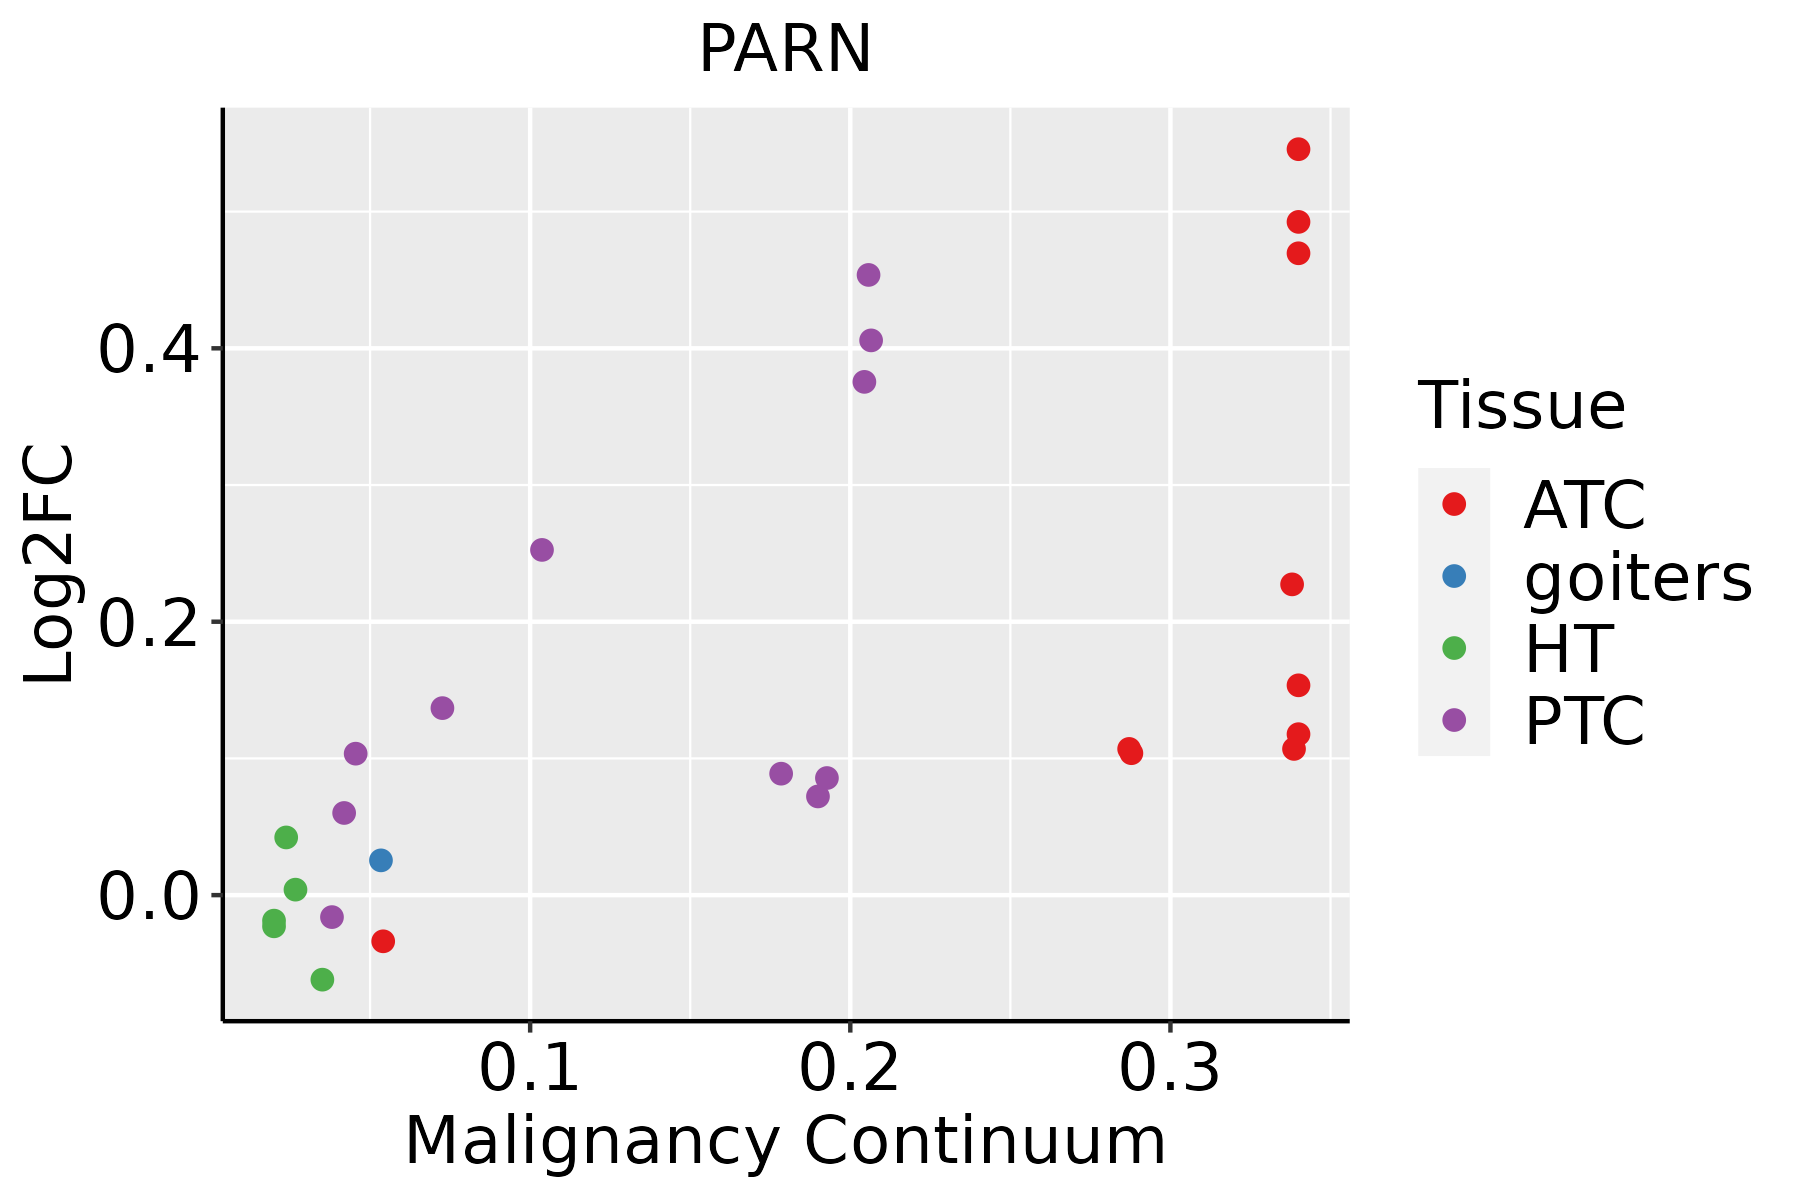 | ATC: Anaplastic thyroid cancer |
| HT: Hashimoto's thyroiditis | ||
| PTC: Papillary thyroid cancer |
| ∗log2FC in expression of this searched gene in stem-like cells from each diseased tissue sample relative to stem-like cells in normal samples in each tissue plotted against the malignancy continuum. Samples are colored based on if they are from different disease stage. |
Top |
Malignant transformation related pathway analysis |
| Find out the enriched GO biological processes and KEGG pathways involved in transition from healthy to precancer to cancer |
| Tissue | Disease Stage | Enriched GO biological Processes |
| Colorectum | AD |  |
| Colorectum | SER |  |
| Colorectum | MSS |  |
| Colorectum | MSI-H |  |
| Colorectum | FAP |  |
| ∗Top 15 enriched GO BP terms are showed in the bar plot of each disease state in each tissue. Each row represents a significant GO biological process which is colored according to the -log10(p.adjust). |
| Page: 1 2 3 4 5 6 7 8 9 |
| GO ID | Tissue | Disease Stage | Description | Gene Ratio | Bg Ratio | pvalue | p.adjust | Count |
| GO:000989625 | Oral cavity | EOLP | positive regulation of catabolic process | 118/2218 | 492/18723 | 2.32e-14 | 9.26e-12 | 118 |
| GO:003133125 | Oral cavity | EOLP | positive regulation of cellular catabolic process | 106/2218 | 427/18723 | 4.63e-14 | 1.63e-11 | 106 |
| GO:006101323 | Oral cavity | EOLP | regulation of mRNA catabolic process | 55/2218 | 166/18723 | 3.70e-13 | 1.11e-10 | 55 |
| GO:000640124 | Oral cavity | EOLP | RNA catabolic process | 77/2218 | 278/18723 | 3.92e-13 | 1.12e-10 | 77 |
| GO:000641726 | Oral cavity | EOLP | regulation of translation | 108/2218 | 468/18723 | 4.04e-12 | 7.34e-10 | 108 |
| GO:004348823 | Oral cavity | EOLP | regulation of mRNA stability | 50/2218 | 158/18723 | 2.91e-11 | 4.15e-09 | 50 |
| GO:000640323 | Oral cavity | EOLP | RNA localization | 57/2218 | 201/18723 | 1.62e-10 | 1.68e-08 | 57 |
| GO:004348723 | Oral cavity | EOLP | regulation of RNA stability | 51/2218 | 170/18723 | 1.63e-10 | 1.68e-08 | 51 |
| GO:190331323 | Oral cavity | EOLP | positive regulation of mRNA metabolic process | 40/2218 | 118/18723 | 2.69e-10 | 2.45e-08 | 40 |
| GO:003465523 | Oral cavity | EOLP | nucleobase-containing compound catabolic process | 89/2218 | 407/18723 | 5.47e-09 | 2.92e-07 | 89 |
| GO:003133025 | Oral cavity | EOLP | negative regulation of cellular catabolic process | 64/2218 | 262/18723 | 9.72e-09 | 4.77e-07 | 64 |
| GO:003304422 | Oral cavity | EOLP | regulation of chromosome organization | 50/2218 | 187/18723 | 1.80e-08 | 7.94e-07 | 50 |
| GO:000989525 | Oral cavity | EOLP | negative regulation of catabolic process | 73/2218 | 320/18723 | 2.07e-08 | 8.84e-07 | 73 |
| GO:004670023 | Oral cavity | EOLP | heterocycle catabolic process | 93/2218 | 445/18723 | 2.61e-08 | 1.08e-06 | 93 |
| GO:004427023 | Oral cavity | EOLP | cellular nitrogen compound catabolic process | 92/2218 | 451/18723 | 1.01e-07 | 3.45e-06 | 92 |
| GO:000095623 | Oral cavity | EOLP | nuclear-transcribed mRNA catabolic process | 33/2218 | 112/18723 | 4.21e-07 | 1.19e-05 | 33 |
| GO:006101423 | Oral cavity | EOLP | positive regulation of mRNA catabolic process | 28/2218 | 87/18723 | 4.26e-07 | 1.19e-05 | 28 |
| GO:001943923 | Oral cavity | EOLP | aromatic compound catabolic process | 92/2218 | 467/18723 | 5.23e-07 | 1.40e-05 | 92 |
| GO:005105222 | Oral cavity | EOLP | regulation of DNA metabolic process | 75/2218 | 359/18723 | 5.81e-07 | 1.53e-05 | 75 |
| GO:000072322 | Oral cavity | EOLP | telomere maintenance | 36/2218 | 131/18723 | 8.39e-07 | 2.10e-05 | 36 |
| Page: 1 2 3 4 5 6 7 8 9 10 11 12 13 14 15 16 17 18 19 20 21 22 23 24 25 26 27 28 29 30 31 32 33 34 35 |
| Pathway ID | Tissue | Disease Stage | Description | Gene Ratio | Bg Ratio | pvalue | p.adjust | qvalue | Count |
| hsa0301824 | Esophagus | ESCC | RNA degradation | 62/4205 | 79/8465 | 1.18e-07 | 9.39e-07 | 4.81e-07 | 62 |
| hsa0301834 | Esophagus | ESCC | RNA degradation | 62/4205 | 79/8465 | 1.18e-07 | 9.39e-07 | 4.81e-07 | 62 |
| hsa030189 | Oral cavity | OSCC | RNA degradation | 59/3704 | 79/8465 | 2.05e-08 | 1.91e-07 | 9.70e-08 | 59 |
| hsa0301814 | Oral cavity | OSCC | RNA degradation | 59/3704 | 79/8465 | 2.05e-08 | 1.91e-07 | 9.70e-08 | 59 |
| hsa0301841 | Oral cavity | EOLP | RNA degradation | 22/1218 | 79/8465 | 1.33e-03 | 4.80e-03 | 2.83e-03 | 22 |
| hsa0301851 | Oral cavity | EOLP | RNA degradation | 22/1218 | 79/8465 | 1.33e-03 | 4.80e-03 | 2.83e-03 | 22 |
| hsa0301861 | Oral cavity | NEOLP | RNA degradation | 18/1112 | 79/8465 | 1.25e-02 | 4.06e-02 | 2.56e-02 | 18 |
| hsa0301871 | Oral cavity | NEOLP | RNA degradation | 18/1112 | 79/8465 | 1.25e-02 | 4.06e-02 | 2.56e-02 | 18 |
| Page: 1 |
Top |
Cell-cell communication analysis |
| Identification of potential cell-cell interactions between two cell types and their ligand-receptor pairs for different disease states |
| Ligand | Receptor | LRpair | Pathway | Tissue | Disease Stage |
| Page: 1 |
Top |
Single-cell gene regulatory network inference analysis |
| Find out the significant the regulons (TFs) and the target genes of each regulon across cell types for different disease states |
| TF | Cell Type | Tissue | Disease Stage | Target Gene | RSS | Regulon Activity |
| ∗The dot plots of a searched regulon are shown for all cell subpopulations in each disease state of each tissue based on the regulon specific score inferred using pySCENIC and by calculating the average expression. |
| Page: 1 |
Top |
Somatic mutation of malignant transformation related genes |
| Annotation of somatic variants for genes involved in malignant transformation |
| Hugo Symbol | Variant Class | Variant Classification | dbSNP RS | HGVSc | HGVSp | HGVSp Short | SWISSPROT | BIOTYPE | SIFT | PolyPhen | Tumor Sample Barcode | Tissue | Histology | Sex | Age | Stage | Therapy Types | Drugs | Outcome |
| PARN | SNV | Missense_Mutation | rs766730789 | c.1416N>C | p.Gln472His | p.Q472H | O95453 | protein_coding | tolerated(0.31) | benign(0.001) | TCGA-C8-A12K-01 | Breast | breast invasive carcinoma | Female | >=65 | I/II | Unknown | Unknown | SD |
| PARN | insertion | Frame_Shift_Ins | novel | c.244_245insGGTTT | p.Lys82ArgfsTer5 | p.K82Rfs*5 | O95453 | protein_coding | TCGA-A8-A07U-01 | Breast | breast invasive carcinoma | Female | >=65 | III/IV | Chemotherapy | 5-fluorouracil | SD | ||
| PARN | insertion | Nonsense_Mutation | novel | c.243_244insGAGACAGACAGACAGATATGAGAACATG | p.Lys82GlufsTer7 | p.K82Efs*7 | O95453 | protein_coding | TCGA-A8-A07U-01 | Breast | breast invasive carcinoma | Female | >=65 | III/IV | Chemotherapy | 5-fluorouracil | SD | ||
| PARN | SNV | Missense_Mutation | c.1805N>T | p.Ser602Leu | p.S602L | O95453 | protein_coding | tolerated_low_confidence(0.25) | benign(0) | TCGA-BI-A0VR-01 | Cervix | cervical & endocervical cancer | Female | <65 | III/IV | Unknown | Unknown | SD | |
| PARN | SNV | Missense_Mutation | novel | c.82N>C | p.Asp28His | p.D28H | O95453 | protein_coding | deleterious(0) | probably_damaging(1) | TCGA-C5-A1MH-01 | Cervix | cervical & endocervical cancer | Female | >=65 | III/IV | Chemotherapy | cisplatin | PD |
| PARN | SNV | Missense_Mutation | novel | c.1504N>C | p.Glu502Gln | p.E502Q | O95453 | protein_coding | tolerated(0.07) | possibly_damaging(0.645) | TCGA-HM-A4S6-01 | Cervix | cervical & endocervical cancer | Female | <65 | III/IV | Chemotherapy | cisplatin | CR |
| PARN | insertion | Frame_Shift_Ins | novel | c.195_196insAGGAT | p.Leu66ArgfsTer21 | p.L66Rfs*21 | O95453 | protein_coding | TCGA-DS-A1OB-01 | Cervix | cervical & endocervical cancer | Female | <65 | I/II | Chemotherapy | carboplatin | PD | ||
| PARN | SNV | Missense_Mutation | c.1423N>C | p.Trp475Arg | p.W475R | O95453 | protein_coding | deleterious(0) | probably_damaging(0.997) | TCGA-A6-2686-01 | Colorectum | colon adenocarcinoma | Female | >=65 | I/II | Unknown | Unknown | SD | |
| PARN | SNV | Missense_Mutation | novel | c.211N>A | p.Leu71Ile | p.L71I | O95453 | protein_coding | deleterious(0.01) | possibly_damaging(0.716) | TCGA-A6-5665-01 | Colorectum | colon adenocarcinoma | Female | >=65 | I/II | Unknown | Unknown | PD |
| PARN | SNV | Missense_Mutation | c.1557G>T | p.Glu519Asp | p.E519D | O95453 | protein_coding | tolerated(0.24) | benign(0.006) | TCGA-AA-3977-01 | Colorectum | colon adenocarcinoma | Male | >=65 | I/II | Unknown | Unknown | SD |
| Page: 1 2 3 4 5 6 |
Top |
Related drugs of malignant transformation related genes |
| Identification of chemicals and drugs interact with genes involved in malignant transfromation |
| (DGIdb 4.0) |
| Entrez ID | Symbol | Category | Interaction Types | Drug Claim Name | Drug Name | PMIDs |
| Page: 1 |

Copyright 2023-Present -The University of Texas Health Science Center at Houston |