Schematic overview of the cellular and molecular mechanisms involved in the cancer progression, including the proposed cellular and molecular mechanisms in cancer cells trajectory. AT1: alveolar type 1 cells; AT2: alveolar type 2 cells; AAH: atypical adenomatous hyperplasia; AIS: adenocarcinoma in situ; MIA: minimally invasive adenocarcinoma; IA: invasive adenocarcinoma; EMT: epithelial-mesenchymal transition

Home

Download

Statistics

Help

Contact

Center for Computational Systems Medicine
leaf

Gene summary

leaf

Malignant transformation analysis

leaf

Malignant transformation related pathway analysis

leaf

Cell-cell communication analysis

leaf

Single-cell gene regulatory network inference analysis

leaf

Somatic mutation of malignant transformation related genes

leaf

Related drugs of malignant transformation related genes

Gene: MLXIP

Gene summary for MLXIP

check button Gene summary.

Gene informationSpeciesHuman
Gene symbol

MLXIP

Gene ID

22877

Gene nameMLX interacting protein
Gene AliasMIR
Cytomap12q24.31
Gene Typeprotein-coding
GO ID

GO:0006139

UniProtAcc

Q9HAP2


Top

Malignant transformation analysis

check button Identification of the aberrant gene expression in precancerous and cancerous lesions by comparing the gene expression of stem-like cells in diseased tissues with normal stem cells
check button Malignant transformation involving gene list.
Entrez IDSymbolReplicatesSpeciesOrganTissueAdj P-valueLog2FCMalignancy
22877MLXIPHTA11_3410_2000001011HumanColorectumAD2.43e-136.30e-010.0155
22877MLXIPHTA11_2951_2000001011HumanColorectumAD9.74e-088.67e-010.0216
22877MLXIPHTA11_1938_2000001011HumanColorectumAD3.40e-106.98e-01-0.0811
22877MLXIPHTA11_347_2000001011HumanColorectumAD1.56e-311.07e+00-0.1954
22877MLXIPHTA11_3361_2000001011HumanColorectumAD1.22e-056.16e-01-0.1207
22877MLXIPHTA11_83_2000001011HumanColorectumSER2.74e-098.92e-01-0.1526
22877MLXIPHTA11_696_2000001011HumanColorectumAD2.51e-116.81e-01-0.1464
22877MLXIPHTA11_866_2000001011HumanColorectumAD1.08e-054.82e-01-0.1001
22877MLXIPHTA11_1391_2000001011HumanColorectumAD2.78e-035.33e-01-0.059
22877MLXIPHTA11_2992_2000001011HumanColorectumSER3.60e-036.00e-01-0.1706
22877MLXIPHTA11_5212_2000001011HumanColorectumAD1.47e-024.97e-01-0.2061
22877MLXIPHTA11_5216_2000001011HumanColorectumSER4.67e-045.79e-01-0.1462
22877MLXIPHTA11_546_2000001011HumanColorectumAD9.97e-151.02e+00-0.0842
22877MLXIPHTA11_9341_2000001011HumanColorectumSER1.89e-024.64e-01-0.00410000000000005
22877MLXIPHTA11_7862_2000001011HumanColorectumAD7.48e-158.46e-01-0.0179
22877MLXIPHTA11_4255_2000001011HumanColorectumSER9.56e-046.16e-010.0446
22877MLXIPHTA11_9408_2000001011HumanColorectumAD2.77e-118.65e-010.0451
22877MLXIPHTA11_7663_2000001011HumanColorectumSER2.40e-141.19e+000.0131
22877MLXIPHTA11_10623_2000001011HumanColorectumAD1.07e-211.34e+00-0.0177
22877MLXIPHTA11_6801_2000001011HumanColorectumSER1.24e-088.11e-010.0171
Page: 1 2 3 4 5 6 7 8 9 

check button Transcriptomic changes along malignancy continuum.
TissueExpression DynamicsAbbreviation
Colorectum (GSE201348)The image shows the transcriptomic changes along malignancy continuum.log2FC in expression of this searched gene in stem-like cells from each diseased tissue sample relative to stem-like cells in normal samples in each tissue plotted against the malignancy continuum. Samples are colored based on if they are from different disease stage.FAP: Familial adenomatous polyposis
CRC: Colorectal cancer
Colorectum (HTA11)The image shows the transcriptomic changes along malignancy continuum.log2FC in expression of this searched gene in stem-like cells from each diseased tissue sample relative to stem-like cells in normal samples in each tissue plotted against the malignancy continuum. Samples are colored based on if they are from different disease stage.AD: Adenomas
SER: Sessile serrated lesions
MSI-H: Microsatellite-high colorectal cancer
MSS: Microsatellite stable colorectal cancer
EsophagusThe image shows the transcriptomic changes along malignancy continuum.log2FC in expression of this searched gene in stem-like cells from each diseased tissue sample relative to stem-like cells in normal samples in each tissue plotted against the malignancy continuum. Samples are colored based on if they are from different disease stage.
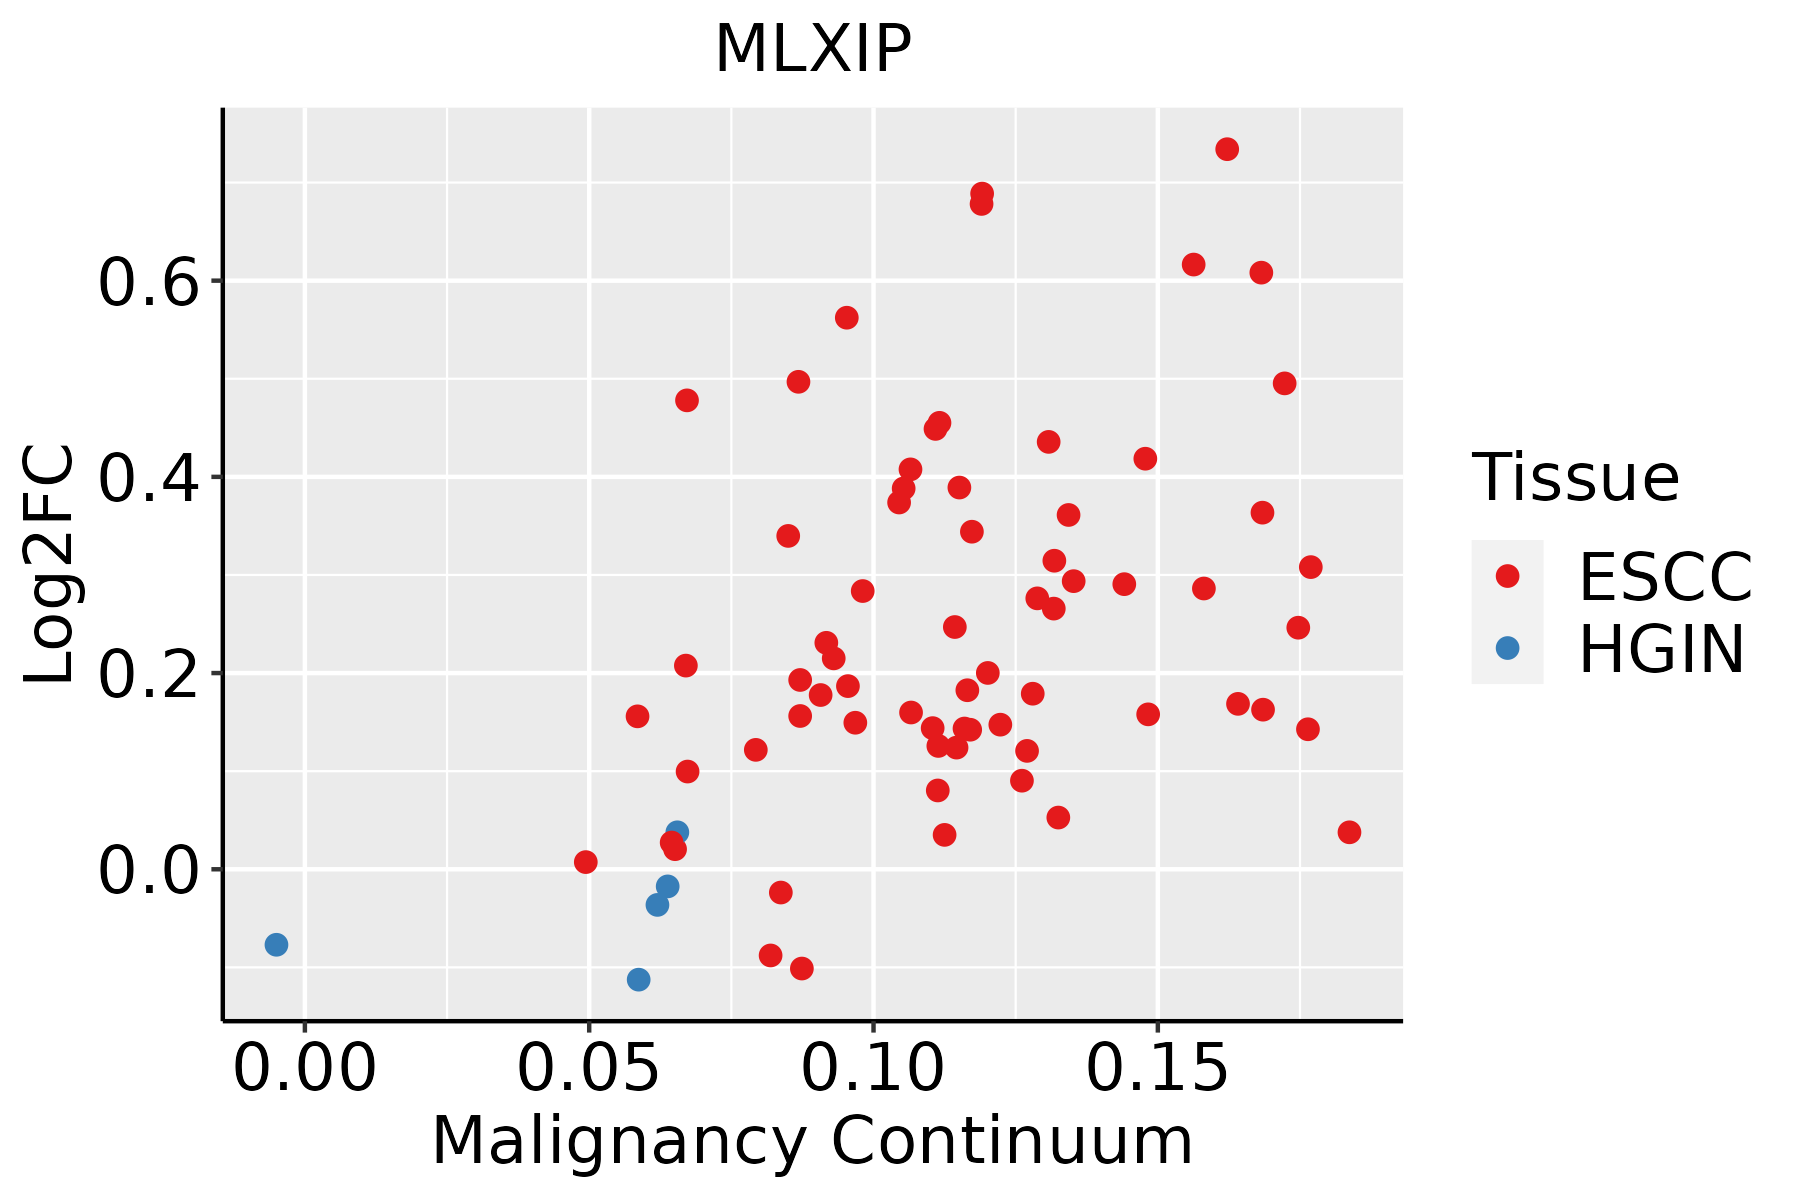
ESCC: Esophageal squamous cell carcinoma
HGIN: High-grade intraepithelial neoplasias
LGIN: Low-grade intraepithelial neoplasias
LiverThe image shows the transcriptomic changes along malignancy continuum.log2FC in expression of this searched gene in stem-like cells from each diseased tissue sample relative to stem-like cells in normal samples in each tissue plotted against the malignancy continuum. Samples are colored based on if they are from different disease stage.
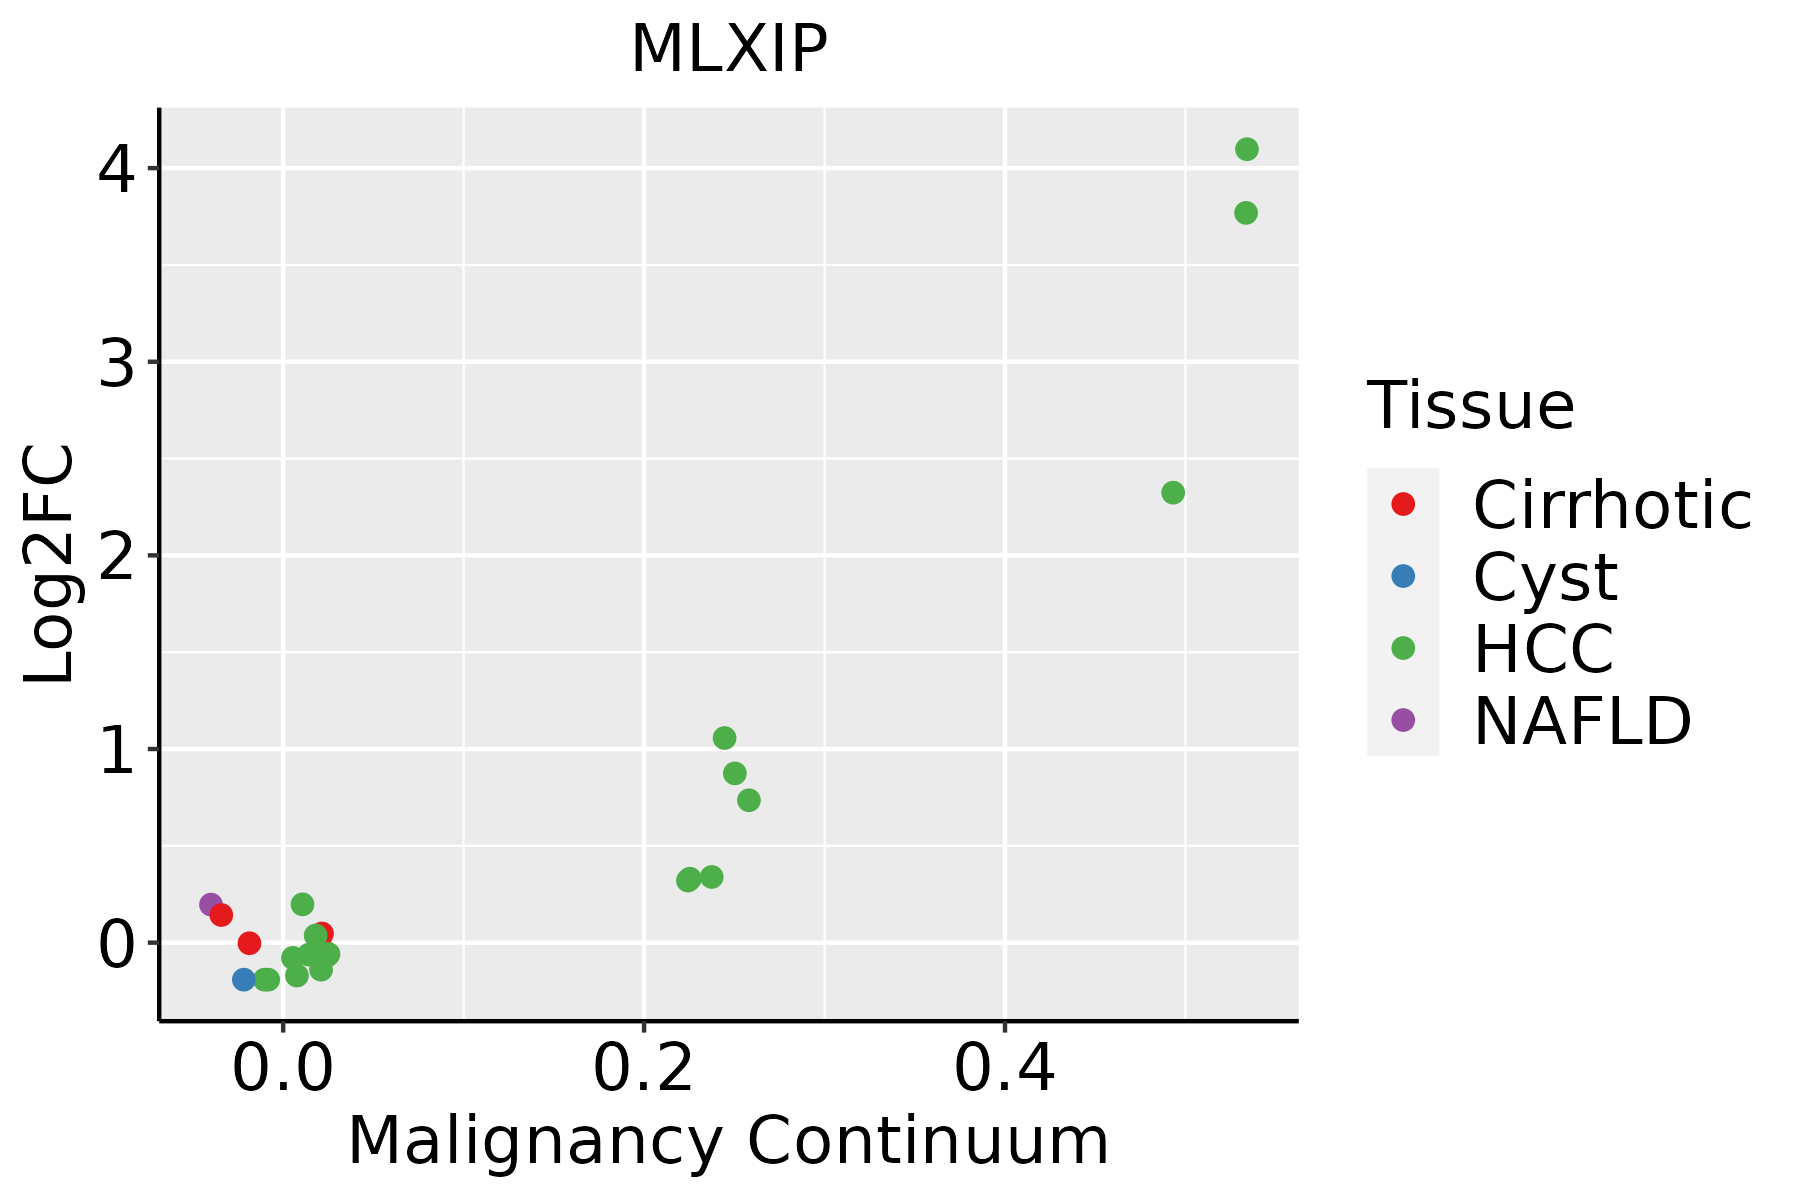
HCC: Hepatocellular carcinoma
NAFLD: Non-alcoholic fatty liver disease
Oral CavityThe image shows the transcriptomic changes along malignancy continuum.log2FC in expression of this searched gene in stem-like cells from each diseased tissue sample relative to stem-like cells in normal samples in each tissue plotted against the malignancy continuum. Samples are colored based on if they are from different disease stage.
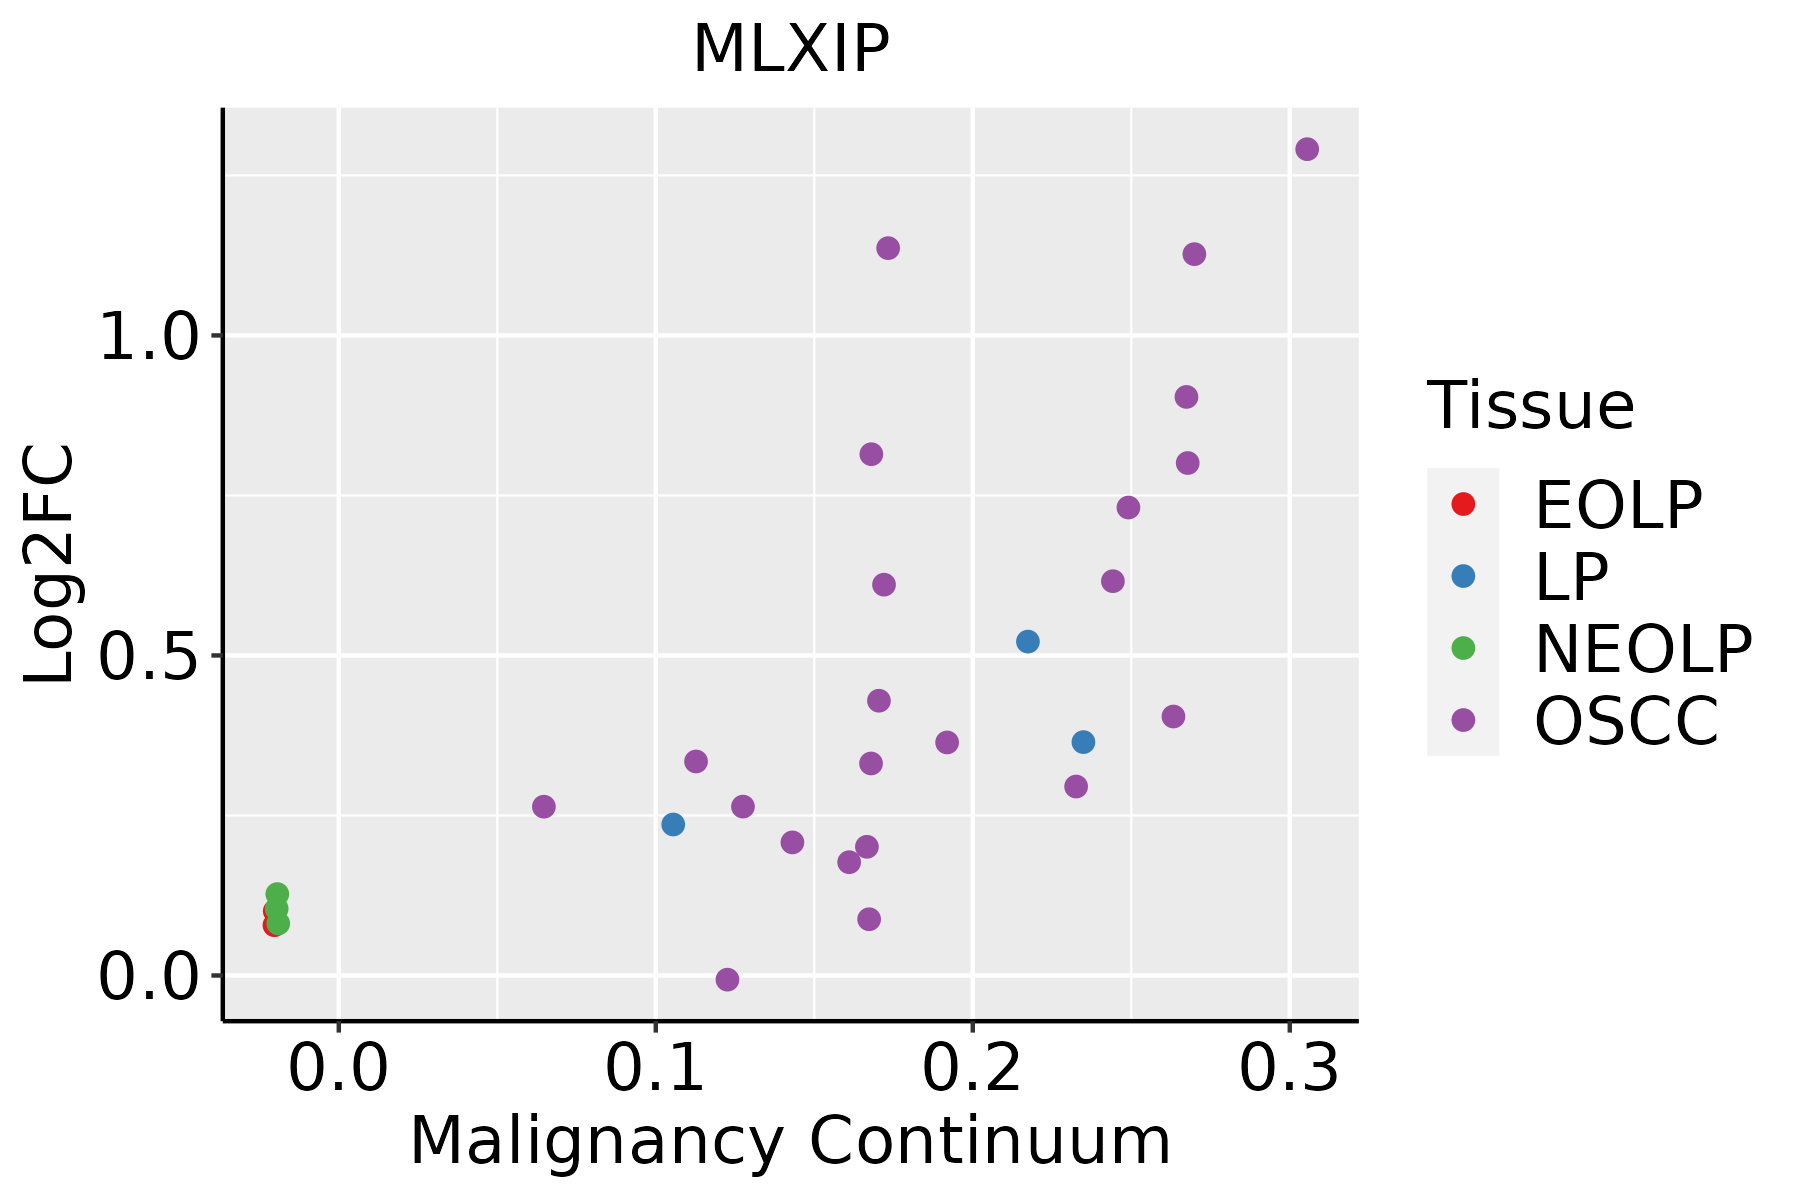
EOLP: Erosive Oral lichen planus
LP: leukoplakia
NEOLP: Non-erosive oral lichen planus
OSCC: Oral squamous cell carcinoma
ProstateThe image shows the transcriptomic changes along malignancy continuum.log2FC in expression of this searched gene in stem-like cells from each diseased tissue sample relative to stem-like cells in normal samples in each tissue plotted against the malignancy continuum. Samples are colored based on if they are from different disease stage.
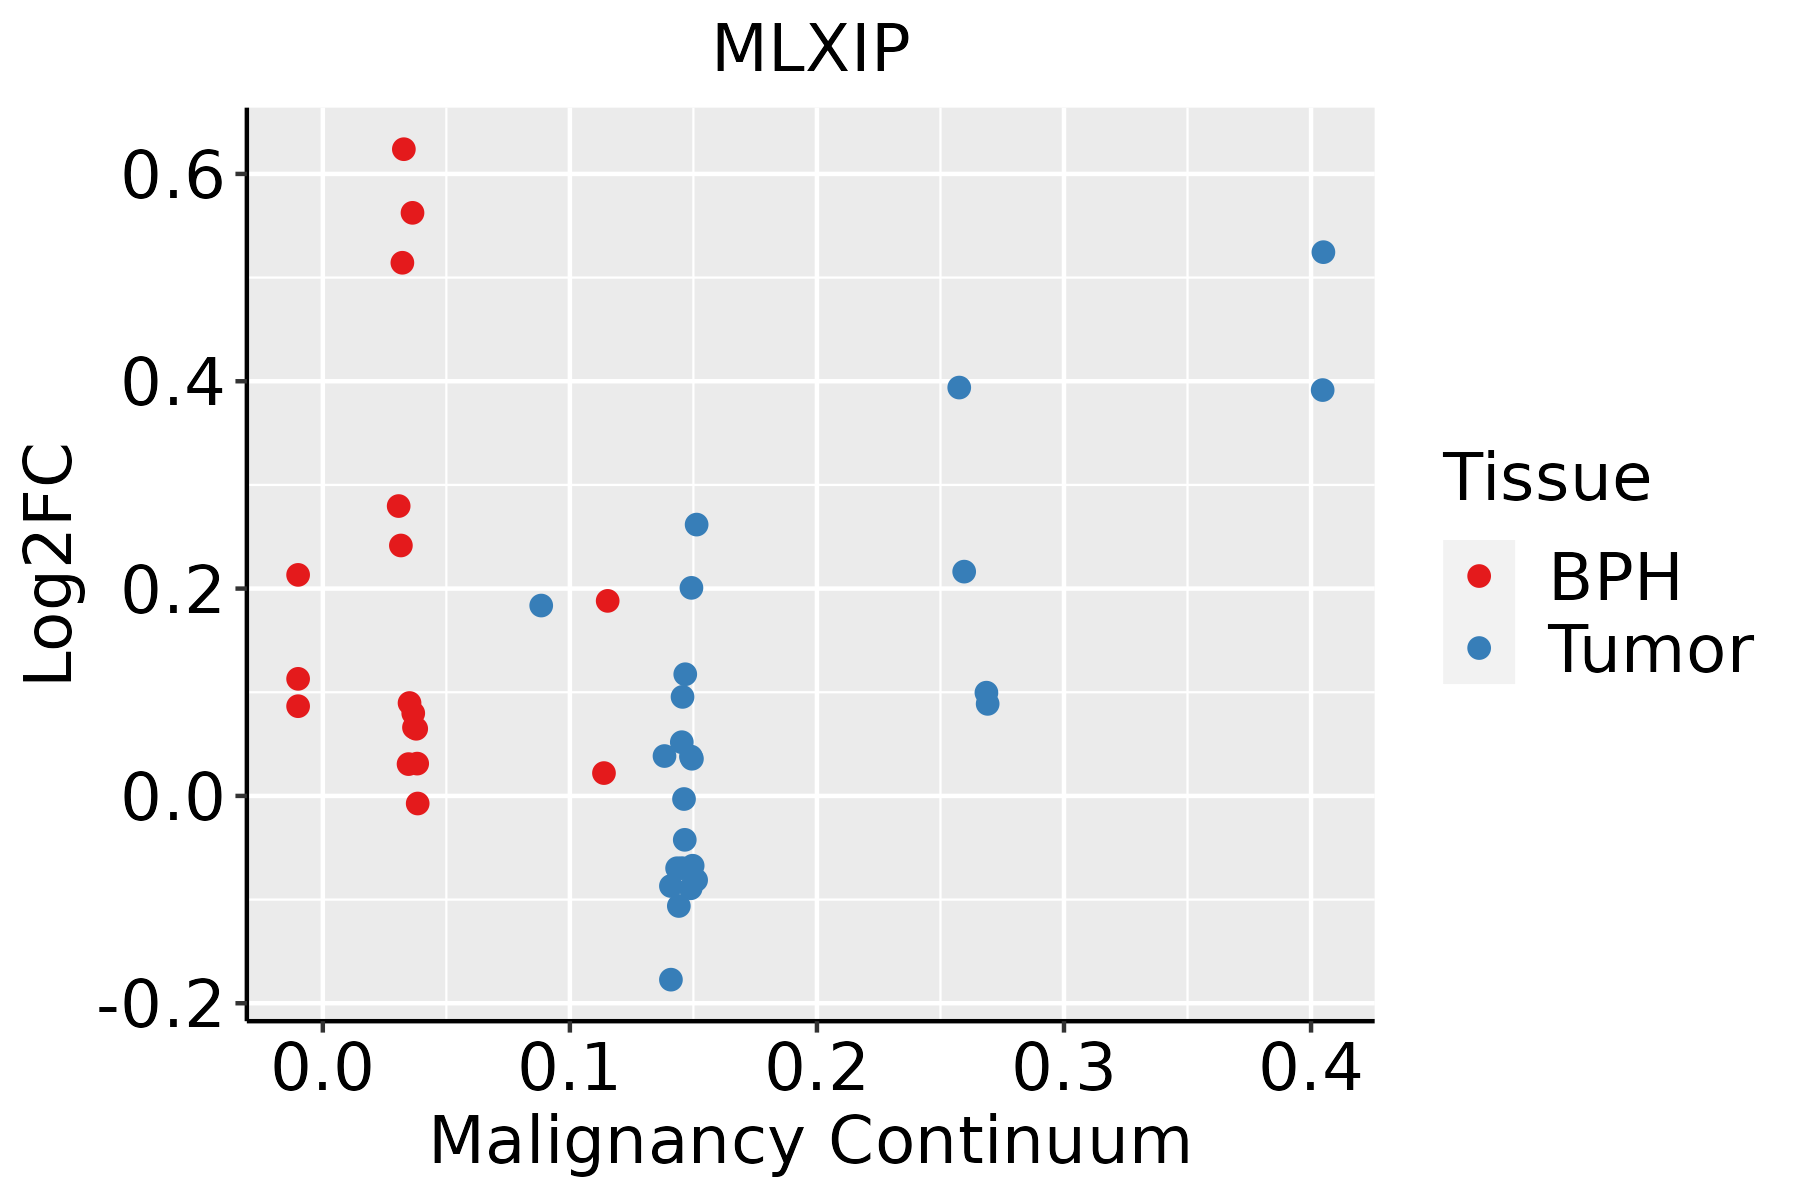
BPH: Benign Prostatic Hyperplasia
ThyroidThe image shows the transcriptomic changes along malignancy continuum.log2FC in expression of this searched gene in stem-like cells from each diseased tissue sample relative to stem-like cells in normal samples in each tissue plotted against the malignancy continuum. Samples are colored based on if they are from different disease stage.ATC: Anaplastic thyroid cancer
HT: Hashimoto's thyroiditis
PTC: Papillary thyroid cancer
∗log2FC in expression of this searched gene in stem-like cells from each diseased tissue sample relative to stem-like cells in normal samples in each tissue plotted against the malignancy continuum. Samples are colored based on if they are from different disease stage.

Top

Malignant transformation related pathway analysis

check buttonFind out the enriched GO biological processes and KEGG pathways involved in transition from healthy to precancer to cancer
check button Figure of enriched GO biological processes.
TissueDisease StageEnriched GO biological Processes
ColorectumADGO analysis - Figure of enriched GO biological processes: Top 15 enriched GO BP terms are showed in the bar plot of each disease state in each tissue. Each row represents a significant GO biological process which is colored according to the -log10(p.adjust).
ColorectumSERGO analysis - Figure of enriched GO biological processes: Top 15 enriched GO BP terms are showed in the bar plot of each disease state in each tissue. Each row represents a significant GO biological process which is colored according to the -log10(p.adjust).
ColorectumMSSGO analysis - Figure of enriched GO biological processes: Top 15 enriched GO BP terms are showed in the bar plot of each disease state in each tissue. Each row represents a significant GO biological process which is colored according to the -log10(p.adjust).
ColorectumMSI-HGO analysis - Figure of enriched GO biological processes: Top 15 enriched GO BP terms are showed in the bar plot of each disease state in each tissue. Each row represents a significant GO biological process which is colored according to the -log10(p.adjust).
ColorectumFAPGO analysis - Figure of enriched GO biological processes: Top 15 enriched GO BP terms are showed in the bar plot of each disease state in each tissue. Each row represents a significant GO biological process which is colored according to the -log10(p.adjust).
∗Top 15 enriched GO BP terms are showed in the bar plot of each disease state in each tissue. Each row represents a significant GO biological process which is colored according to the -log10(p.adjust).
Page: 1 2 3 4 5 6 7 8 9 

check button Enriched GO biological processes.
GO IDTissueDisease StageDescriptionGene RatioBg Ratiopvaluep.adjustCount
GO:004259322LiverHCCglucose homeostasis137/7958258/187233.59e-042.49e-03137
GO:004345712LiverHCCregulation of cellular respiration33/795849/187233.86e-042.62e-0333
GO:190371512LiverHCCregulation of aerobic respiration24/795833/187234.24e-042.85e-0324
GO:003350022LiverHCCcarbohydrate homeostasis137/7958259/187234.45e-042.98e-03137
GO:000167822LiverHCCcellular glucose homeostasis95/7958172/187234.95e-043.24e-0395
GO:007133112LiverHCCcellular response to hexose stimulus85/7958153/187237.47e-044.52e-0385
GO:007133312LiverHCCcellular response to glucose stimulus84/7958151/187237.57e-044.56e-0384
GO:007132612LiverHCCcellular response to monosaccharide stimulus85/7958154/187239.78e-045.68e-0385
GO:007132212LiverHCCcellular response to carbohydrate stimulus89/7958163/187231.19e-036.62e-0389
GO:00192172LiverHCCregulation of fatty acid metabolic process53/795893/187233.36e-031.53e-0253
GO:00550902LiverHCCacylglycerol homeostasis27/795842/187233.60e-031.60e-0227
GO:00703282LiverHCCtriglyceride homeostasis27/795842/187233.60e-031.60e-0227
GO:190357911LiverHCCnegative regulation of ATP metabolic process20/795830/187236.52e-032.65e-0220
GO:00020821LiverHCCregulation of oxidative phosphorylation16/795823/187238.04e-033.17e-0216
Page: 1 2 3 4 5 6 7 8 9 10 11 12 13 14 15 16 17 18 19 20 21 

check button Enriched KEGG pathways.
Pathway IDTissueDisease StageDescriptionGene RatioBg Ratiopvaluep.adjustqvalueCount
hsa04932ColorectumADNon-alcoholic fatty liver disease90/2092155/84654.83e-191.80e-171.15e-1790
hsa049321ColorectumADNon-alcoholic fatty liver disease90/2092155/84654.83e-191.80e-171.15e-1790
hsa049322ColorectumSERNon-alcoholic fatty liver disease75/1580155/84652.16e-175.99e-164.35e-1675
hsa049323ColorectumSERNon-alcoholic fatty liver disease75/1580155/84652.16e-175.99e-164.35e-1675
hsa049324ColorectumMSSNon-alcoholic fatty liver disease85/1875155/84654.19e-191.17e-177.17e-1885
hsa04931ColorectumMSSInsulin resistance36/1875108/84654.74e-032.01e-021.23e-0236
hsa049325ColorectumMSSNon-alcoholic fatty liver disease85/1875155/84654.19e-191.17e-177.17e-1885
hsa049311ColorectumMSSInsulin resistance36/1875108/84654.74e-032.01e-021.23e-0236
hsa049326ColorectumMSI-HNon-alcoholic fatty liver disease52/797155/84654.61e-171.49e-151.25e-1552
hsa049327ColorectumMSI-HNon-alcoholic fatty liver disease52/797155/84654.61e-171.49e-151.25e-1552
hsa049328ColorectumFAPNon-alcoholic fatty liver disease54/1404155/84651.98e-086.20e-073.77e-0754
hsa049312ColorectumFAPInsulin resistance32/1404108/84654.90e-043.56e-032.16e-0332
hsa049329ColorectumFAPNon-alcoholic fatty liver disease54/1404155/84651.98e-086.20e-073.77e-0754
hsa049313ColorectumFAPInsulin resistance32/1404108/84654.90e-043.56e-032.16e-0332
hsa049314ColorectumCRCInsulin resistance28/1091108/84651.78e-042.37e-031.61e-0328
hsa049315ColorectumCRCInsulin resistance28/1091108/84651.78e-042.37e-031.61e-0328
hsa04932210EsophagusESCCNon-alcoholic fatty liver disease122/4205155/84655.69e-141.59e-128.14e-13122
hsa049318EsophagusESCCInsulin resistance69/4205108/84651.92e-035.54e-032.84e-0369
hsa0493238EsophagusESCCNon-alcoholic fatty liver disease122/4205155/84655.69e-141.59e-128.14e-13122
hsa0493113EsophagusESCCInsulin resistance69/4205108/84651.92e-035.54e-032.84e-0369
Page: 1 2 

Top

Cell-cell communication analysis

check buttonIdentification of potential cell-cell interactions between two cell types and their ligand-receptor pairs for different disease states
LigandReceptorLRpairPathwayTissueDisease Stage
Page: 1 

Top

Single-cell gene regulatory network inference analysis

check buttonFind out the significant the regulons (TFs) and the target genes of each regulon across cell types for different disease states
TFCell TypeTissueDisease StageTarget GeneRSSRegulon Activity
MLXIPCAFBreastADJNEAT1,KRT6B,SOX9, etc.9.09e-02The dot plots of a searched regulon are shown for all cell subpopulations in each disease state of each tissue based on the regulon specific score inferred using pySCENIC and by calculating the average expression.
MLXIPBASCervixHealthyKRAS,NAPB,PICALM, etc.2.72e-01The dot plots of a searched regulon are shown for all cell subpopulations in each disease state of each tissue based on the regulon specific score inferred using pySCENIC and by calculating the average expression.
MLXIPABSColorectumFAPSELENBP1,ADAMTSL1,AC103702.2, etc.1.76e-01The dot plots of a searched regulon are shown for all cell subpopulations in each disease state of each tissue based on the regulon specific score inferred using pySCENIC and by calculating the average expression.
MLXIPDUCT2PancreasADJNTN4,ZNF335,UBR1, etc.4.05e-03The dot plots of a searched regulon are shown for all cell subpopulations in each disease state of each tissue based on the regulon specific score inferred using pySCENIC and by calculating the average expression.
∗The dot plots of a searched regulon are shown for all cell subpopulations in each disease state of each tissue based on the regulon specific score inferred using pySCENIC and by calculating the average expression.
Page: 1 

Top

Somatic mutation of malignant transformation related genes

check buttonAnnotation of somatic variants for genes involved in malignant transformation
Hugo SymbolVariant ClassVariant ClassificationdbSNP RSHGVScHGVSpHGVSp ShortSWISSPROTBIOTYPESIFTPolyPhenTumor Sample BarcodeTissueHistologySexAgeStageTherapy TypesDrugsOutcome
MLXIPSNVMissense_Mutationrs528028662c.2651C>Tp.Thr884Metp.T884MQ9HAP2protein_codingdeleterious(0)probably_damaging(0.953)TCGA-A2-A0T1-01Breastbreast invasive carcinomaFemale<65III/IVTargeted Molecular therapyherceptinSD
MLXIPSNVMissense_Mutationnovelc.727N>Gp.Ser243Glyp.S243GQ9HAP2protein_codingdeleterious(0.01)possibly_damaging(0.852)TCGA-BH-A0AY-01Breastbreast invasive carcinomaFemale<65I/IIChemotherapySD
MLXIPSNVMissense_Mutationc.374C>Gp.Ser125Trpp.S125WQ9HAP2protein_codingdeleterious(0)probably_damaging(0.942)TCGA-D8-A1JA-01Breastbreast invasive carcinomaFemale<65III/IVChemotherapyadriamycinPD
MLXIPSNVMissense_Mutationc.225N>Cp.Gln75Hisp.Q75HQ9HAP2protein_codingdeleterious(0)probably_damaging(0.998)TCGA-E2-A159-01Breastbreast invasive carcinomaFemale<65I/IIChemotherapycyclophosphamideSD
MLXIPSNVMissense_Mutationrs202216030c.2362N>Ap.Glu788Lysp.E788KQ9HAP2protein_codingdeleterious(0)probably_damaging(0.99)TCGA-2W-A8YY-01Cervixcervical & endocervical cancerFemale<65I/IIChemotherapycisplatinCR
MLXIPSNVMissense_Mutationnovelc.2709N>Tp.Glu903Aspp.E903DQ9HAP2protein_codingtolerated(0.07)possibly_damaging(0.53)TCGA-2W-A8YY-01Cervixcervical & endocervical cancerFemale<65I/IIChemotherapycisplatinCR
MLXIPSNVMissense_Mutationc.1480N>Tp.His494Tyrp.H494YQ9HAP2protein_codingtolerated(0.06)possibly_damaging(0.899)TCGA-C5-A3HL-01Cervixcervical & endocervical cancerFemale>=65I/IIUnknownUnknownSD
MLXIPSNVMissense_Mutationnovelc.1159N>Tp.Thr387Serp.T387SQ9HAP2protein_codingtolerated(0.59)benign(0.009)TCGA-DS-A1OA-01Cervixcervical & endocervical cancerFemale>=65I/IIChemotherapycarboplatinPD
MLXIPSNVMissense_Mutationc.2131C>Tp.Pro711Serp.P711SQ9HAP2protein_codingtolerated(0.32)benign(0.001)TCGA-AA-3492-01Colorectumcolon adenocarcinomaFemale>=65I/IIUnknownUnknownSD
MLXIPSNVMissense_Mutationc.901N>Tp.Arg301Trpp.R301WQ9HAP2protein_codingdeleterious(0)probably_damaging(0.982)TCGA-AD-5900-01Colorectumcolon adenocarcinomaMale>=65I/IIUnknownUnknownSD
Page: 1 2 3 4 5 6 7 

Top

Related drugs of malignant transformation related genes

check buttonIdentification of chemicals and drugs interact with genes involved in malignant transfromation
(DGIdb 4.0)
Entrez IDSymbolCategoryInteraction TypesDrug Claim NameDrug NamePMIDs
Page: 1