
|
|||||
|
 | |
| |
| |
| |
| |
| |
|
Gene: LEPROT |
Gene summary for LEPROT |
| Gene information | Species | Human | Gene symbol | LEPROT | Gene ID | 54741 |
| Gene name | leptin receptor overlapping transcript | |
| Gene Alias | LEPR | |
| Cytomap | 1p31.3 | |
| Gene Type | protein-coding | GO ID | GO:0006605 | UniProtAcc | A0A087X0N2 |
Top |
Malignant transformation analysis |
| Identification of the aberrant gene expression in precancerous and cancerous lesions by comparing the gene expression of stem-like cells in diseased tissues with normal stem cells |
| Entrez ID | Symbol | Replicates | Species | Organ | Tissue | Adj P-value | Log2FC | Malignancy |
| 54741 | LEPROT | CA_HPV_1 | Human | Cervix | CC | 4.34e-08 | -2.96e-01 | 0.0264 |
| 54741 | LEPROT | CCI_1 | Human | Cervix | CC | 1.11e-08 | -5.13e-01 | 0.528 |
| 54741 | LEPROT | CCI_2 | Human | Cervix | CC | 6.44e-08 | -5.13e-01 | 0.5249 |
| 54741 | LEPROT | CCI_3 | Human | Cervix | CC | 9.21e-12 | -5.13e-01 | 0.516 |
| 54741 | LEPROT | CCII_1 | Human | Cervix | CC | 1.79e-16 | -5.13e-01 | 0.3249 |
| 54741 | LEPROT | sample1 | Human | Cervix | CC | 2.49e-02 | -3.05e-01 | 0.0959 |
| 54741 | LEPROT | T1 | Human | Cervix | CC | 1.78e-09 | -3.71e-01 | 0.0918 |
| 54741 | LEPROT | HTA11_3410_2000001011 | Human | Colorectum | AD | 1.92e-09 | 1.93e-01 | 0.0155 |
| 54741 | LEPROT | HTA11_2487_2000001011 | Human | Colorectum | SER | 1.16e-13 | 3.64e-01 | -0.1808 |
| 54741 | LEPROT | HTA11_1938_2000001011 | Human | Colorectum | AD | 2.05e-20 | 5.36e-01 | -0.0811 |
| 54741 | LEPROT | HTA11_78_2000001011 | Human | Colorectum | AD | 1.18e-19 | 5.27e-01 | -0.1088 |
| 54741 | LEPROT | HTA11_347_2000001011 | Human | Colorectum | AD | 1.72e-42 | 7.70e-01 | -0.1954 |
| 54741 | LEPROT | HTA11_411_2000001011 | Human | Colorectum | SER | 4.42e-10 | 6.00e-01 | -0.2602 |
| 54741 | LEPROT | HTA11_2112_2000001011 | Human | Colorectum | SER | 1.50e-04 | 3.07e-01 | -0.2196 |
| 54741 | LEPROT | HTA11_3361_2000001011 | Human | Colorectum | AD | 7.49e-10 | 3.60e-01 | -0.1207 |
| 54741 | LEPROT | HTA11_83_2000001011 | Human | Colorectum | SER | 7.80e-11 | 3.71e-01 | -0.1526 |
| 54741 | LEPROT | HTA11_696_2000001011 | Human | Colorectum | AD | 1.44e-19 | 3.65e-01 | -0.1464 |
| 54741 | LEPROT | HTA11_866_2000001011 | Human | Colorectum | AD | 1.73e-12 | 2.55e-01 | -0.1001 |
| 54741 | LEPROT | HTA11_1391_2000001011 | Human | Colorectum | AD | 5.12e-18 | 4.47e-01 | -0.059 |
| 54741 | LEPROT | HTA11_2992_2000001011 | Human | Colorectum | SER | 1.51e-04 | 2.87e-01 | -0.1706 |
| Page: 1 2 3 4 5 6 7 8 9 10 |
| Tissue | Expression Dynamics | Abbreviation |
| Cervix |  | CC: Cervix cancer |
| HSIL_HPV: HPV-infected high-grade squamous intraepithelial lesions | ||
| N_HPV: HPV-infected normal cervix | ||
| Colorectum (GSE201348) |  | FAP: Familial adenomatous polyposis |
| CRC: Colorectal cancer | ||
| Colorectum (HTA11) | 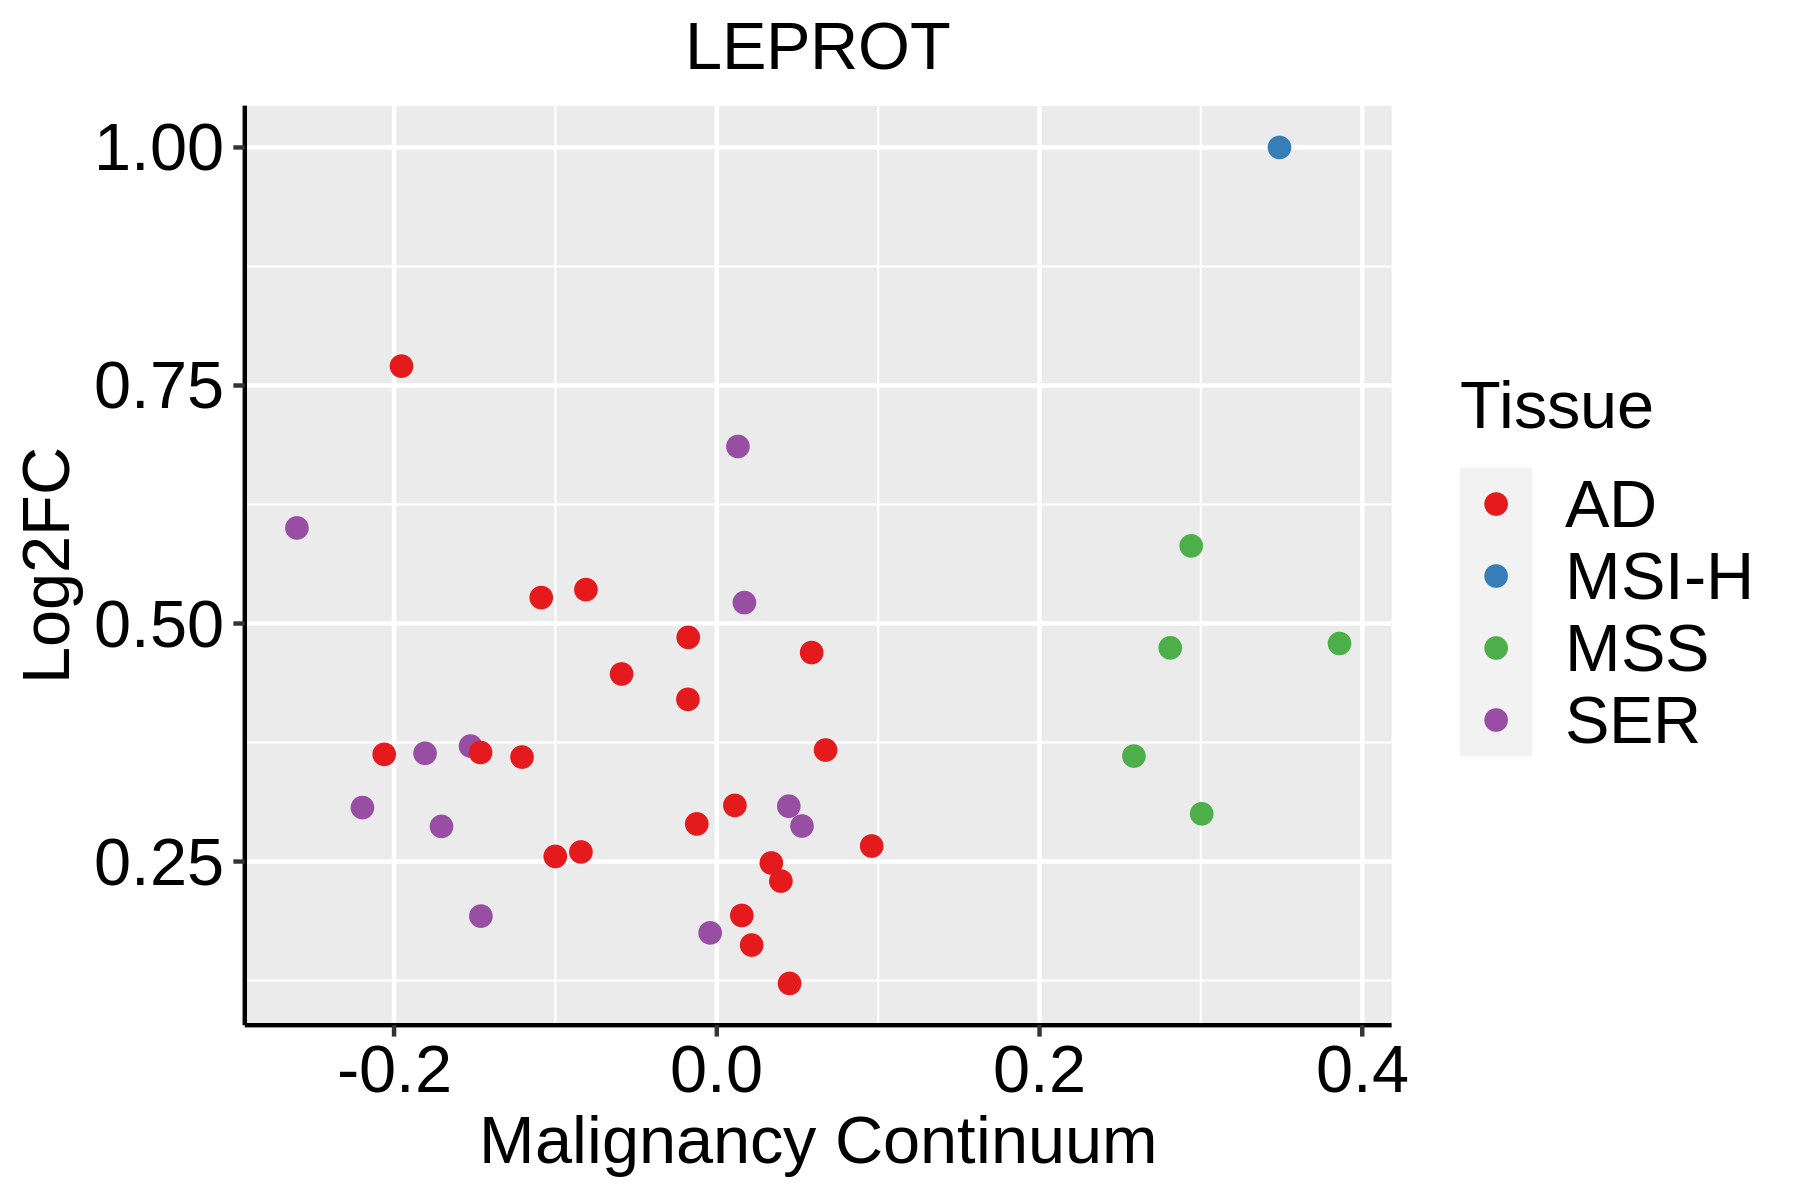 | AD: Adenomas |
| SER: Sessile serrated lesions | ||
| MSI-H: Microsatellite-high colorectal cancer | ||
| MSS: Microsatellite stable colorectal cancer | ||
| Endometrium | 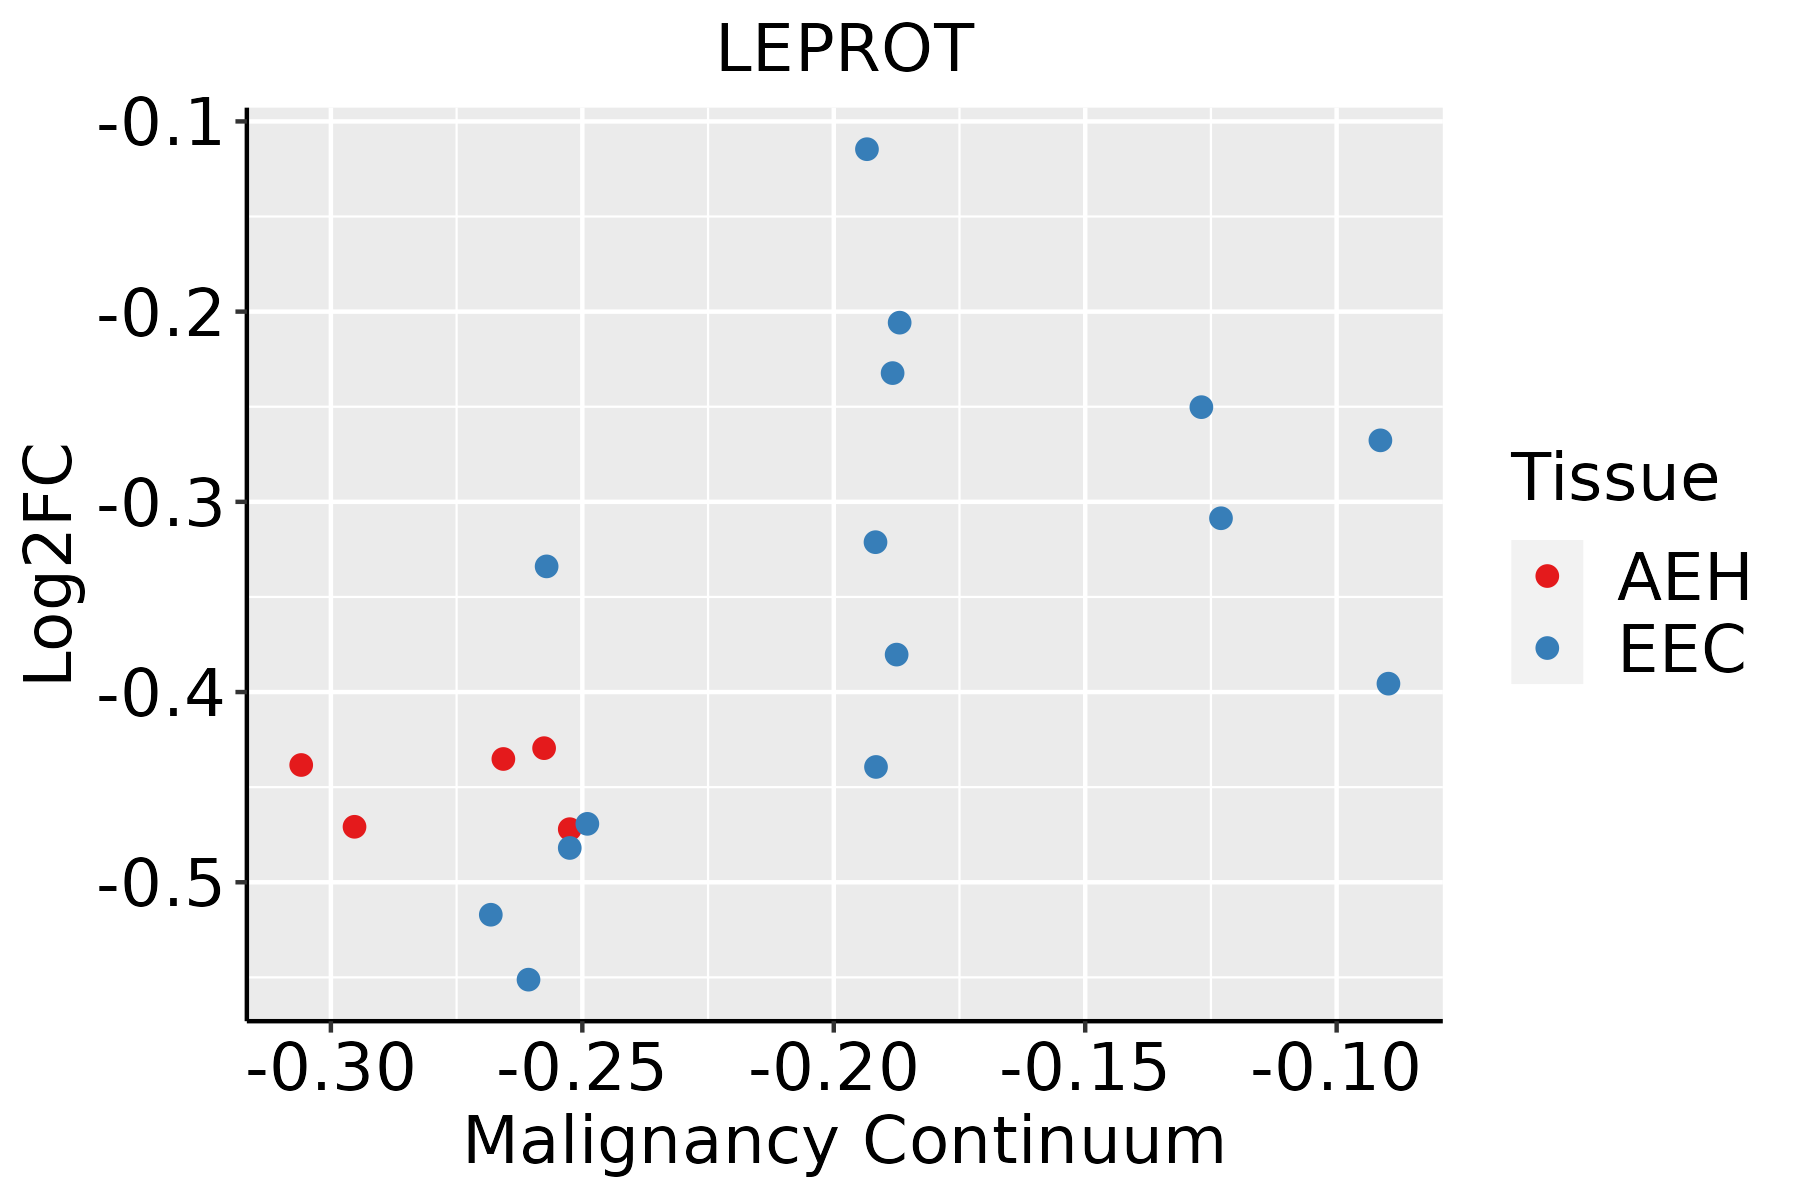 | AEH: Atypical endometrial hyperplasia |
| EEC: Endometrioid Cancer | ||
| Esophagus | 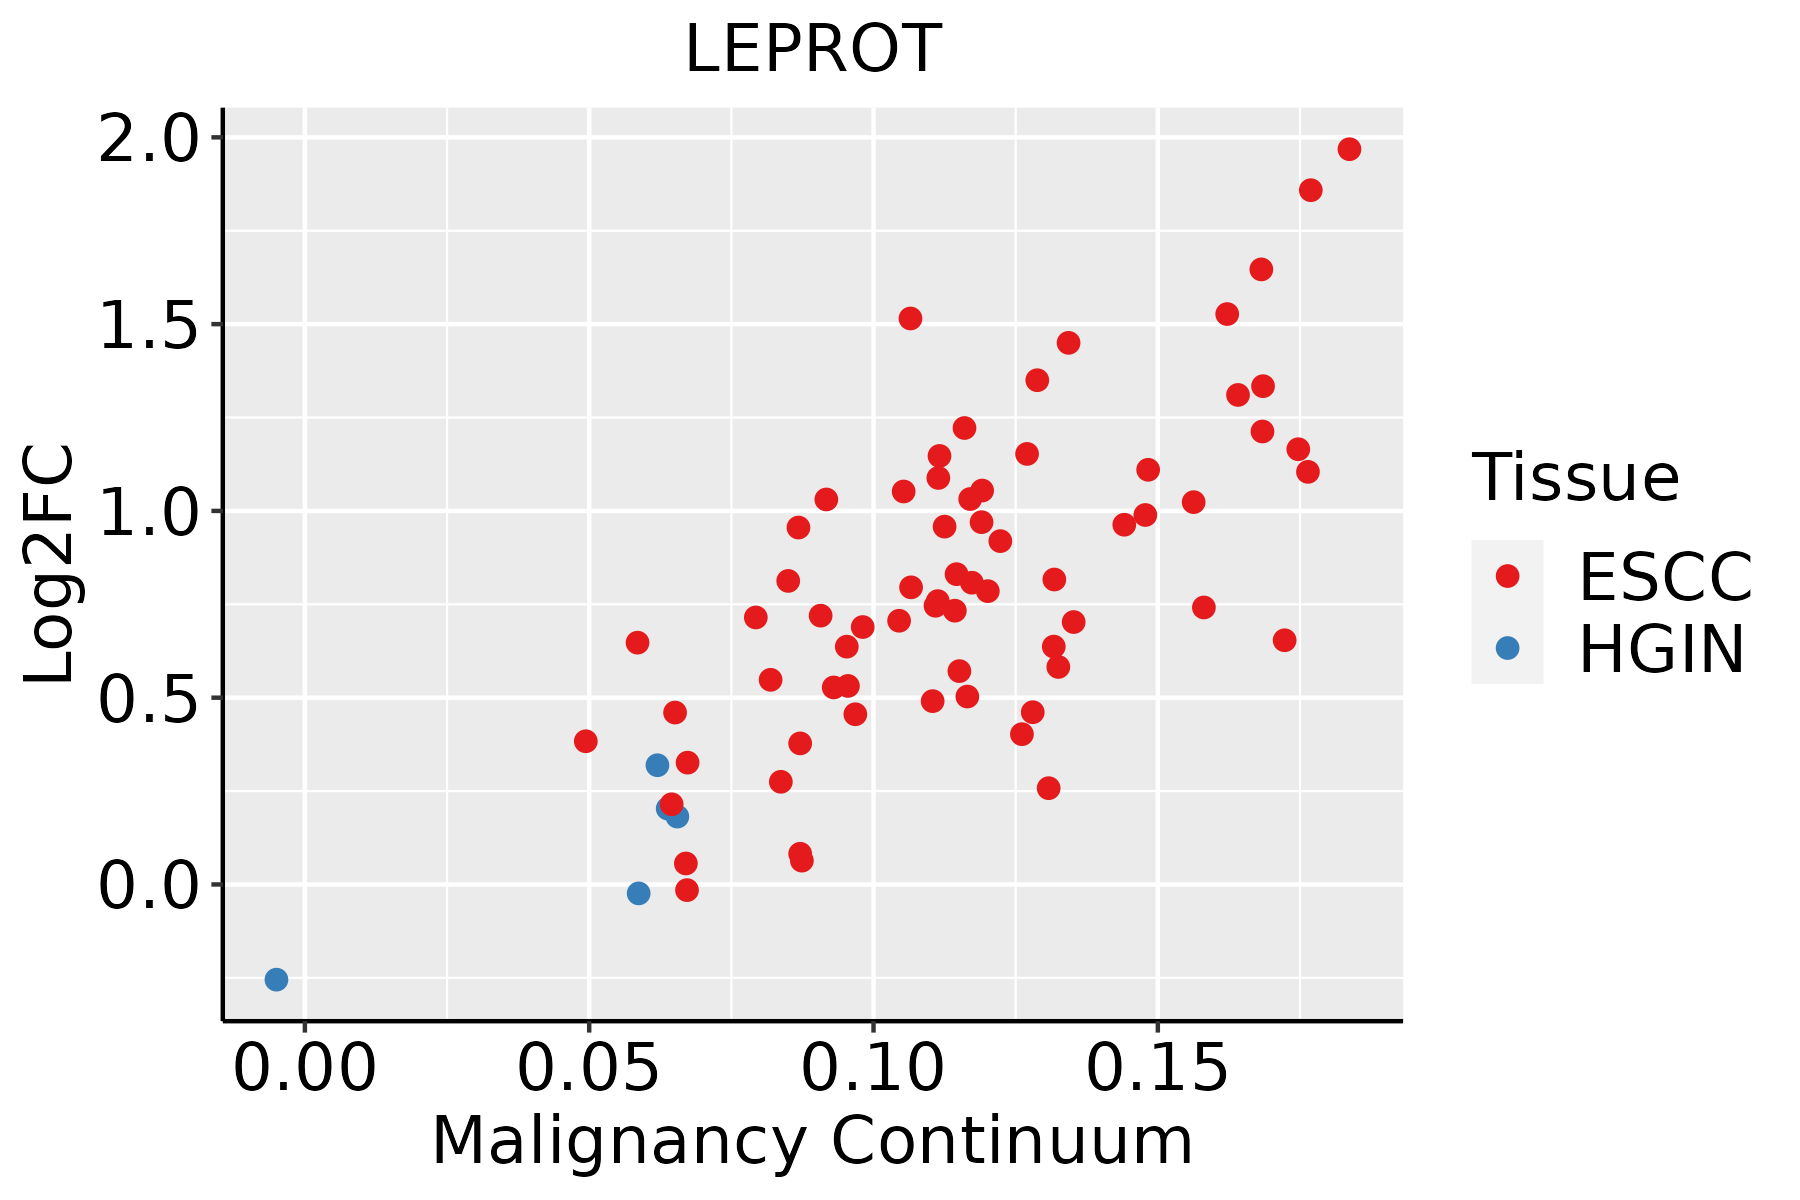 | ESCC: Esophageal squamous cell carcinoma |
| HGIN: High-grade intraepithelial neoplasias | ||
| LGIN: Low-grade intraepithelial neoplasias | ||
| Liver | 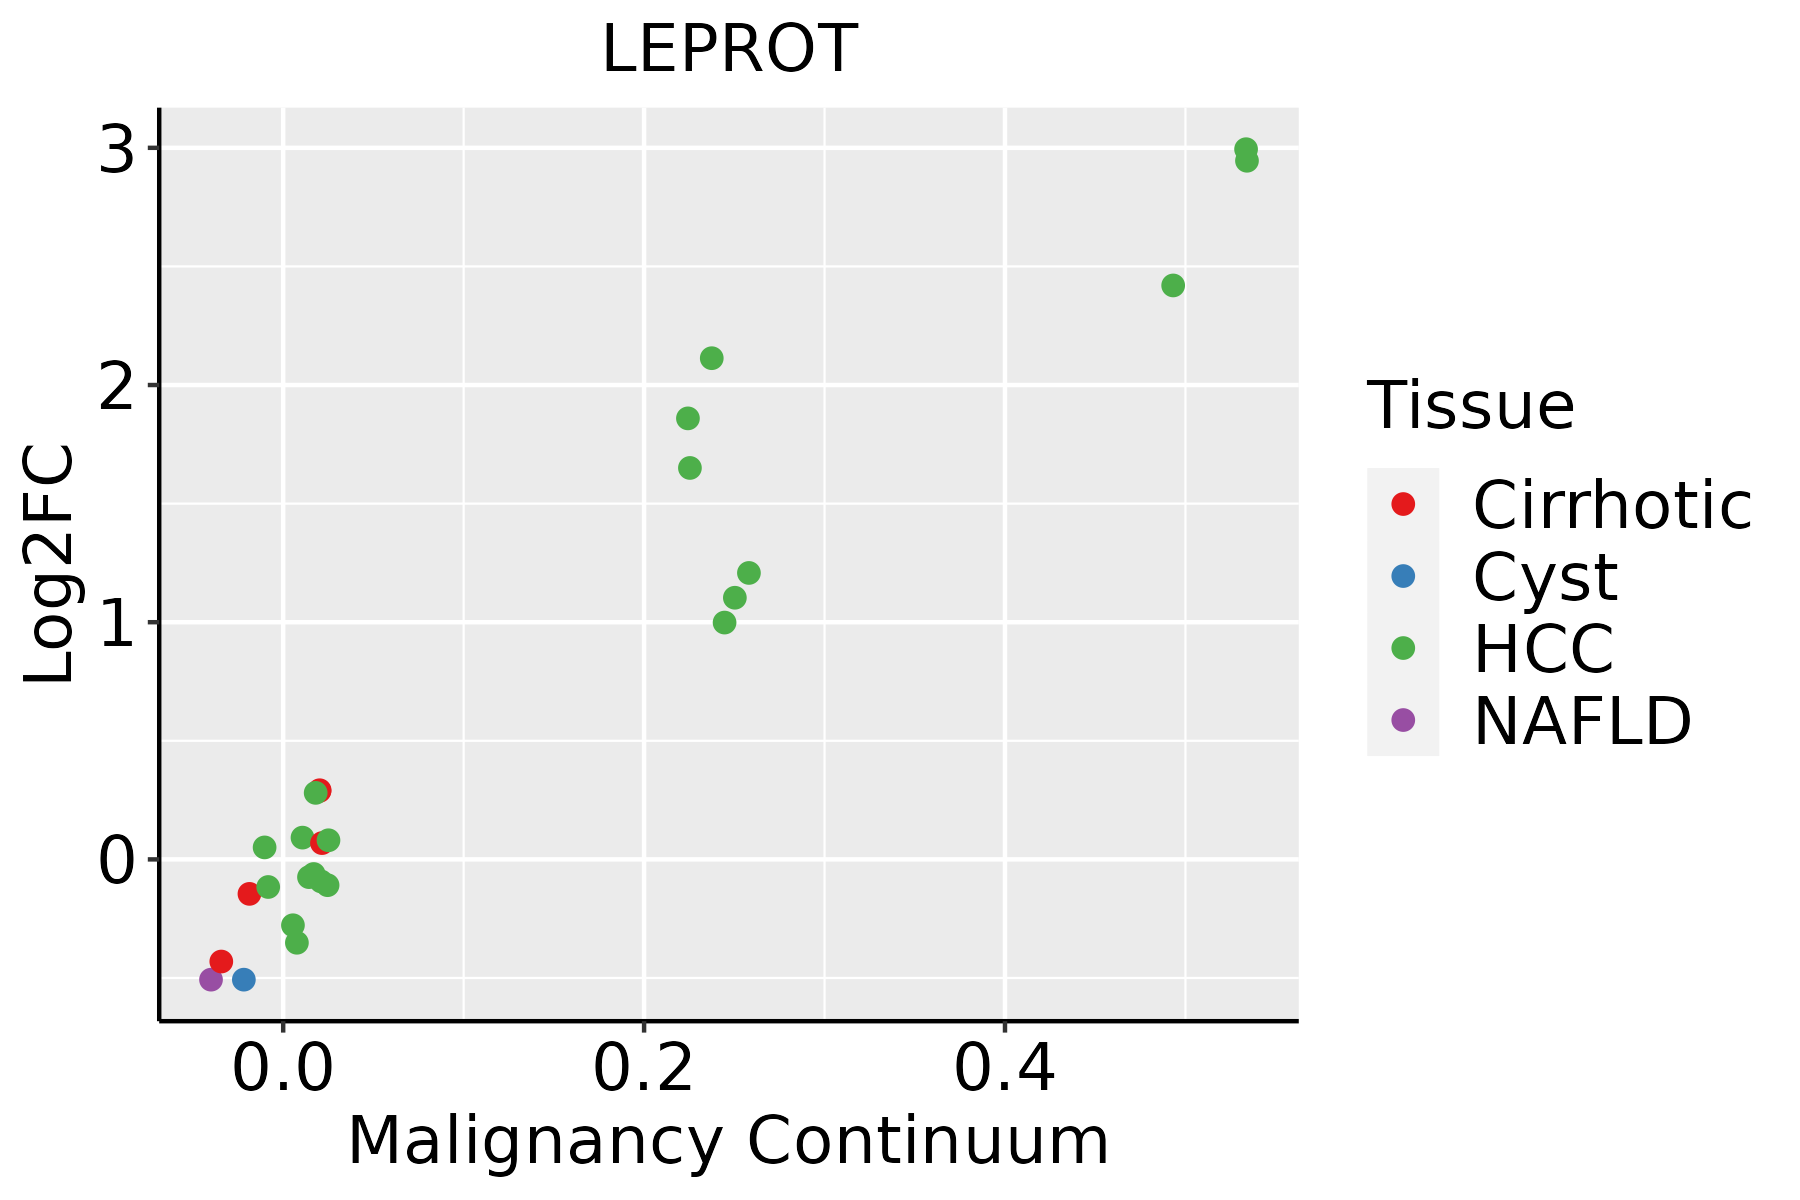 | HCC: Hepatocellular carcinoma |
| NAFLD: Non-alcoholic fatty liver disease | ||
| Oral Cavity |  | EOLP: Erosive Oral lichen planus |
| LP: leukoplakia | ||
| NEOLP: Non-erosive oral lichen planus | ||
| OSCC: Oral squamous cell carcinoma | ||
| Skin | 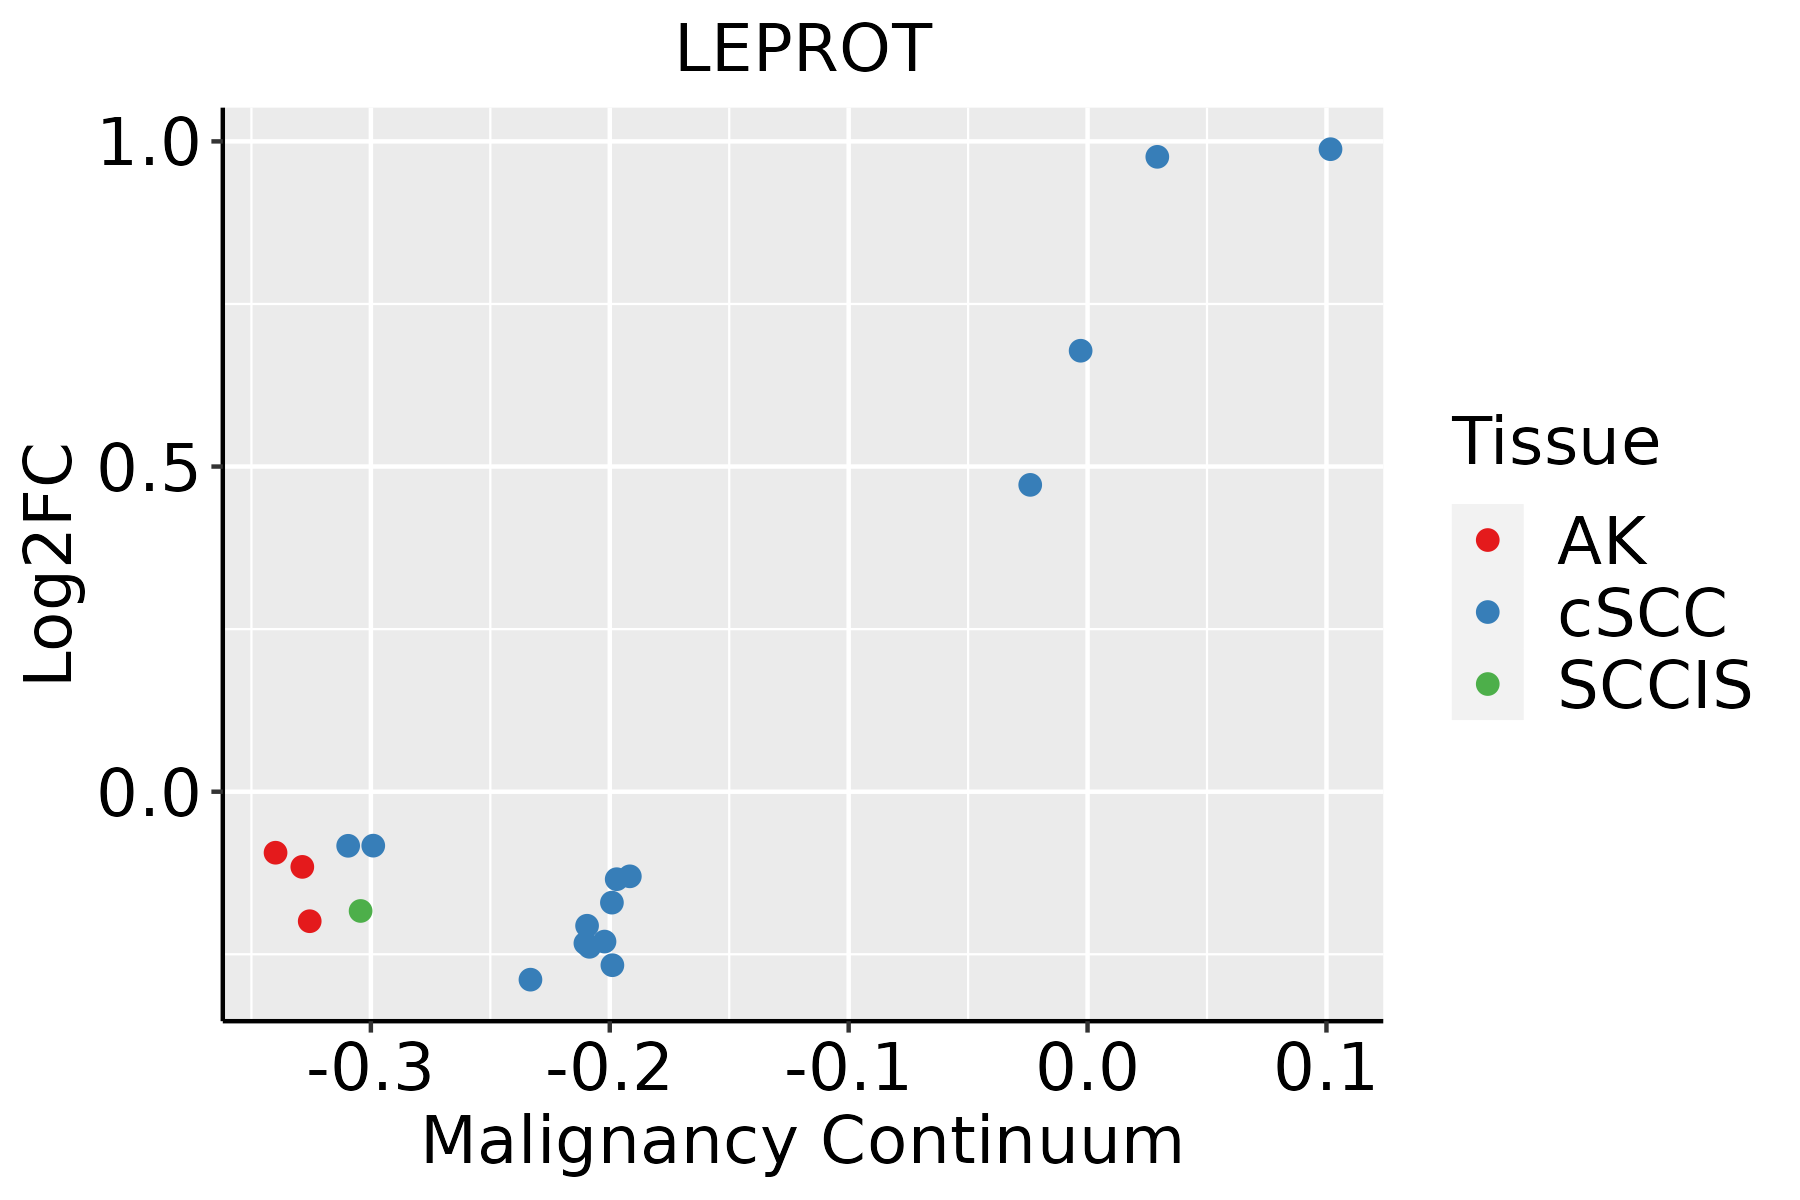 | AK: Actinic keratosis |
| cSCC: Cutaneous squamous cell carcinoma | ||
| SCCIS:squamous cell carcinoma in situ | ||
| Thyroid | 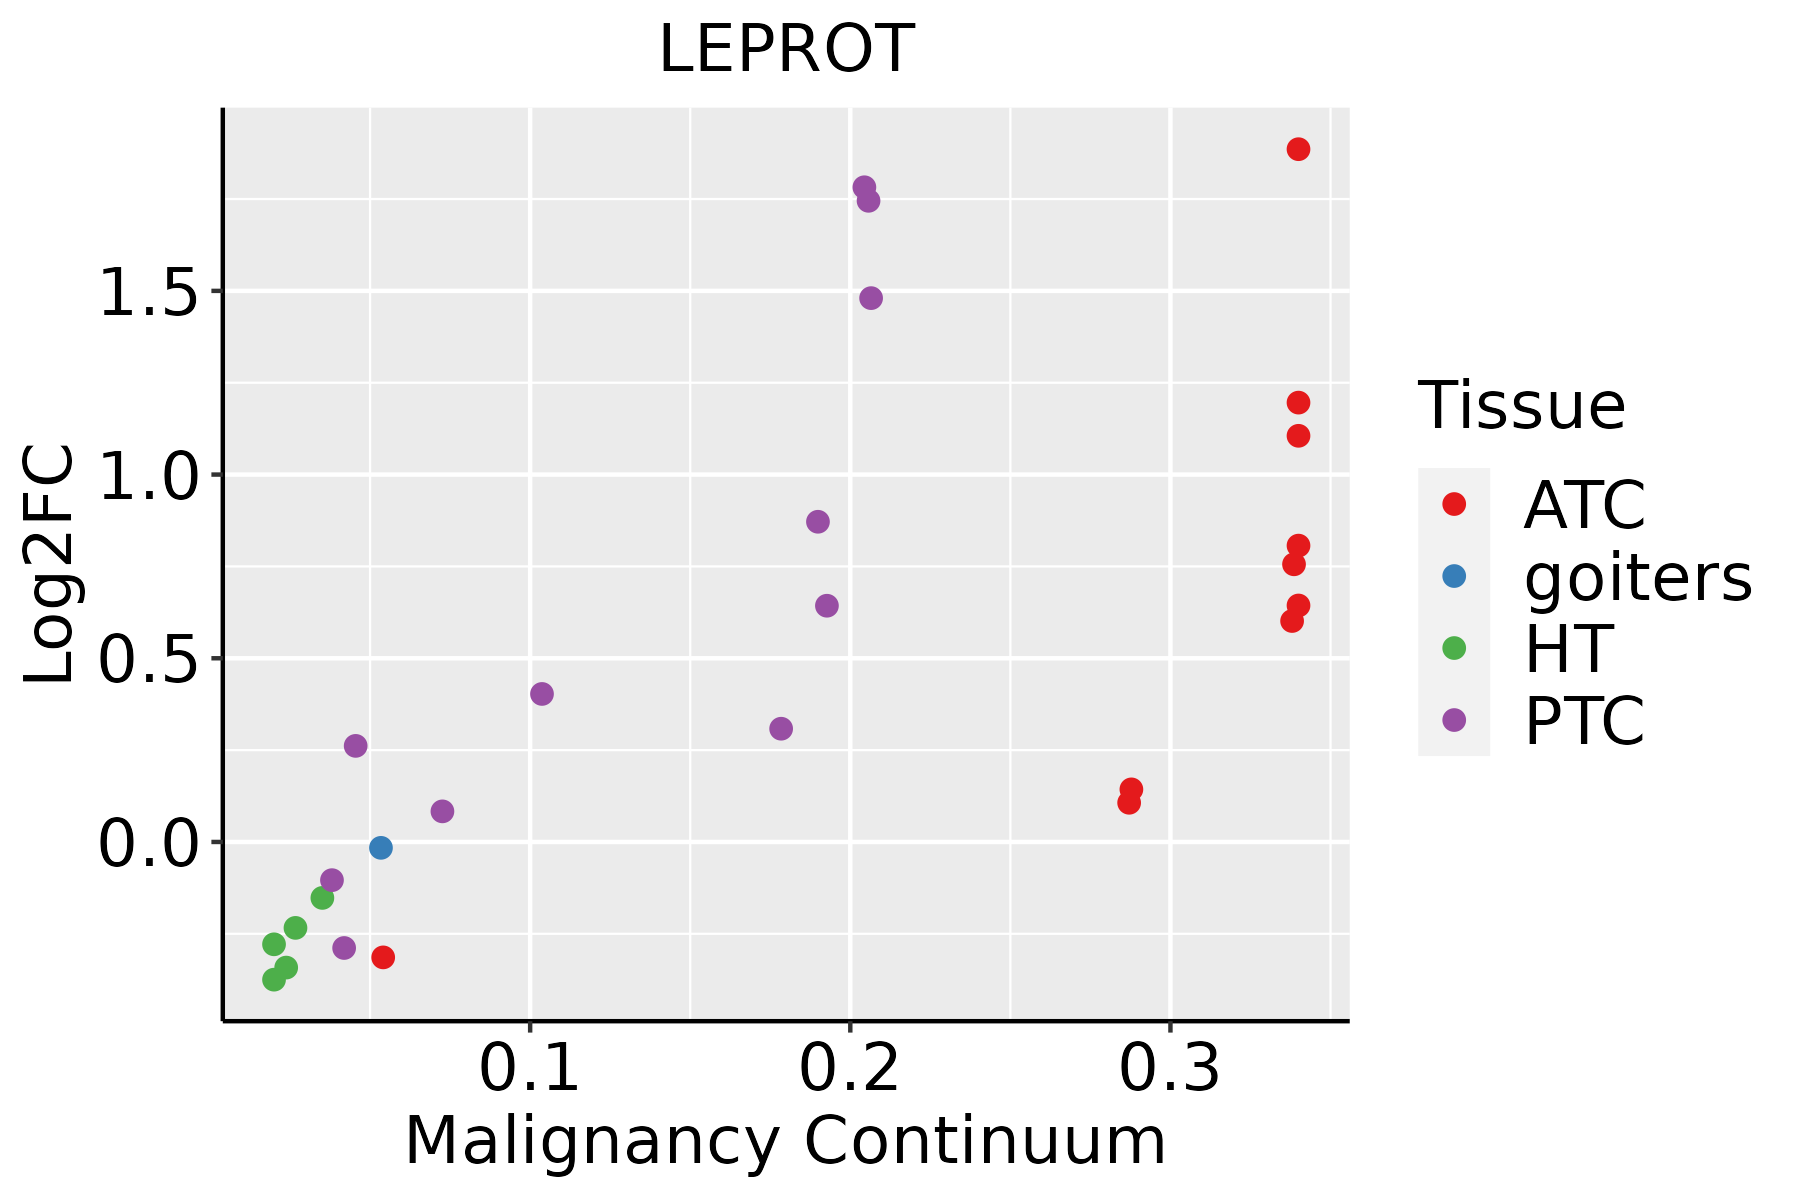 | ATC: Anaplastic thyroid cancer |
| HT: Hashimoto's thyroiditis | ||
| PTC: Papillary thyroid cancer |
| ∗log2FC in expression of this searched gene in stem-like cells from each diseased tissue sample relative to stem-like cells in normal samples in each tissue plotted against the malignancy continuum. Samples are colored based on if they are from different disease stage. |
Top |
Malignant transformation related pathway analysis |
| Find out the enriched GO biological processes and KEGG pathways involved in transition from healthy to precancer to cancer |
| Tissue | Disease Stage | Enriched GO biological Processes |
| Colorectum | AD |  |
| Colorectum | SER |  |
| Colorectum | MSS |  |
| Colorectum | MSI-H |  |
| Colorectum | FAP |  |
| ∗Top 15 enriched GO BP terms are showed in the bar plot of each disease state in each tissue. Each row represents a significant GO biological process which is colored according to the -log10(p.adjust). |
| Page: 1 2 3 4 5 6 7 8 9 |
| GO ID | Tissue | Disease Stage | Description | Gene Ratio | Bg Ratio | pvalue | p.adjust | Count |
| GO:003238825 | Thyroid | ATC | positive regulation of intracellular transport | 131/6293 | 202/18723 | 8.20e-20 | 1.24e-17 | 131 |
| GO:000660533 | Thyroid | ATC | protein targeting | 180/6293 | 314/18723 | 3.54e-18 | 4.39e-16 | 180 |
| GO:009031624 | Thyroid | ATC | positive regulation of intracellular protein transport | 107/6293 | 160/18723 | 6.82e-18 | 7.84e-16 | 107 |
| GO:000683929 | Thyroid | ATC | mitochondrial transport | 151/6293 | 254/18723 | 2.07e-17 | 2.14e-15 | 151 |
| GO:190495128 | Thyroid | ATC | positive regulation of establishment of protein localization | 177/6293 | 319/18723 | 5.43e-16 | 4.29e-14 | 177 |
| GO:005122234 | Thyroid | ATC | positive regulation of protein transport | 165/6293 | 303/18723 | 4.94e-14 | 2.69e-12 | 165 |
| GO:007058533 | Thyroid | ATC | protein localization to mitochondrion | 83/6293 | 125/18723 | 6.24e-14 | 3.37e-12 | 83 |
| GO:007265533 | Thyroid | ATC | establishment of protein localization to mitochondrion | 80/6293 | 120/18723 | 1.27e-13 | 6.46e-12 | 80 |
| GO:001619719 | Thyroid | ATC | endosomal transport | 128/6293 | 230/18723 | 4.44e-12 | 1.75e-10 | 128 |
| GO:000662626 | Thyroid | ATC | protein targeting to mitochondrion | 67/6293 | 100/18723 | 8.62e-12 | 3.21e-10 | 67 |
| GO:000703423 | Thyroid | ATC | vacuolar transport | 89/6293 | 157/18723 | 2.26e-09 | 5.40e-08 | 89 |
| GO:190165325 | Thyroid | ATC | cellular response to peptide | 173/6293 | 359/18723 | 5.87e-09 | 1.28e-07 | 173 |
| GO:190321422 | Thyroid | ATC | regulation of protein targeting to mitochondrion | 33/6293 | 44/18723 | 2.29e-08 | 4.44e-07 | 33 |
| GO:190374722 | Thyroid | ATC | regulation of establishment of protein localization to mitochondrion | 36/6293 | 50/18723 | 3.21e-08 | 6.00e-07 | 36 |
| GO:004343428 | Thyroid | ATC | response to peptide hormone | 192/6293 | 414/18723 | 3.63e-08 | 6.70e-07 | 192 |
| GO:190353316 | Thyroid | ATC | regulation of protein targeting | 51/6293 | 81/18723 | 6.02e-08 | 1.07e-06 | 51 |
| GO:003250921 | Thyroid | ATC | endosome transport via multivesicular body sorting pathway | 25/6293 | 31/18723 | 1.01e-07 | 1.70e-06 | 25 |
| GO:190382816 | Thyroid | ATC | negative regulation of cellular protein localization | 67/6293 | 117/18723 | 1.23e-07 | 2.06e-06 | 67 |
| GO:007137524 | Thyroid | ATC | cellular response to peptide hormone stimulus | 138/6293 | 290/18723 | 4.90e-07 | 7.05e-06 | 138 |
| GO:190395513 | Thyroid | ATC | positive regulation of protein targeting to mitochondrion | 24/6293 | 32/18723 | 1.99e-06 | 2.39e-05 | 24 |
| Page: 1 2 3 4 5 6 7 8 9 10 11 12 13 14 15 16 17 18 19 20 21 22 |
| Pathway ID | Tissue | Disease Stage | Description | Gene Ratio | Bg Ratio | pvalue | p.adjust | qvalue | Count |
| Page: 1 |
Top |
Cell-cell communication analysis |
| Identification of potential cell-cell interactions between two cell types and their ligand-receptor pairs for different disease states |
| Ligand | Receptor | LRpair | Pathway | Tissue | Disease Stage |
| Page: 1 |
Top |
Single-cell gene regulatory network inference analysis |
| Find out the significant the regulons (TFs) and the target genes of each regulon across cell types for different disease states |
| TF | Cell Type | Tissue | Disease Stage | Target Gene | RSS | Regulon Activity |
| ∗The dot plots of a searched regulon are shown for all cell subpopulations in each disease state of each tissue based on the regulon specific score inferred using pySCENIC and by calculating the average expression. |
| Page: 1 |
Top |
Somatic mutation of malignant transformation related genes |
| Annotation of somatic variants for genes involved in malignant transformation |
| Hugo Symbol | Variant Class | Variant Classification | dbSNP RS | HGVSc | HGVSp | HGVSp Short | SWISSPROT | BIOTYPE | SIFT | PolyPhen | Tumor Sample Barcode | Tissue | Histology | Sex | Age | Stage | Therapy Types | Drugs | Outcome |
| LEPROT | deletion | Frame_Shift_Del | novel | c.165delC | p.Ile56SerfsTer47 | p.I56Sfs*47 | protein_coding | TCGA-D8-A27V-01 | Breast | breast invasive carcinoma | Female | <65 | I/II | Hormone Therapy | tamoxiphen | SD | |||
| LEPROT | deletion | Frame_Shift_Del | novel | c.87delT | p.Met31CysfsTer6 | p.M31Cfs*6 | protein_coding | TCGA-EW-A2FV-01 | Breast | breast invasive carcinoma | Female | <65 | III/IV | Chemotherapy | docetaxel | SD | |||
| LEPROT | SNV | Missense_Mutation | novel | c.373N>G | p.Phe125Val | p.F125V | protein_coding | deleterious(0) | probably_damaging(0.955) | TCGA-G4-6586-01 | Colorectum | colon adenocarcinoma | Female | >=65 | I/II | Unknown | Unknown | SD | |
| LEPROT | insertion | Frame_Shift_Ins | novel | c.70dupG | p.Ala24GlyfsTer44 | p.A24Gfs*44 | protein_coding | TCGA-AA-A02R-01 | Colorectum | colon adenocarcinoma | Female | >=65 | I/II | Unknown | Unknown | PD | |||
| LEPROT | SNV | Missense_Mutation | c.254N>A | p.Gly85Glu | p.G85E | protein_coding | deleterious(0) | probably_damaging(0.984) | TCGA-BS-A0UV-01 | Endometrium | uterine corpus endometrioid carcinoma | Female | <65 | III/IV | Unknown | Unknown | SD | ||
| LEPROT | SNV | Missense_Mutation | novel | c.346N>A | p.Ala116Thr | p.A116T | protein_coding | tolerated(0.56) | benign(0.031) | TCGA-D1-A16X-01 | Endometrium | uterine corpus endometrioid carcinoma | Female | <65 | I/II | Unknown | Unknown | SD | |
| LEPROT | SNV | Missense_Mutation | novel | c.373N>C | p.Phe125Leu | p.F125L | protein_coding | deleterious(0.02) | probably_damaging(0.928) | TCGA-EO-A3AY-01 | Endometrium | uterine corpus endometrioid carcinoma | Female | <65 | I/II | Unknown | Unknown | PD | |
| LEPROT | SNV | Missense_Mutation | novel | c.358N>A | p.Leu120Ile | p.L120I | protein_coding | tolerated(0.37) | benign(0.073) | TCGA-53-7626-01 | Lung | lung adenocarcinoma | Female | >=65 | I/II | Unspecific | Cisplatin | PD | |
| LEPROT | SNV | Missense_Mutation | novel | c.151N>T | p.His51Tyr | p.H51Y | protein_coding | tolerated(1) | benign(0) | TCGA-86-7954-01 | Lung | lung adenocarcinoma | Female | >=65 | I/II | Chemotherapy | carboplatin | CR | |
| LEPROT | SNV | Missense_Mutation | novel | c.121G>T | p.Val41Phe | p.V41F | protein_coding | deleterious(0.05) | possibly_damaging(0.881) | TCGA-97-7941-01 | Lung | lung adenocarcinoma | Female | >=65 | I/II | Unknown | Unknown | SD |
| Page: 1 2 |
Top |
Related drugs of malignant transformation related genes |
| Identification of chemicals and drugs interact with genes involved in malignant transfromation |
| (DGIdb 4.0) |
| Entrez ID | Symbol | Category | Interaction Types | Drug Claim Name | Drug Name | PMIDs |
| Page: 1 |

Copyright 2023-Present -The University of Texas Health Science Center at Houston |