
|
|||||
|
 | |
| |
| |
| |
| |
| |
|
Gene: EPB41L5 |
Gene summary for EPB41L5 |
| Gene information | Species | Human | Gene symbol | EPB41L5 | Gene ID | 57669 |
| Gene name | erythrocyte membrane protein band 4.1 like 5 | |
| Gene Alias | BE37 | |
| Cytomap | 2q14.2 | |
| Gene Type | protein-coding | GO ID | GO:0000578 | UniProtAcc | Q9HCM4 |
Top |
Malignant transformation analysis |
| Identification of the aberrant gene expression in precancerous and cancerous lesions by comparing the gene expression of stem-like cells in diseased tissues with normal stem cells |
| Entrez ID | Symbol | Replicates | Species | Organ | Tissue | Adj P-value | Log2FC | Malignancy |
| 57669 | EPB41L5 | CCI_1 | Human | Cervix | CC | 1.27e-03 | 6.38e-01 | 0.528 |
| 57669 | EPB41L5 | AEH-subject1 | Human | Endometrium | AEH | 1.72e-51 | 8.78e-01 | -0.3059 |
| 57669 | EPB41L5 | AEH-subject2 | Human | Endometrium | AEH | 2.98e-07 | 3.98e-01 | -0.2525 |
| 57669 | EPB41L5 | AEH-subject3 | Human | Endometrium | AEH | 1.34e-19 | 5.45e-01 | -0.2576 |
| 57669 | EPB41L5 | AEH-subject4 | Human | Endometrium | AEH | 2.61e-08 | 4.65e-01 | -0.2657 |
| 57669 | EPB41L5 | AEH-subject5 | Human | Endometrium | AEH | 1.20e-31 | 7.46e-01 | -0.2953 |
| 57669 | EPB41L5 | EEC-subject1 | Human | Endometrium | EEC | 1.26e-36 | 8.90e-01 | -0.2682 |
| 57669 | EPB41L5 | EEC-subject2 | Human | Endometrium | EEC | 9.82e-17 | 4.64e-01 | -0.2607 |
| 57669 | EPB41L5 | EEC-subject3 | Human | Endometrium | EEC | 8.74e-06 | 2.70e-01 | -0.2525 |
| 57669 | EPB41L5 | EEC-subject4 | Human | Endometrium | EEC | 1.61e-11 | 4.07e-01 | -0.2571 |
| 57669 | EPB41L5 | EEC-subject5 | Human | Endometrium | EEC | 4.13e-15 | 4.96e-01 | -0.249 |
| 57669 | EPB41L5 | GSM5276935 | Human | Endometrium | EEC | 2.16e-04 | 1.60e-01 | -0.123 |
| 57669 | EPB41L5 | GSM6177621_NYU_UCEC2_lib1_lib1 | Human | Endometrium | EEC | 1.42e-02 | 7.43e-02 | -0.1934 |
| 57669 | EPB41L5 | GSM6177622_NYU_UCEC3_lib1_lib1 | Human | Endometrium | EEC | 7.66e-03 | 4.95e-03 | -0.1917 |
| 57669 | EPB41L5 | LZE4T | Human | Esophagus | ESCC | 2.17e-07 | 3.06e-01 | 0.0811 |
| 57669 | EPB41L5 | LZE20T | Human | Esophagus | ESCC | 5.83e-03 | 2.56e-01 | 0.0662 |
| 57669 | EPB41L5 | LZE22T | Human | Esophagus | ESCC | 1.72e-03 | 4.49e-01 | 0.068 |
| 57669 | EPB41L5 | LZE24T | Human | Esophagus | ESCC | 1.72e-15 | 5.22e-01 | 0.0596 |
| 57669 | EPB41L5 | P1T-E | Human | Esophagus | ESCC | 9.90e-07 | 7.23e-01 | 0.0875 |
| 57669 | EPB41L5 | P2T-E | Human | Esophagus | ESCC | 1.17e-20 | 4.34e-01 | 0.1177 |
| Page: 1 2 3 4 5 6 7 |
| Tissue | Expression Dynamics | Abbreviation |
| Cervix |  | CC: Cervix cancer |
| HSIL_HPV: HPV-infected high-grade squamous intraepithelial lesions | ||
| N_HPV: HPV-infected normal cervix | ||
| Endometrium | 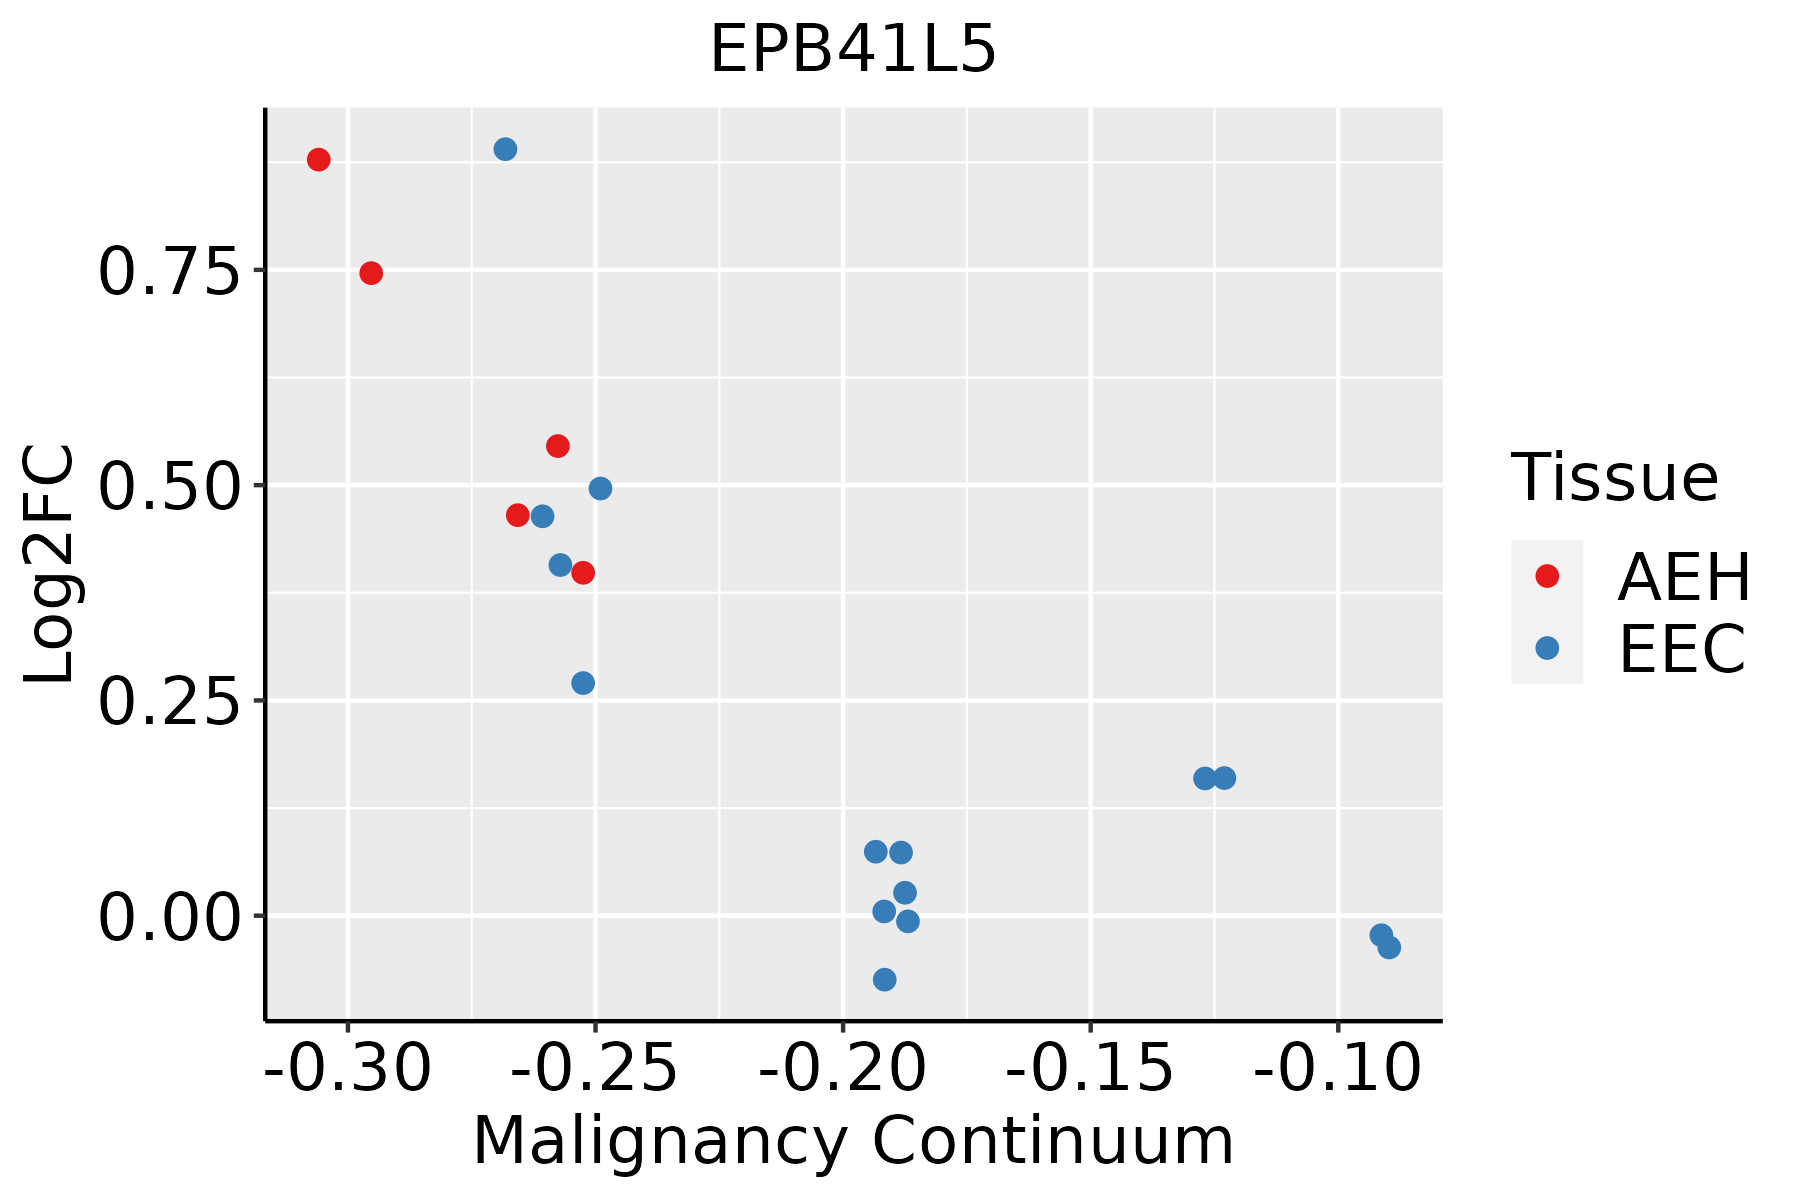 | AEH: Atypical endometrial hyperplasia |
| EEC: Endometrioid Cancer | ||
| Esophagus |  | ESCC: Esophageal squamous cell carcinoma |
| HGIN: High-grade intraepithelial neoplasias | ||
| LGIN: Low-grade intraepithelial neoplasias | ||
| Liver | 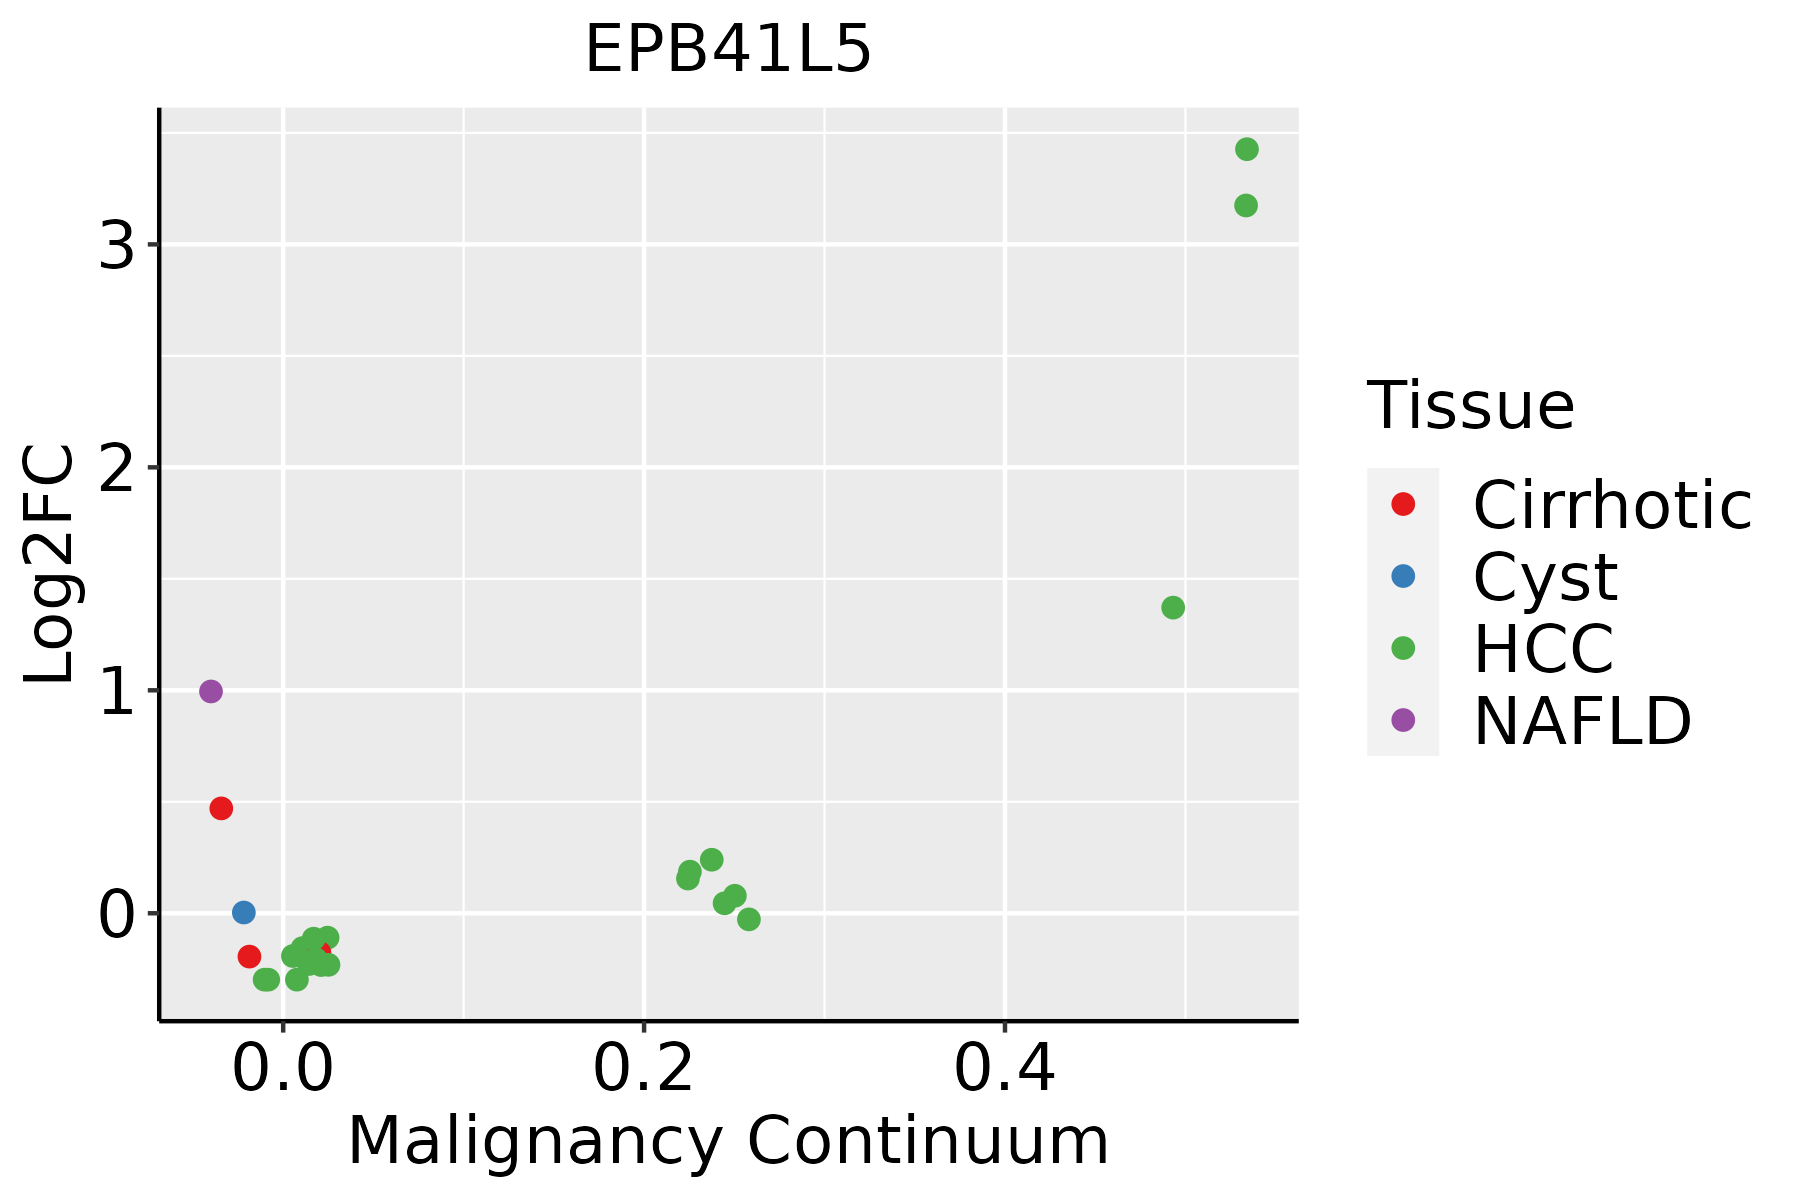 | HCC: Hepatocellular carcinoma |
| NAFLD: Non-alcoholic fatty liver disease | ||
| Lung | 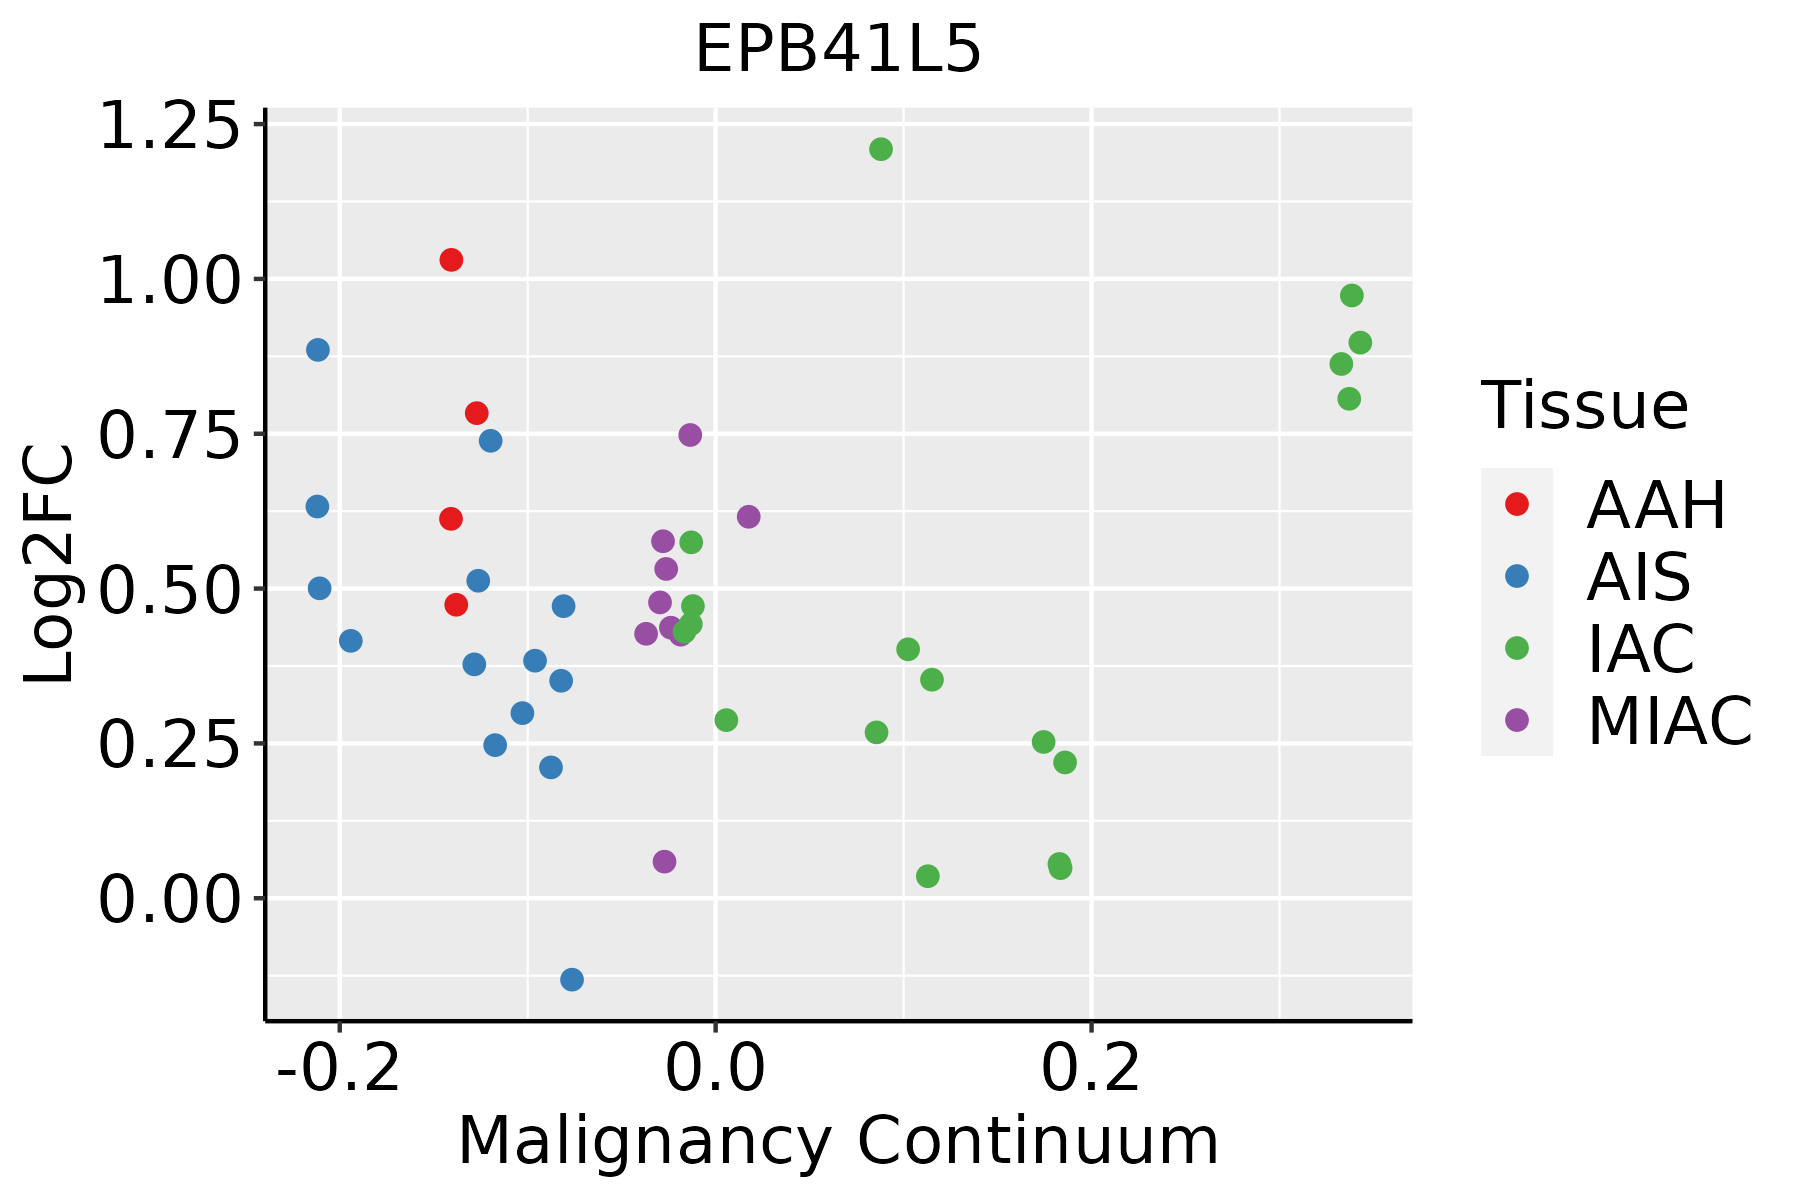 | AAH: Atypical adenomatous hyperplasia |
| AIS: Adenocarcinoma in situ | ||
| IAC: Invasive lung adenocarcinoma | ||
| MIA: Minimally invasive adenocarcinoma | ||
| Skin | 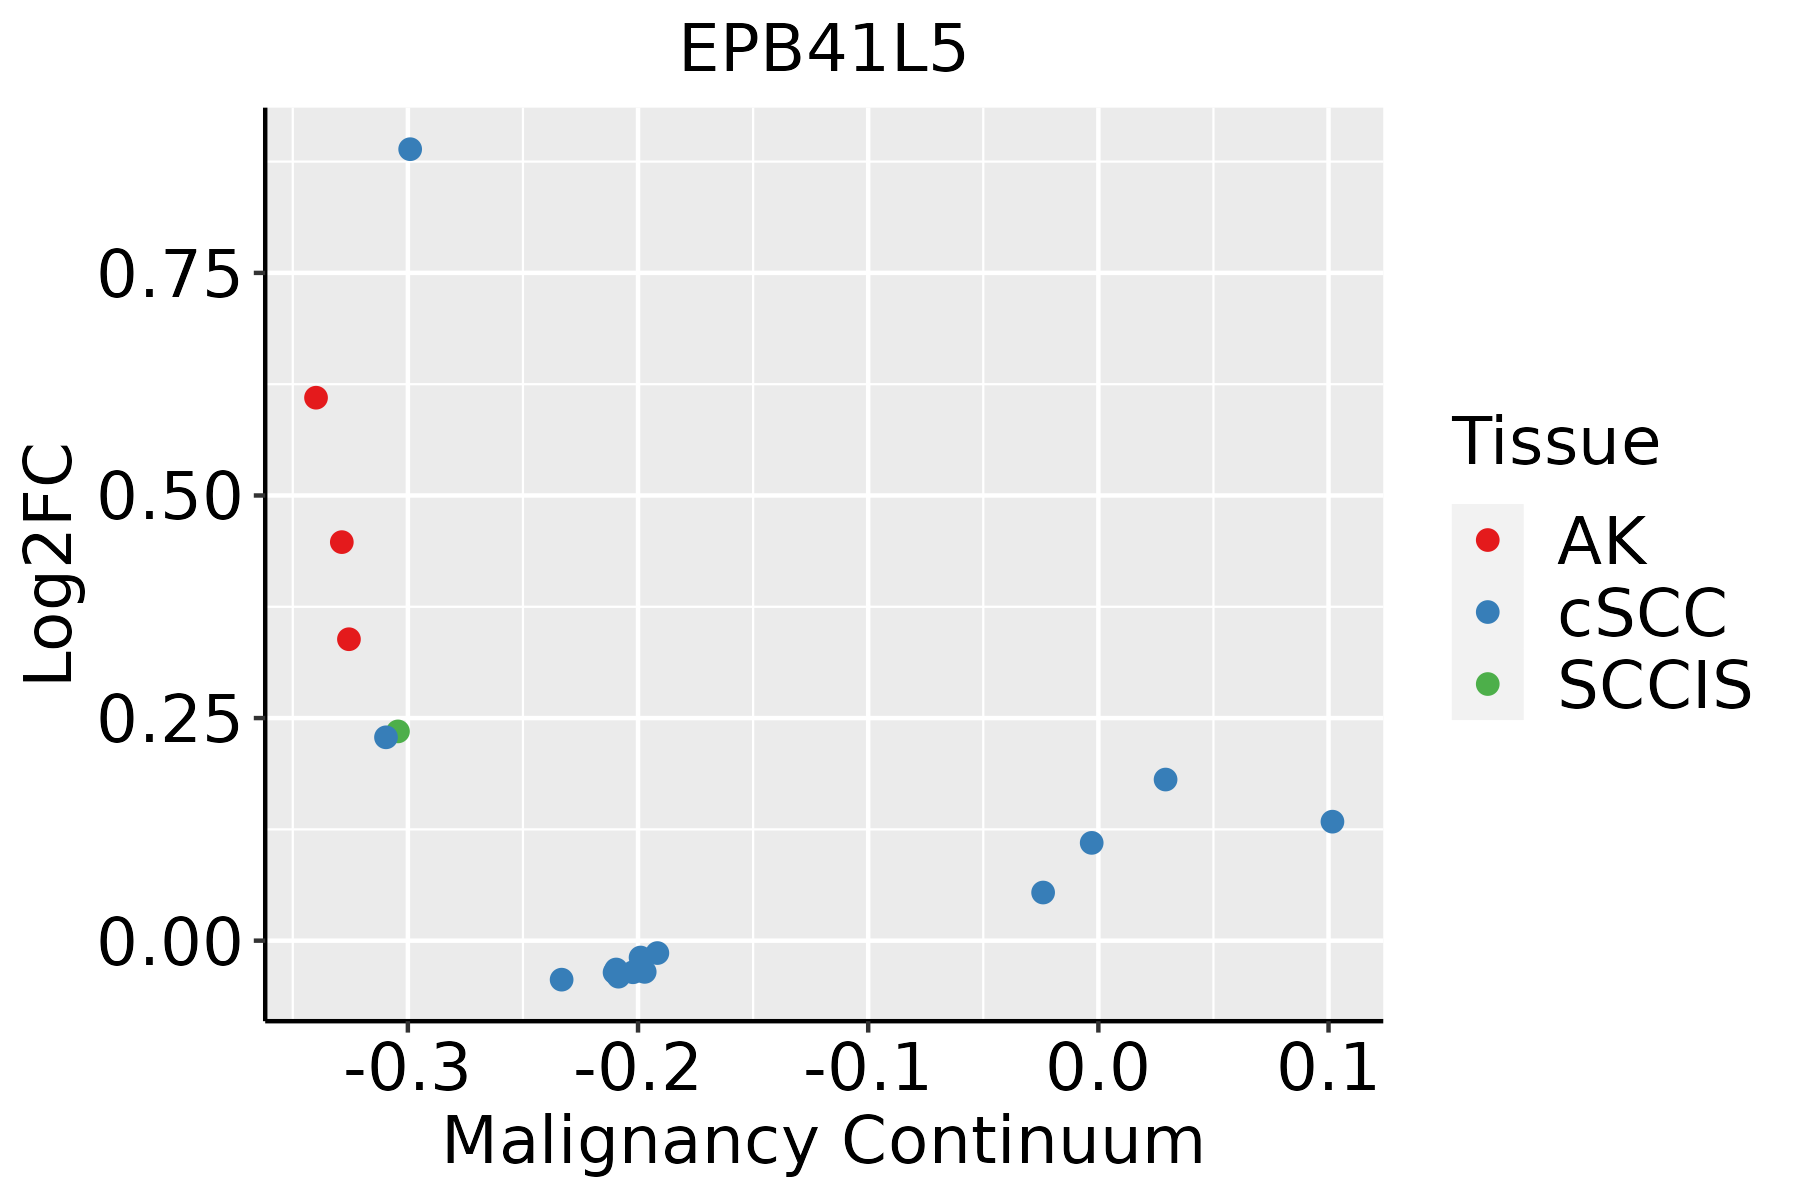 | AK: Actinic keratosis |
| cSCC: Cutaneous squamous cell carcinoma | ||
| SCCIS:squamous cell carcinoma in situ | ||
| Thyroid |  | ATC: Anaplastic thyroid cancer |
| HT: Hashimoto's thyroiditis | ||
| PTC: Papillary thyroid cancer |
| ∗log2FC in expression of this searched gene in stem-like cells from each diseased tissue sample relative to stem-like cells in normal samples in each tissue plotted against the malignancy continuum. Samples are colored based on if they are from different disease stage. |
Top |
Malignant transformation related pathway analysis |
| Find out the enriched GO biological processes and KEGG pathways involved in transition from healthy to precancer to cancer |
| Tissue | Disease Stage | Enriched GO biological Processes |
| Colorectum | AD |  |
| Colorectum | SER |  |
| Colorectum | MSS |  |
| Colorectum | MSI-H |  |
| Colorectum | FAP |  |
| ∗Top 15 enriched GO BP terms are showed in the bar plot of each disease state in each tissue. Each row represents a significant GO biological process which is colored according to the -log10(p.adjust). |
| Page: 1 2 3 4 5 6 7 8 9 |
| GO ID | Tissue | Disease Stage | Description | Gene Ratio | Bg Ratio | pvalue | p.adjust | Count |
| GO:190188815 | Skin | AK | regulation of cell junction assembly | 43/1910 | 204/18723 | 2.99e-06 | 7.93e-05 | 43 |
| GO:00017045 | Skin | AK | formation of primary germ layer | 30/1910 | 121/18723 | 3.12e-06 | 8.17e-05 | 30 |
| GO:006056016 | Skin | AK | developmental growth involved in morphogenesis | 47/1910 | 234/18723 | 4.30e-06 | 1.05e-04 | 47 |
| GO:001063420 | Skin | AK | positive regulation of epithelial cell migration | 38/1910 | 176/18723 | 6.10e-06 | 1.39e-04 | 38 |
| GO:00518949 | Skin | AK | positive regulation of focal adhesion assembly | 12/1910 | 28/18723 | 7.83e-06 | 1.72e-04 | 12 |
| GO:000195419 | Skin | AK | positive regulation of cell-matrix adhesion | 18/1910 | 58/18723 | 1.09e-05 | 2.29e-04 | 18 |
| GO:001081127 | Skin | AK | positive regulation of cell-substrate adhesion | 29/1910 | 123/18723 | 1.29e-05 | 2.58e-04 | 29 |
| GO:000716210 | Skin | AK | negative regulation of cell adhesion | 55/1910 | 303/18723 | 1.64e-05 | 3.15e-04 | 55 |
| GO:00074927 | Skin | AK | endoderm development | 21/1910 | 77/18723 | 1.95e-05 | 3.64e-04 | 21 |
| GO:00163317 | Skin | AK | morphogenesis of embryonic epithelium | 32/1910 | 147/18723 | 2.69e-05 | 4.76e-04 | 32 |
| GO:003209217 | Skin | AK | positive regulation of protein binding | 21/1910 | 85/18723 | 9.53e-05 | 1.27e-03 | 21 |
| GO:003103220 | Skin | AK | actomyosin structure organization | 37/1910 | 196/18723 | 1.67e-04 | 1.94e-03 | 37 |
| GO:004339324 | Skin | AK | regulation of protein binding | 36/1910 | 196/18723 | 3.52e-04 | 3.50e-03 | 36 |
| GO:003004816 | Skin | AK | actin filament-based movement | 26/1910 | 127/18723 | 4.11e-04 | 3.93e-03 | 26 |
| GO:00604857 | Skin | AK | mesenchyme development | 48/1910 | 291/18723 | 5.64e-04 | 5.06e-03 | 48 |
| GO:00487629 | Skin | AK | mesenchymal cell differentiation | 40/1910 | 236/18723 | 9.16e-04 | 7.50e-03 | 40 |
| GO:00018379 | Skin | AK | epithelial to mesenchymal transition | 29/1910 | 157/18723 | 1.15e-03 | 8.86e-03 | 29 |
| GO:0007498 | Skin | AK | mesoderm development | 25/1910 | 129/18723 | 1.21e-03 | 9.28e-03 | 25 |
| GO:0048546 | Skin | AK | digestive tract morphogenesis | 12/1910 | 45/18723 | 1.43e-03 | 1.05e-02 | 12 |
| GO:005110024 | Skin | AK | negative regulation of binding | 29/1910 | 162/18723 | 1.89e-03 | 1.29e-02 | 29 |
| Page: 1 2 3 4 5 6 7 8 9 10 11 12 13 14 15 16 17 18 19 20 21 22 23 24 25 26 27 28 |
| Pathway ID | Tissue | Disease Stage | Description | Gene Ratio | Bg Ratio | pvalue | p.adjust | qvalue | Count |
| Page: 1 |
Top |
Cell-cell communication analysis |
| Identification of potential cell-cell interactions between two cell types and their ligand-receptor pairs for different disease states |
| Ligand | Receptor | LRpair | Pathway | Tissue | Disease Stage |
| Page: 1 |
Top |
Single-cell gene regulatory network inference analysis |
| Find out the significant the regulons (TFs) and the target genes of each regulon across cell types for different disease states |
| TF | Cell Type | Tissue | Disease Stage | Target Gene | RSS | Regulon Activity |
| ∗The dot plots of a searched regulon are shown for all cell subpopulations in each disease state of each tissue based on the regulon specific score inferred using pySCENIC and by calculating the average expression. |
| Page: 1 |
Top |
Somatic mutation of malignant transformation related genes |
| Annotation of somatic variants for genes involved in malignant transformation |
| Hugo Symbol | Variant Class | Variant Classification | dbSNP RS | HGVSc | HGVSp | HGVSp Short | SWISSPROT | BIOTYPE | SIFT | PolyPhen | Tumor Sample Barcode | Tissue | Histology | Sex | Age | Stage | Therapy Types | Drugs | Outcome |
| EPB41L5 | SNV | Missense_Mutation | c.391C>T | p.Arg131Cys | p.R131C | Q9HCM4 | protein_coding | deleterious(0) | probably_damaging(0.912) | TCGA-A7-A26F-01 | Breast | breast invasive carcinoma | Female | <65 | I/II | Chemotherapy | taxotere | SD | |
| EPB41L5 | SNV | Missense_Mutation | c.966C>G | p.Phe322Leu | p.F322L | Q9HCM4 | protein_coding | deleterious(0) | probably_damaging(0.999) | TCGA-AR-A0TX-01 | Breast | breast invasive carcinoma | Female | <65 | I/II | Unknown | Unknown | SD | |
| EPB41L5 | SNV | Missense_Mutation | c.1851N>T | p.Met617Ile | p.M617I | Q9HCM4 | protein_coding | tolerated_low_confidence(0.5) | benign(0.003) | TCGA-BH-A0DK-01 | Breast | breast invasive carcinoma | Female | <65 | I/II | Hormone Therapy | tamoxiphen | SD | |
| EPB41L5 | SNV | Missense_Mutation | novel | c.1279N>T | p.Pro427Ser | p.P427S | Q9HCM4 | protein_coding | tolerated(0.54) | benign(0.075) | TCGA-D8-A1JF-01 | Breast | breast invasive carcinoma | Female | >=65 | III/IV | Unknown | Unknown | SD |
| EPB41L5 | SNV | Missense_Mutation | c.274N>C | p.Ala92Pro | p.A92P | Q9HCM4 | protein_coding | tolerated(0.09) | probably_damaging(0.994) | TCGA-D8-A27F-01 | Breast | breast invasive carcinoma | Female | <65 | I/II | Chemotherapy | adriamycin+cyclophosphamide | SD | |
| EPB41L5 | SNV | Missense_Mutation | novel | c.1900G>A | p.Glu634Lys | p.E634K | Q9HCM4 | protein_coding | deleterious_low_confidence(0.04) | benign(0.214) | TCGA-VS-A9UP-01 | Cervix | cervical & endocervical cancer | Female | <65 | I/II | Chemotherapy | cisplatin | PD |
| EPB41L5 | SNV | Missense_Mutation | c.473C>T | p.Thr158Ile | p.T158I | Q9HCM4 | protein_coding | deleterious(0.03) | probably_damaging(0.989) | TCGA-AA-3502-01 | Colorectum | colon adenocarcinoma | Male | >=65 | I/II | Unknown | Unknown | SD | |
| EPB41L5 | SNV | Missense_Mutation | c.563N>C | p.Arg188Thr | p.R188T | Q9HCM4 | protein_coding | deleterious(0) | probably_damaging(1) | TCGA-AA-3697-01 | Colorectum | colon adenocarcinoma | Male | >=65 | I/II | Unknown | Unknown | SD | |
| EPB41L5 | SNV | Missense_Mutation | c.2079A>T | p.Lys693Asn | p.K693N | Q9HCM4 | protein_coding | tolerated_low_confidence(0.4) | benign(0.007) | TCGA-AA-3875-01 | Colorectum | colon adenocarcinoma | Female | >=65 | I/II | Unknown | Unknown | SD | |
| EPB41L5 | SNV | Missense_Mutation | rs150028843 | c.433C>G | p.Gln145Glu | p.Q145E | Q9HCM4 | protein_coding | deleterious(0.04) | possibly_damaging(0.892) | TCGA-AA-3984-01 | Colorectum | colon adenocarcinoma | Female | <65 | I/II | Unknown | Unknown | SD |
| Page: 1 2 3 4 5 6 7 8 9 |
Top |
Related drugs of malignant transformation related genes |
| Identification of chemicals and drugs interact with genes involved in malignant transfromation |
| (DGIdb 4.0) |
| Entrez ID | Symbol | Category | Interaction Types | Drug Claim Name | Drug Name | PMIDs |
| Page: 1 |

Copyright 2023-Present -The University of Texas Health Science Center at Houston |