
|
|||||
|
 | |
| |
| |
| |
| |
| |
|
Gene: DTX3L |
Gene summary for DTX3L |
| Gene information | Species | Human | Gene symbol | DTX3L | Gene ID | 151636 |
| Gene name | deltex E3 ubiquitin ligase 3L | |
| Gene Alias | BBAP | |
| Cytomap | 3q21.1 | |
| Gene Type | protein-coding | GO ID | GO:0000209 | UniProtAcc | Q8TDB6 |
Top |
Malignant transformation analysis |
| Identification of the aberrant gene expression in precancerous and cancerous lesions by comparing the gene expression of stem-like cells in diseased tissues with normal stem cells |
| Entrez ID | Symbol | Replicates | Species | Organ | Tissue | Adj P-value | Log2FC | Malignancy |
| 151636 | DTX3L | HTA11_347_2000001011 | Human | Colorectum | AD | 3.69e-10 | 3.15e-01 | -0.1954 |
| 151636 | DTX3L | HTA11_1391_2000001011 | Human | Colorectum | AD | 1.97e-10 | 3.84e-01 | -0.059 |
| 151636 | DTX3L | HTA11_99999970781_79442 | Human | Colorectum | MSS | 8.75e-10 | 3.67e-01 | 0.294 |
| 151636 | DTX3L | HTA11_99999965062_69753 | Human | Colorectum | MSI-H | 1.43e-04 | 7.68e-01 | 0.3487 |
| 151636 | DTX3L | HTA11_99999971662_82457 | Human | Colorectum | MSS | 7.51e-03 | 2.04e-01 | 0.3859 |
| 151636 | DTX3L | LZE2T | Human | Esophagus | ESCC | 2.66e-05 | 5.04e-01 | 0.082 |
| 151636 | DTX3L | LZE4T | Human | Esophagus | ESCC | 6.17e-12 | 4.16e-01 | 0.0811 |
| 151636 | DTX3L | LZE5T | Human | Esophagus | ESCC | 1.07e-03 | 1.94e-01 | 0.0514 |
| 151636 | DTX3L | LZE7T | Human | Esophagus | ESCC | 2.00e-02 | 1.91e-01 | 0.0667 |
| 151636 | DTX3L | LZE8T | Human | Esophagus | ESCC | 2.31e-11 | 2.99e-01 | 0.067 |
| 151636 | DTX3L | LZE20T | Human | Esophagus | ESCC | 5.58e-05 | 1.93e-01 | 0.0662 |
| 151636 | DTX3L | LZE22T | Human | Esophagus | ESCC | 1.42e-04 | 3.05e-01 | 0.068 |
| 151636 | DTX3L | LZE24T | Human | Esophagus | ESCC | 8.89e-32 | 7.58e-01 | 0.0596 |
| 151636 | DTX3L | LZE6T | Human | Esophagus | ESCC | 5.75e-03 | 1.78e-01 | 0.0845 |
| 151636 | DTX3L | P1T-E | Human | Esophagus | ESCC | 2.67e-14 | 6.26e-01 | 0.0875 |
| 151636 | DTX3L | P2T-E | Human | Esophagus | ESCC | 2.24e-24 | 5.20e-01 | 0.1177 |
| 151636 | DTX3L | P4T-E | Human | Esophagus | ESCC | 1.37e-12 | 2.09e-01 | 0.1323 |
| 151636 | DTX3L | P5T-E | Human | Esophagus | ESCC | 6.67e-17 | 3.54e-01 | 0.1327 |
| 151636 | DTX3L | P8T-E | Human | Esophagus | ESCC | 1.87e-44 | 8.31e-01 | 0.0889 |
| 151636 | DTX3L | P9T-E | Human | Esophagus | ESCC | 1.34e-33 | 7.42e-01 | 0.1131 |
| Page: 1 2 3 4 5 6 |
| Tissue | Expression Dynamics | Abbreviation |
| Colorectum (GSE201348) |  | FAP: Familial adenomatous polyposis |
| CRC: Colorectal cancer | ||
| Colorectum (HTA11) |  | AD: Adenomas |
| SER: Sessile serrated lesions | ||
| MSI-H: Microsatellite-high colorectal cancer | ||
| MSS: Microsatellite stable colorectal cancer | ||
| Esophagus | 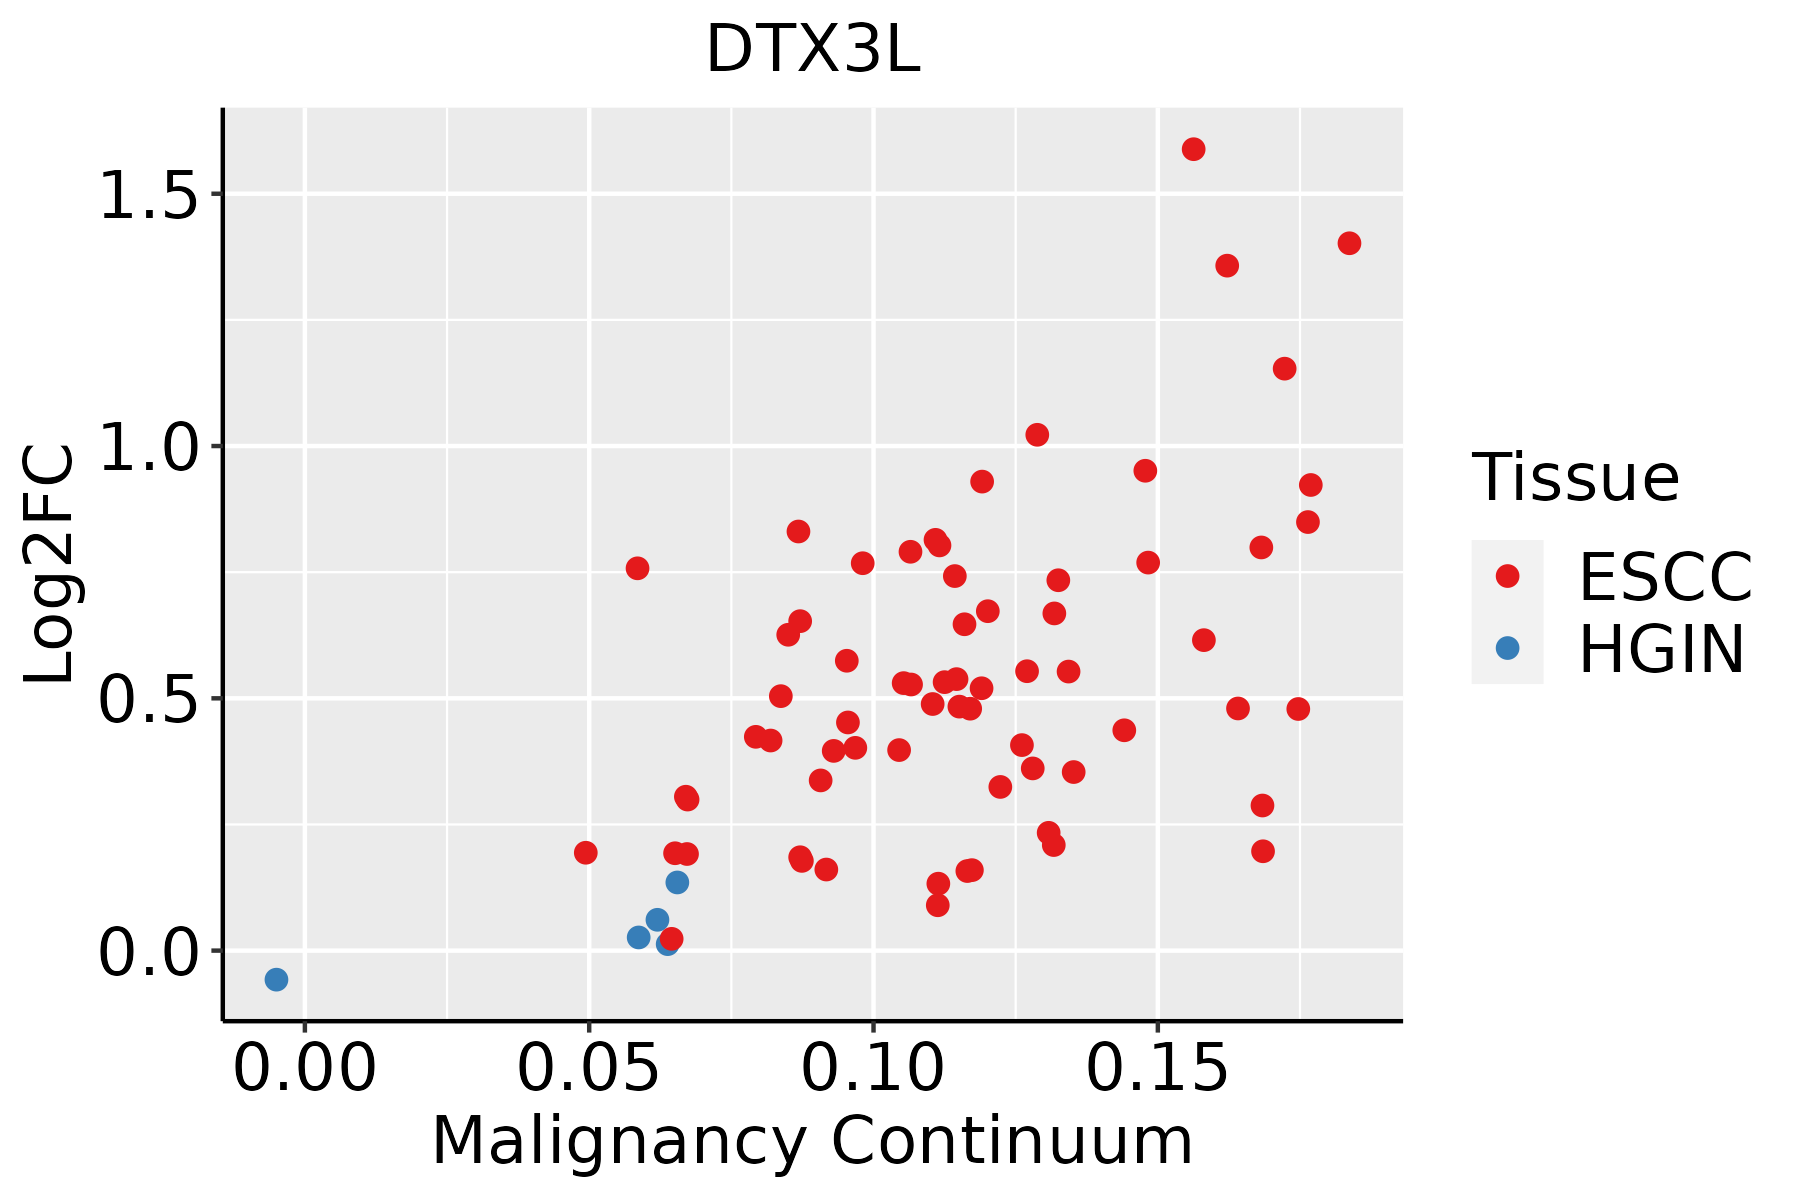 | ESCC: Esophageal squamous cell carcinoma |
| HGIN: High-grade intraepithelial neoplasias | ||
| LGIN: Low-grade intraepithelial neoplasias | ||
| Liver | 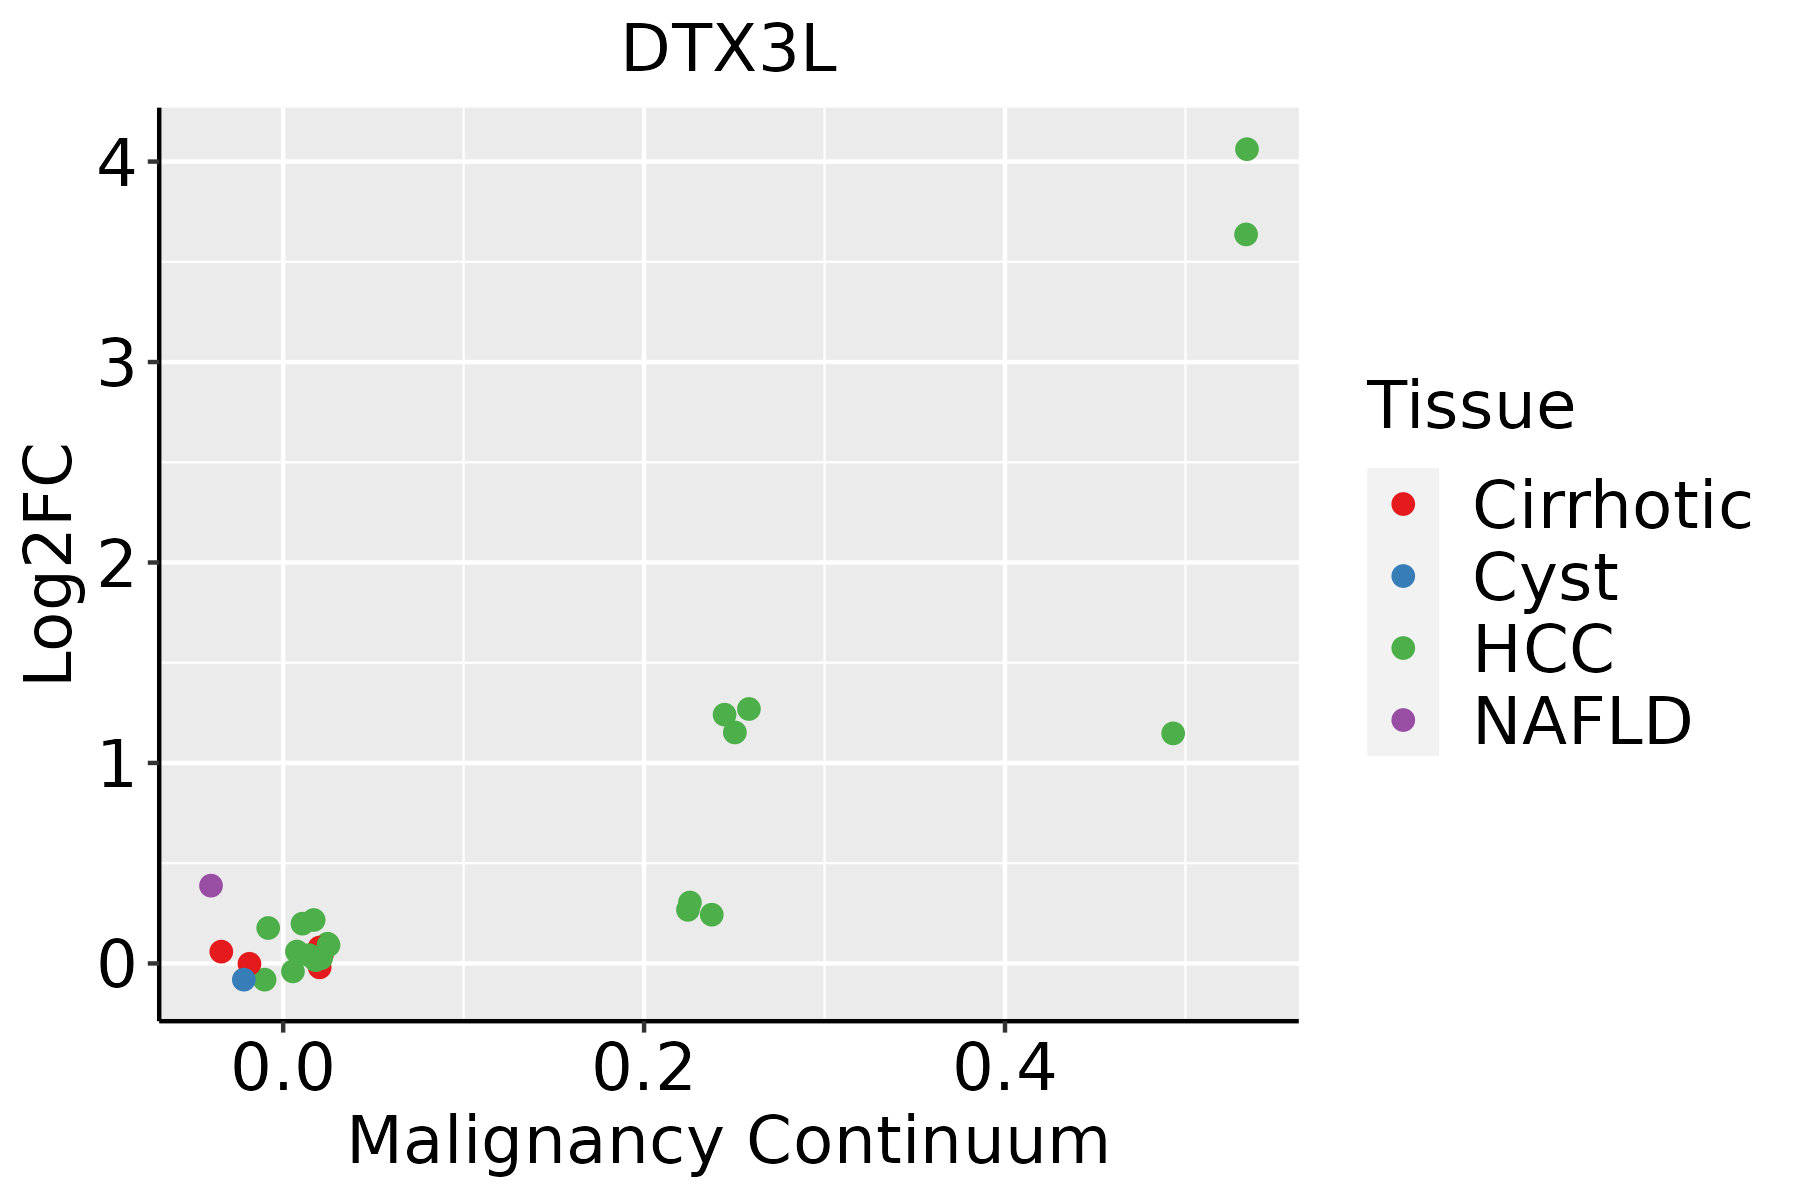 | HCC: Hepatocellular carcinoma |
| NAFLD: Non-alcoholic fatty liver disease | ||
| Oral Cavity |  | EOLP: Erosive Oral lichen planus |
| LP: leukoplakia | ||
| NEOLP: Non-erosive oral lichen planus | ||
| OSCC: Oral squamous cell carcinoma | ||
| Skin | 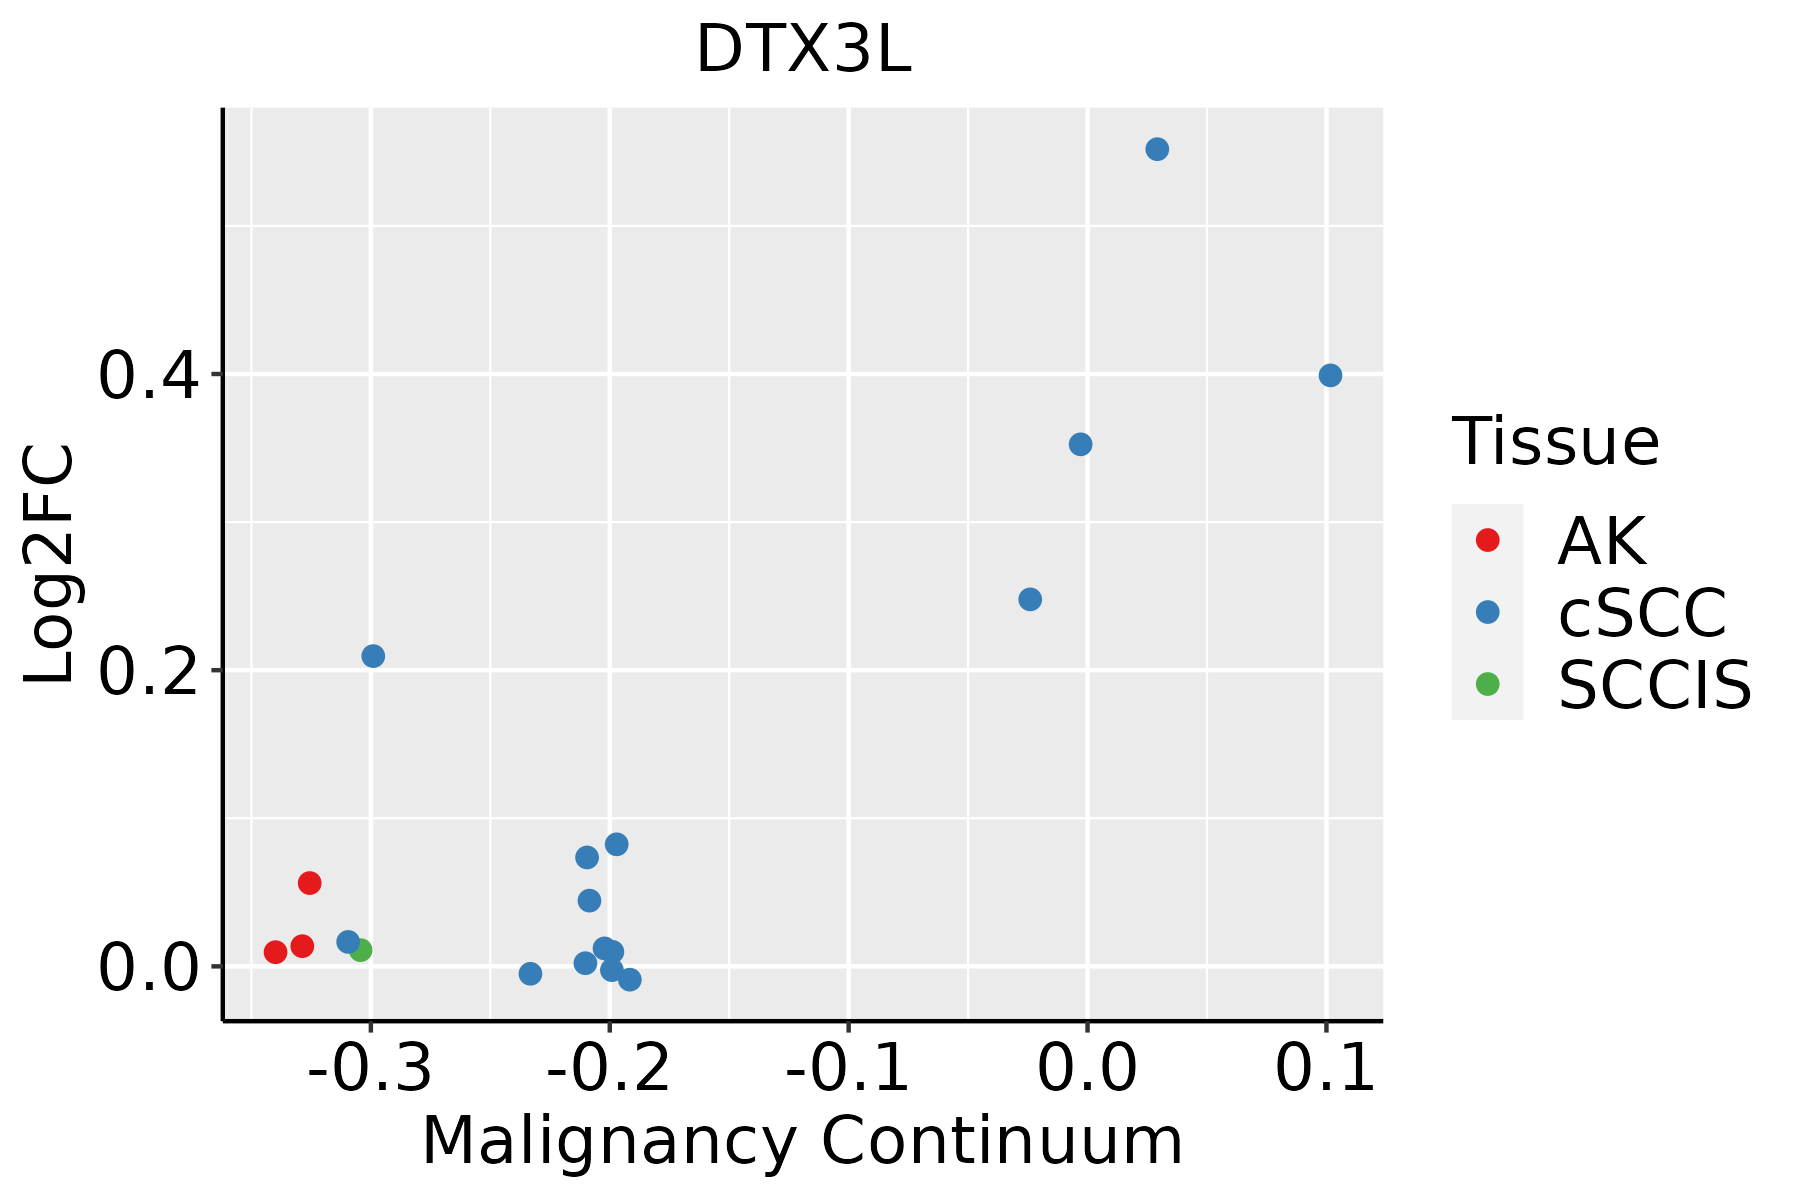 | AK: Actinic keratosis |
| cSCC: Cutaneous squamous cell carcinoma | ||
| SCCIS:squamous cell carcinoma in situ | ||
| Thyroid | 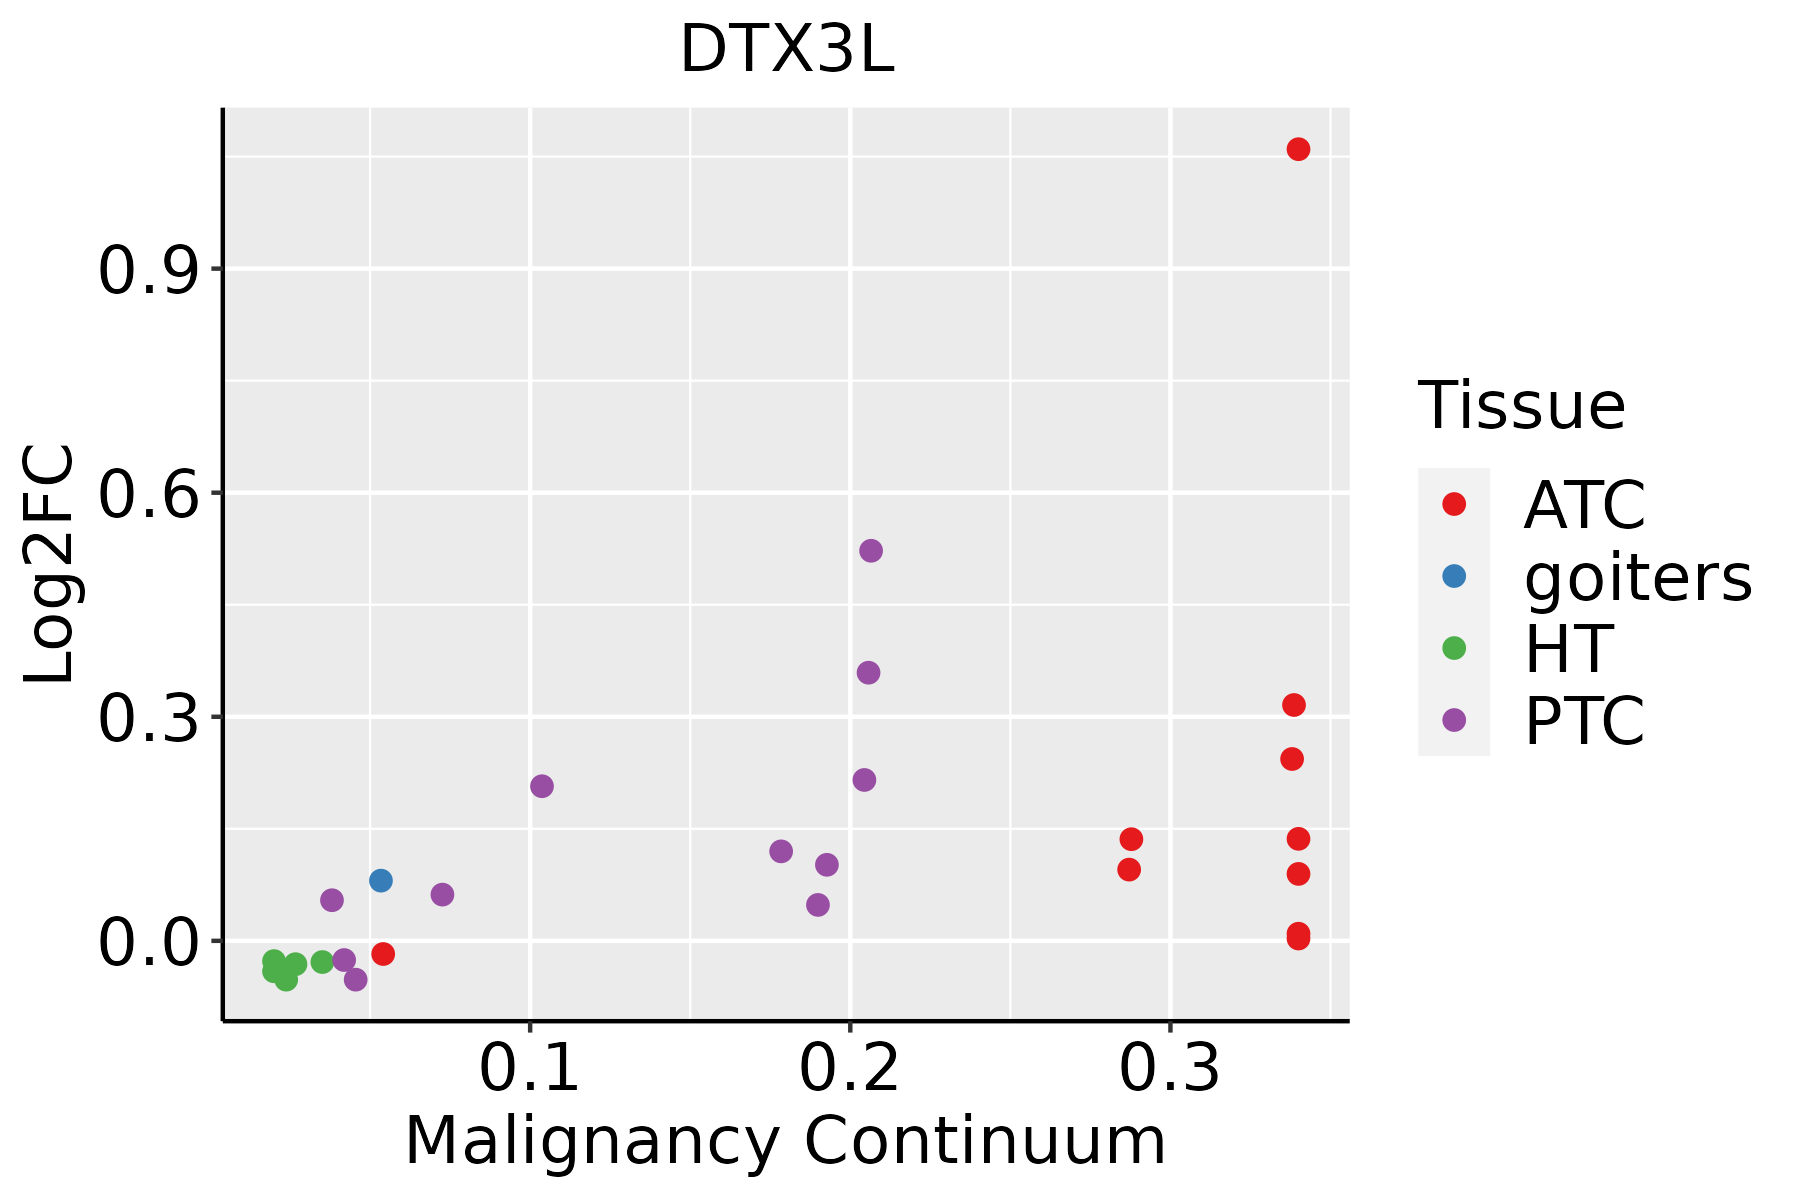 | ATC: Anaplastic thyroid cancer |
| HT: Hashimoto's thyroiditis | ||
| PTC: Papillary thyroid cancer |
| ∗log2FC in expression of this searched gene in stem-like cells from each diseased tissue sample relative to stem-like cells in normal samples in each tissue plotted against the malignancy continuum. Samples are colored based on if they are from different disease stage. |
Top |
Malignant transformation related pathway analysis |
| Find out the enriched GO biological processes and KEGG pathways involved in transition from healthy to precancer to cancer |
| Tissue | Disease Stage | Enriched GO biological Processes |
| Colorectum | AD |  |
| Colorectum | SER |  |
| Colorectum | MSS |  |
| Colorectum | MSI-H |  |
| Colorectum | FAP |  |
| ∗Top 15 enriched GO BP terms are showed in the bar plot of each disease state in each tissue. Each row represents a significant GO biological process which is colored according to the -log10(p.adjust). |
| Page: 1 2 3 4 5 6 7 8 9 |
| GO ID | Tissue | Disease Stage | Description | Gene Ratio | Bg Ratio | pvalue | p.adjust | Count |
| GO:0031331210 | Thyroid | ATC | positive regulation of cellular catabolic process | 258/6293 | 427/18723 | 2.09e-30 | 1.65e-27 | 258 |
| GO:003450423 | Thyroid | ATC | protein localization to nucleus | 175/6293 | 290/18723 | 6.23e-21 | 1.23e-18 | 175 |
| GO:190332034 | Thyroid | ATC | regulation of protein modification by small protein conjugation or removal | 152/6293 | 242/18723 | 9.76e-21 | 1.71e-18 | 152 |
| GO:1903829210 | Thyroid | ATC | positive regulation of cellular protein localization | 167/6293 | 276/18723 | 3.32e-20 | 5.38e-18 | 167 |
| GO:005109834 | Thyroid | ATC | regulation of binding | 203/6293 | 363/18723 | 1.18e-18 | 1.55e-16 | 203 |
| GO:003139634 | Thyroid | ATC | regulation of protein ubiquitination | 132/6293 | 210/18723 | 3.13e-18 | 3.98e-16 | 132 |
| GO:001657017 | Thyroid | ATC | histone modification | 243/6293 | 463/18723 | 2.23e-17 | 2.27e-15 | 243 |
| GO:0000209110 | Thyroid | ATC | protein polyubiquitination | 134/6293 | 236/18723 | 1.86e-13 | 9.20e-12 | 134 |
| GO:190018023 | Thyroid | ATC | regulation of protein localization to nucleus | 87/6293 | 136/18723 | 3.94e-13 | 1.79e-11 | 87 |
| GO:005109934 | Thyroid | ATC | positive regulation of binding | 103/6293 | 173/18723 | 2.19e-12 | 9.05e-11 | 103 |
| GO:005105219 | Thyroid | ATC | regulation of DNA metabolic process | 183/6293 | 359/18723 | 5.97e-12 | 2.30e-10 | 183 |
| GO:005134834 | Thyroid | ATC | negative regulation of transferase activity | 144/6293 | 268/18723 | 7.63e-12 | 2.91e-10 | 144 |
| GO:190018222 | Thyroid | ATC | positive regulation of protein localization to nucleus | 60/6293 | 87/18723 | 1.63e-11 | 5.88e-10 | 60 |
| GO:200102026 | Thyroid | ATC | regulation of response to DNA damage stimulus | 121/6293 | 219/18723 | 3.22e-11 | 1.08e-09 | 121 |
| GO:004339327 | Thyroid | ATC | regulation of protein binding | 110/6293 | 196/18723 | 6.99e-11 | 2.22e-09 | 110 |
| GO:0070936110 | Thyroid | ATC | protein K48-linked ubiquitination | 47/6293 | 65/18723 | 1.98e-10 | 5.86e-09 | 47 |
| GO:003139734 | Thyroid | ATC | negative regulation of protein ubiquitination | 56/6293 | 83/18723 | 2.90e-10 | 8.20e-09 | 56 |
| GO:000703423 | Thyroid | ATC | vacuolar transport | 89/6293 | 157/18723 | 2.26e-09 | 5.40e-08 | 89 |
| GO:190332135 | Thyroid | ATC | negative regulation of protein modification by small protein conjugation or removal | 60/6293 | 95/18723 | 3.53e-09 | 8.14e-08 | 60 |
| GO:0051054110 | Thyroid | ATC | positive regulation of DNA metabolic process | 107/6293 | 201/18723 | 7.10e-09 | 1.54e-07 | 107 |
| Page: 1 2 3 4 5 6 7 8 9 10 11 12 13 14 15 16 17 18 19 20 21 22 23 |
| Pathway ID | Tissue | Disease Stage | Description | Gene Ratio | Bg Ratio | pvalue | p.adjust | qvalue | Count |
| hsa043306 | Esophagus | ESCC | Notch signaling pathway | 42/4205 | 62/8465 | 2.97e-03 | 7.97e-03 | 4.08e-03 | 42 |
| hsa0433013 | Esophagus | ESCC | Notch signaling pathway | 42/4205 | 62/8465 | 2.97e-03 | 7.97e-03 | 4.08e-03 | 42 |
| hsa043305 | Oral cavity | OSCC | Notch signaling pathway | 44/3704 | 62/8465 | 1.26e-05 | 5.55e-05 | 2.83e-05 | 44 |
| hsa0433012 | Oral cavity | OSCC | Notch signaling pathway | 44/3704 | 62/8465 | 1.26e-05 | 5.55e-05 | 2.83e-05 | 44 |
| hsa0433021 | Oral cavity | NEOLP | Notch signaling pathway | 21/1112 | 62/8465 | 2.23e-05 | 1.87e-04 | 1.18e-04 | 21 |
| hsa0433031 | Oral cavity | NEOLP | Notch signaling pathway | 21/1112 | 62/8465 | 2.23e-05 | 1.87e-04 | 1.18e-04 | 21 |
| Page: 1 |
Top |
Cell-cell communication analysis |
| Identification of potential cell-cell interactions between two cell types and their ligand-receptor pairs for different disease states |
| Ligand | Receptor | LRpair | Pathway | Tissue | Disease Stage |
| Page: 1 |
Top |
Single-cell gene regulatory network inference analysis |
| Find out the significant the regulons (TFs) and the target genes of each regulon across cell types for different disease states |
| TF | Cell Type | Tissue | Disease Stage | Target Gene | RSS | Regulon Activity |
| ∗The dot plots of a searched regulon are shown for all cell subpopulations in each disease state of each tissue based on the regulon specific score inferred using pySCENIC and by calculating the average expression. |
| Page: 1 |
Top |
Somatic mutation of malignant transformation related genes |
| Annotation of somatic variants for genes involved in malignant transformation |
| Hugo Symbol | Variant Class | Variant Classification | dbSNP RS | HGVSc | HGVSp | HGVSp Short | SWISSPROT | BIOTYPE | SIFT | PolyPhen | Tumor Sample Barcode | Tissue | Histology | Sex | Age | Stage | Therapy Types | Drugs | Outcome |
| DTX3L | SNV | Missense_Mutation | novel | c.552N>G | p.Ile184Met | p.I184M | Q8TDB6 | protein_coding | deleterious(0) | possibly_damaging(0.808) | TCGA-AN-A046-01 | Breast | breast invasive carcinoma | Female | >=65 | I/II | Unknown | Unknown | SD |
| DTX3L | SNV | Missense_Mutation | rs762198657 | c.779N>T | p.Arg260Ile | p.R260I | Q8TDB6 | protein_coding | deleterious(0.01) | possibly_damaging(0.548) | TCGA-AN-A046-01 | Breast | breast invasive carcinoma | Female | >=65 | I/II | Unknown | Unknown | SD |
| DTX3L | SNV | Missense_Mutation | novel | c.564G>C | p.Leu188Phe | p.L188F | Q8TDB6 | protein_coding | tolerated(0.09) | benign(0.065) | TCGA-AO-A0JC-01 | Breast | breast invasive carcinoma | Female | <65 | I/II | Chemotherapy | fluorouracil | SD |
| DTX3L | SNV | Missense_Mutation | rs376434730 | c.1018N>A | p.Glu340Lys | p.E340K | Q8TDB6 | protein_coding | tolerated(0.64) | benign(0.006) | TCGA-AR-A255-01 | Breast | breast invasive carcinoma | Female | <65 | I/II | Targeted Molecular therapy | trastuzumab | SD |
| DTX3L | SNV | Missense_Mutation | c.325N>A | p.Ala109Thr | p.A109T | Q8TDB6 | protein_coding | tolerated(0.51) | benign(0.015) | TCGA-BH-A0HF-01 | Breast | breast invasive carcinoma | Female | >=65 | I/II | Hormone Therapy | arimidex | SD | |
| DTX3L | insertion | In_Frame_Ins | novel | c.2146_2147insGAATGT | p.Pro716delinsArgMetSer | p.P716delinsRMS | Q8TDB6 | protein_coding | TCGA-A8-A08H-01 | Breast | breast invasive carcinoma | Female | >=65 | I/II | Unknown | Unknown | SD | ||
| DTX3L | insertion | Frame_Shift_Ins | novel | c.2147_2148insTTCATTGGCTGGAA | p.Glu717SerfsTer16 | p.E717Sfs*16 | Q8TDB6 | protein_coding | TCGA-A8-A08H-01 | Breast | breast invasive carcinoma | Female | >=65 | I/II | Unknown | Unknown | SD | ||
| DTX3L | insertion | Frame_Shift_Ins | novel | c.597_598insATAAAAC | p.Gln200IlefsTer27 | p.Q200Ifs*27 | Q8TDB6 | protein_coding | TCGA-AC-A3QQ-01 | Breast | breast invasive carcinoma | Female | <65 | I/II | Unknown | Unknown | SD | ||
| DTX3L | insertion | Nonsense_Mutation | novel | c.1347_1348insGGGCATACATAACCACACTGTGCCCTAGTATC | p.Arg450GlyfsTer4 | p.R450Gfs*4 | Q8TDB6 | protein_coding | TCGA-BH-A0AY-01 | Breast | breast invasive carcinoma | Female | <65 | I/II | Chemotherapy | SD | |||
| DTX3L | SNV | Missense_Mutation | novel | c.544N>C | p.Glu182Gln | p.E182Q | Q8TDB6 | protein_coding | deleterious(0.01) | benign(0.352) | TCGA-C5-A1M7-01 | Cervix | cervical & endocervical cancer | Female | <65 | I/II | Unknown | Unknown | SD |
| Page: 1 2 3 4 5 6 7 |
Top |
Related drugs of malignant transformation related genes |
| Identification of chemicals and drugs interact with genes involved in malignant transfromation |
| (DGIdb 4.0) |
| Entrez ID | Symbol | Category | Interaction Types | Drug Claim Name | Drug Name | PMIDs |
| Page: 1 |

Copyright 2023-Present -The University of Texas Health Science Center at Houston |