| Tissue | Expression Dynamics | Abbreviation |
| Cervix |  | CC: Cervix cancer |
| HSIL_HPV: HPV-infected high-grade squamous intraepithelial lesions |
| N_HPV: HPV-infected normal cervix |
| Esophagus |  | ESCC: Esophageal squamous cell carcinoma |
| HGIN: High-grade intraepithelial neoplasias |
| LGIN: Low-grade intraepithelial neoplasias |
| Liver | 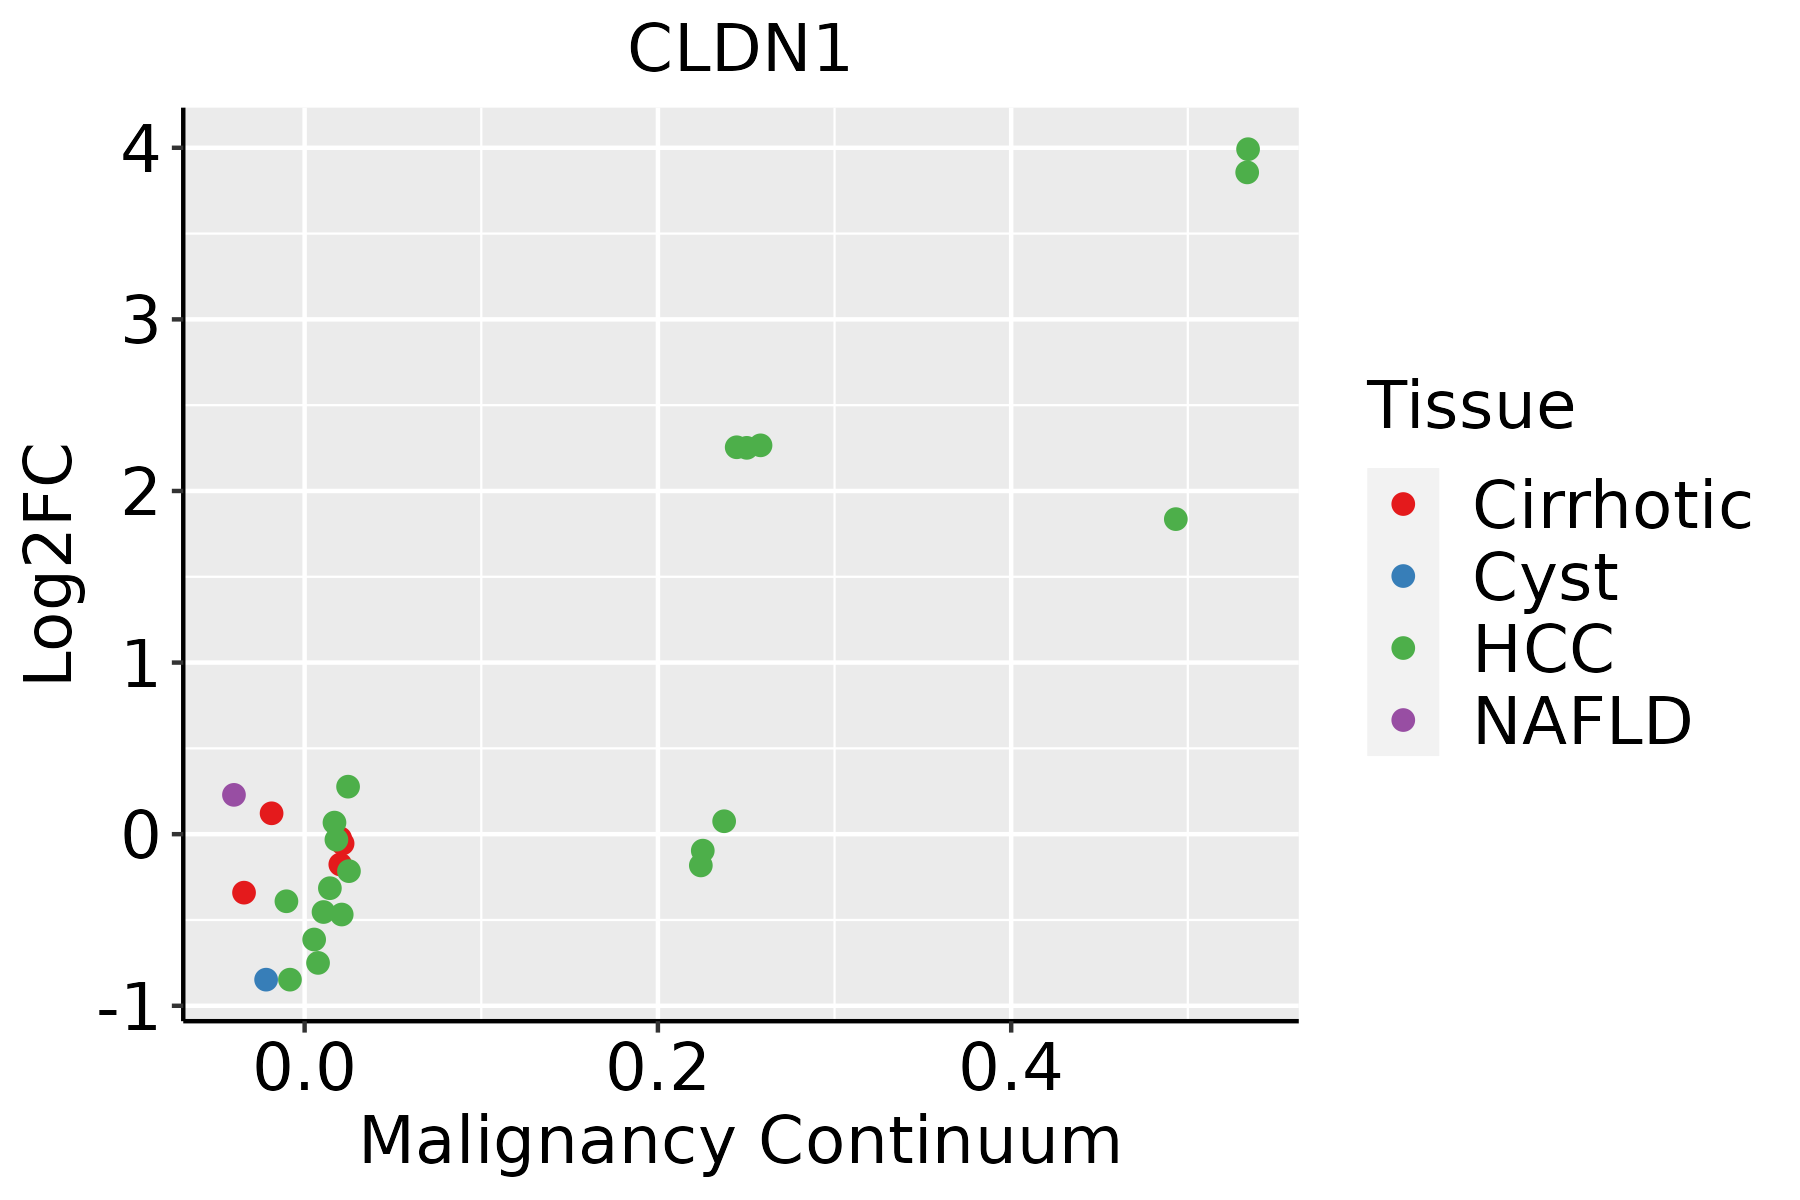 | HCC: Hepatocellular carcinoma |
| NAFLD: Non-alcoholic fatty liver disease |
| Oral Cavity |  | EOLP: Erosive Oral lichen planus |
| LP: leukoplakia |
| NEOLP: Non-erosive oral lichen planus |
| OSCC: Oral squamous cell carcinoma |
| Prostate |  | BPH: Benign Prostatic Hyperplasia |
| Skin |  | AK: Actinic keratosis |
| cSCC: Cutaneous squamous cell carcinoma |
| SCCIS:squamous cell carcinoma in situ |
| Thyroid | 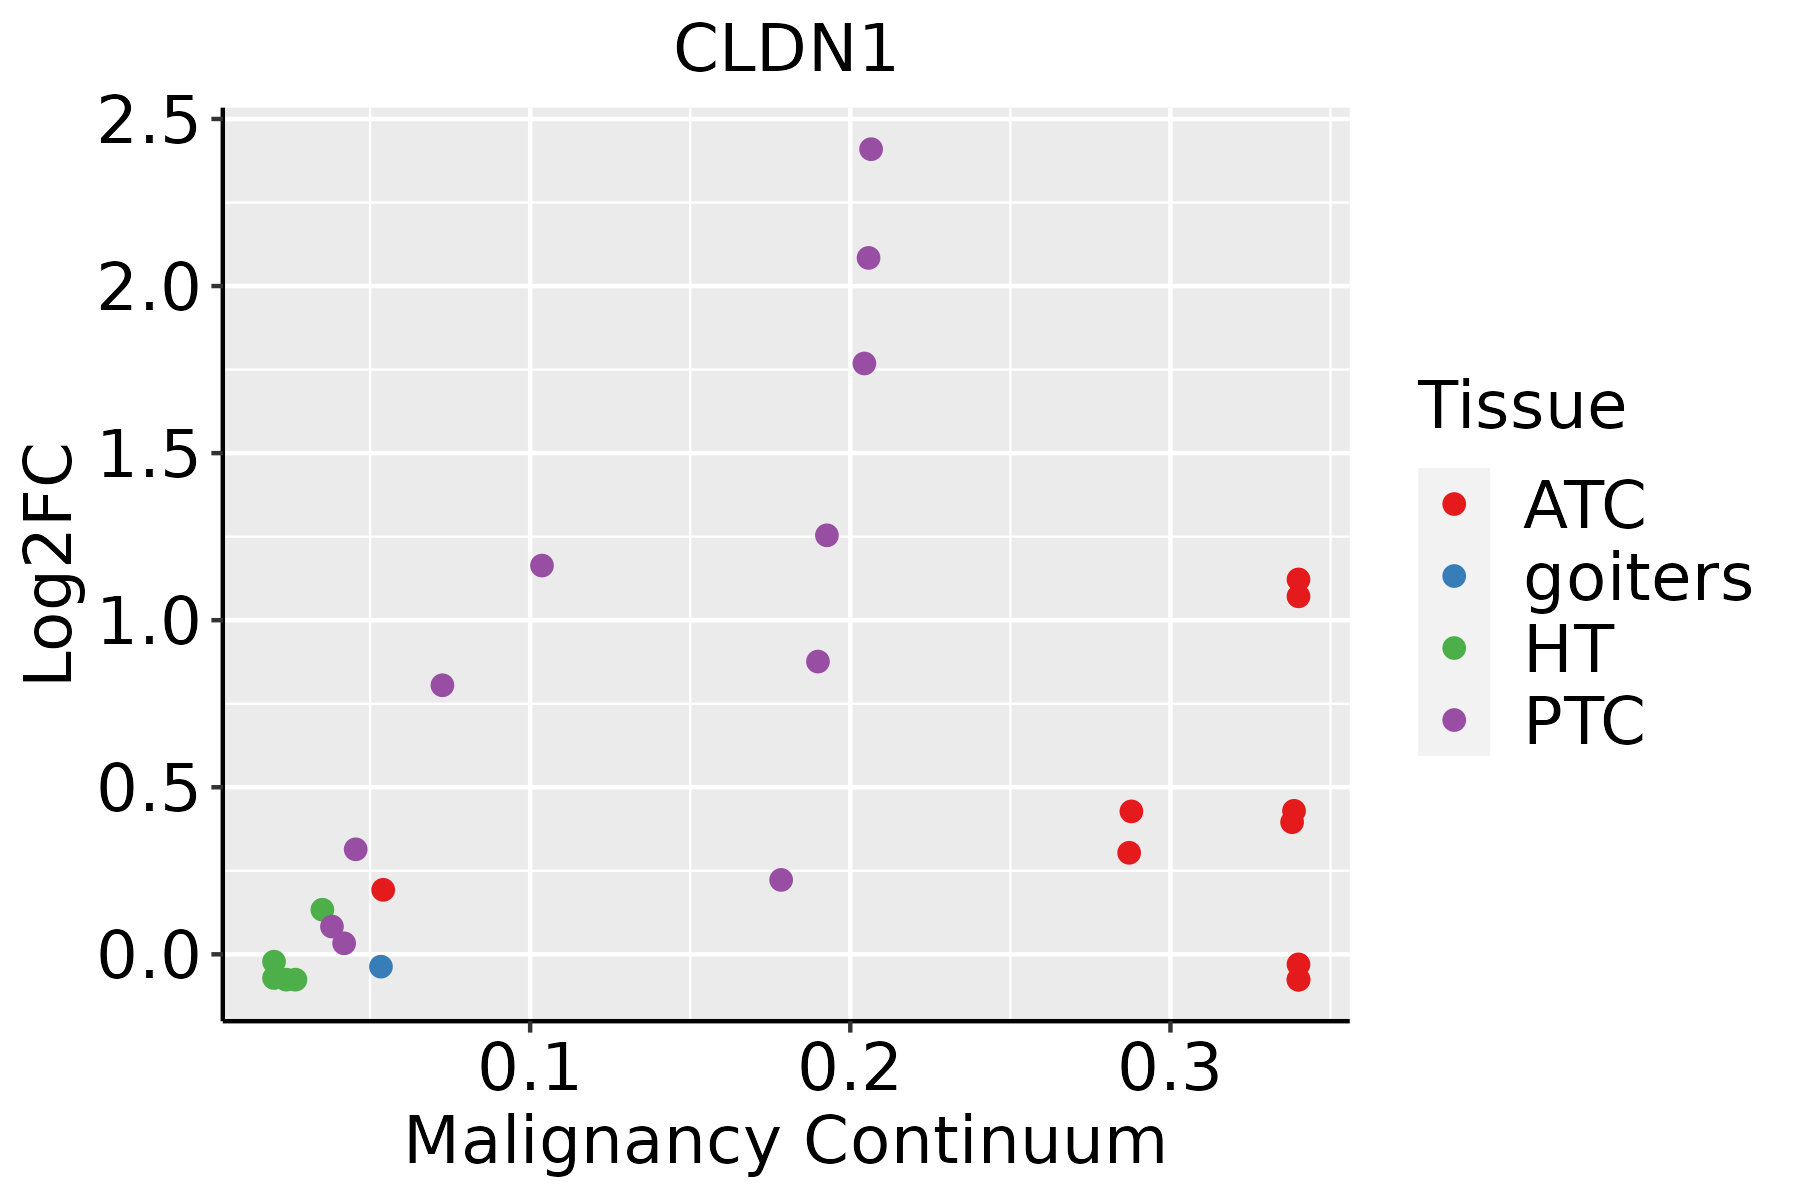 | ATC: Anaplastic thyroid cancer |
| HT: Hashimoto's thyroiditis |
| PTC: Papillary thyroid cancer |
| GO ID | Tissue | Disease Stage | Description | Gene Ratio | Bg Ratio | pvalue | p.adjust | Count |
| GO:00705427 | Oral cavity | OSCC | response to fatty acid | 36/7305 | 64/18723 | 3.82e-03 | 1.57e-02 | 36 |
| GO:004521618 | Oral cavity | OSCC | cell-cell junction organization | 97/7305 | 200/18723 | 3.83e-03 | 1.57e-02 | 97 |
| GO:003432916 | Oral cavity | OSCC | cell junction assembly | 190/7305 | 420/18723 | 4.99e-03 | 1.96e-02 | 190 |
| GO:00102882 | Oral cavity | OSCC | response to lead ion | 16/7305 | 24/18723 | 5.63e-03 | 2.17e-02 | 16 |
| GO:00713987 | Oral cavity | OSCC | cellular response to fatty acid | 23/7305 | 38/18723 | 5.87e-03 | 2.24e-02 | 23 |
| GO:00903039 | Oral cavity | OSCC | positive regulation of wound healing | 33/7305 | 59/18723 | 6.17e-03 | 2.33e-02 | 33 |
| GO:00715486 | Oral cavity | OSCC | response to dexamethasone | 23/7305 | 39/18723 | 9.09e-03 | 3.26e-02 | 23 |
| GO:00335614 | Oral cavity | OSCC | regulation of water loss via skin | 17/7305 | 27/18723 | 1.01e-02 | 3.49e-02 | 17 |
| GO:007124816 | Oral cavity | OSCC | cellular response to metal ion | 93/7305 | 197/18723 | 1.14e-02 | 3.85e-02 | 93 |
| GO:0016032110 | Oral cavity | LP | viral process | 211/4623 | 415/18723 | 4.06e-31 | 3.18e-28 | 211 |
| GO:0019058110 | Oral cavity | LP | viral life cycle | 161/4623 | 317/18723 | 5.99e-24 | 2.21e-21 | 161 |
| GO:0051701110 | Oral cavity | LP | biological process involved in interaction with host | 100/4623 | 203/18723 | 2.72e-14 | 3.10e-12 | 100 |
| GO:0044403110 | Oral cavity | LP | biological process involved in symbiotic interaction | 130/4623 | 290/18723 | 4.23e-14 | 4.64e-12 | 130 |
| GO:0052126110 | Oral cavity | LP | movement in host environment | 87/4623 | 175/18723 | 6.65e-13 | 5.79e-11 | 87 |
| GO:0044409110 | Oral cavity | LP | entry into host | 68/4623 | 151/18723 | 3.72e-08 | 1.33e-06 | 68 |
| GO:000756819 | Oral cavity | LP | aging | 125/4623 | 339/18723 | 3.29e-07 | 9.62e-06 | 125 |
| GO:0046718110 | Oral cavity | LP | viral entry into host cell | 63/4623 | 144/18723 | 4.16e-07 | 1.19e-05 | 63 |
| GO:1901654110 | Oral cavity | LP | response to ketone | 78/4623 | 194/18723 | 1.24e-06 | 3.03e-05 | 78 |
| GO:0048545110 | Oral cavity | LP | response to steroid hormone | 122/4623 | 339/18723 | 1.91e-06 | 4.39e-05 | 122 |
| GO:000188919 | Oral cavity | LP | liver development | 62/4623 | 147/18723 | 2.32e-06 | 5.14e-05 | 62 |
| Pathway ID | Tissue | Disease Stage | Description | Gene Ratio | Bg Ratio | pvalue | p.adjust | qvalue | Count |
| hsa0513020 | Cervix | CC | Pathogenic Escherichia coli infection | 63/1267 | 197/8465 | 9.28e-10 | 2.00e-08 | 1.19e-08 | 63 |
| hsa0453020 | Cervix | CC | Tight junction | 49/1267 | 169/8465 | 1.87e-06 | 1.78e-05 | 1.05e-05 | 49 |
| hsa0467020 | Cervix | CC | Leukocyte transendothelial migration | 36/1267 | 114/8465 | 5.22e-06 | 4.83e-05 | 2.86e-05 | 36 |
| hsa045147 | Cervix | CC | Cell adhesion molecules | 36/1267 | 157/8465 | 4.94e-03 | 1.67e-02 | 9.86e-03 | 36 |
| hsa05130110 | Cervix | CC | Pathogenic Escherichia coli infection | 63/1267 | 197/8465 | 9.28e-10 | 2.00e-08 | 1.19e-08 | 63 |
| hsa04530110 | Cervix | CC | Tight junction | 49/1267 | 169/8465 | 1.87e-06 | 1.78e-05 | 1.05e-05 | 49 |
| hsa04670110 | Cervix | CC | Leukocyte transendothelial migration | 36/1267 | 114/8465 | 5.22e-06 | 4.83e-05 | 2.86e-05 | 36 |
| hsa0451412 | Cervix | CC | Cell adhesion molecules | 36/1267 | 157/8465 | 4.94e-03 | 1.67e-02 | 9.86e-03 | 36 |
| hsa0513044 | Cervix | N_HPV | Pathogenic Escherichia coli infection | 25/349 | 197/8465 | 4.71e-07 | 8.00e-06 | 6.25e-06 | 25 |
| hsa0451441 | Cervix | N_HPV | Cell adhesion molecules | 18/349 | 157/8465 | 7.71e-05 | 8.06e-04 | 6.30e-04 | 18 |
| hsa0453025 | Cervix | N_HPV | Tight junction | 16/349 | 169/8465 | 1.60e-03 | 1.01e-02 | 7.92e-03 | 16 |
| hsa0467045 | Cervix | N_HPV | Leukocyte transendothelial migration | 12/349 | 114/8465 | 2.50e-03 | 1.45e-02 | 1.13e-02 | 12 |
| hsa0513054 | Cervix | N_HPV | Pathogenic Escherichia coli infection | 25/349 | 197/8465 | 4.71e-07 | 8.00e-06 | 6.25e-06 | 25 |
| hsa0451451 | Cervix | N_HPV | Cell adhesion molecules | 18/349 | 157/8465 | 7.71e-05 | 8.06e-04 | 6.30e-04 | 18 |
| hsa0453035 | Cervix | N_HPV | Tight junction | 16/349 | 169/8465 | 1.60e-03 | 1.01e-02 | 7.92e-03 | 16 |
| hsa0467055 | Cervix | N_HPV | Leukocyte transendothelial migration | 12/349 | 114/8465 | 2.50e-03 | 1.45e-02 | 1.13e-02 | 12 |
| hsa0513039 | Esophagus | HGIN | Pathogenic Escherichia coli infection | 54/1383 | 197/8465 | 4.91e-05 | 6.15e-04 | 4.89e-04 | 54 |
| hsa0453039 | Esophagus | HGIN | Tight junction | 40/1383 | 169/8465 | 8.18e-03 | 4.71e-02 | 3.74e-02 | 40 |
| hsa05130115 | Esophagus | HGIN | Pathogenic Escherichia coli infection | 54/1383 | 197/8465 | 4.91e-05 | 6.15e-04 | 4.89e-04 | 54 |
| hsa04530115 | Esophagus | HGIN | Tight junction | 40/1383 | 169/8465 | 8.18e-03 | 4.71e-02 | 3.74e-02 | 40 |
| Hugo Symbol | Variant Class | Variant Classification | dbSNP RS | HGVSc | HGVSp | HGVSp Short | SWISSPROT | BIOTYPE | SIFT | PolyPhen | Tumor Sample Barcode | Tissue | Histology | Sex | Age | Stage | Therapy Types | Drugs | Outcome |
| CLDN1 | SNV | Missense_Mutation | | c.450N>A | p.Asp150Glu | p.D150E | O95832 | protein_coding | deleterious(0.02) | benign(0.403) | TCGA-AC-A3YI-01 | Breast | breast invasive carcinoma | Female | >=65 | III/IV | Chemotherapy | cytoxan | CR |
| CLDN1 | SNV | Missense_Mutation | novel | c.97N>C | p.Tyr33His | p.Y33H | O95832 | protein_coding | deleterious(0) | possibly_damaging(0.722) | TCGA-XX-A899-01 | Breast | breast invasive carcinoma | Female | <65 | III/IV | Chemotherapy | cytoxan | CR |
| CLDN1 | insertion | In_Frame_Ins | novel | c.228_229insAAAAAGTTATTTAAC | p.Thr76_Leu77insLysLysLeuPheAsn | p.T76_L77insKKLFN | O95832 | protein_coding | | | TCGA-A8-A09G-01 | Breast | breast invasive carcinoma | Female | >=65 | III/IV | Unknown | Unknown | SD |
| CLDN1 | deletion | Frame_Shift_Del | novel | c.485delN | p.Gly162ValfsTer73 | p.G162Vfs*73 | O95832 | protein_coding | | | TCGA-D8-A27V-01 | Breast | breast invasive carcinoma | Female | <65 | I/II | Hormone Therapy | tamoxiphen | SD |
| CLDN1 | SNV | Missense_Mutation | novel | c.391N>G | p.Leu131Val | p.L131V | O95832 | protein_coding | tolerated(0.24) | possibly_damaging(0.759) | TCGA-MA-AA41-01 | Cervix | cervical & endocervical cancer | Female | <65 | I/II | Unknown | Unknown | SD |
| CLDN1 | deletion | Frame_Shift_Del | | c.194_195delNN | p.Lys65SerfsTer3 | p.K65Sfs*3 | O95832 | protein_coding | | | TCGA-G4-6309-01 | Colorectum | colon adenocarcinoma | Female | <65 | III/IV | Chemotherapy | xeloda | PD |
| CLDN1 | SNV | Missense_Mutation | rs147881276 | c.631G>A | p.Val211Met | p.V211M | O95832 | protein_coding | deleterious(0.05) | probably_damaging(0.992) | TCGA-A5-A0VP-01 | Endometrium | uterine corpus endometrioid carcinoma | Female | >=65 | I/II | Unknown | Unknown | SD |
| CLDN1 | SNV | Missense_Mutation | novel | c.221N>T | p.Ser74Ile | p.S74I | O95832 | protein_coding | deleterious(0.01) | possibly_damaging(0.449) | TCGA-AP-A0LM-01 | Endometrium | uterine corpus endometrioid carcinoma | Female | <65 | III/IV | Chemotherapy | cisplatin | SD |
| CLDN1 | SNV | Missense_Mutation | rs772600198 | c.331N>A | p.Asp111Asn | p.D111N | O95832 | protein_coding | tolerated(0.35) | benign(0.279) | TCGA-AX-A1C5-01 | Endometrium | uterine corpus endometrioid carcinoma | Female | <65 | III/IV | Unspecific | Carboplatin | SD |
| CLDN1 | SNV | Missense_Mutation | rs754012333 | c.253N>A | p.Val85Met | p.V85M | O95832 | protein_coding | deleterious(0) | probably_damaging(0.973) | TCGA-B5-A3FA-01 | Endometrium | uterine corpus endometrioid carcinoma | Female | >=65 | I/II | Unknown | Unknown | SD |


