| Tissue | Expression Dynamics | Abbreviation |
| Breast |  | IDC: Invasive ductal carcinoma |
| DCIS: Ductal carcinoma in situ |
| Precancer(BRCA1-mut): Precancerous lesion from BRCA1 mutation carriers |
| Cervix |  | CC: Cervix cancer |
| HSIL_HPV: HPV-infected high-grade squamous intraepithelial lesions |
| N_HPV: HPV-infected normal cervix |
| Colorectum (GSE201348) |  | FAP: Familial adenomatous polyposis |
| CRC: Colorectal cancer |
| Colorectum (HTA11) |  | AD: Adenomas |
| SER: Sessile serrated lesions |
| MSI-H: Microsatellite-high colorectal cancer |
| MSS: Microsatellite stable colorectal cancer |
| Endometrium | 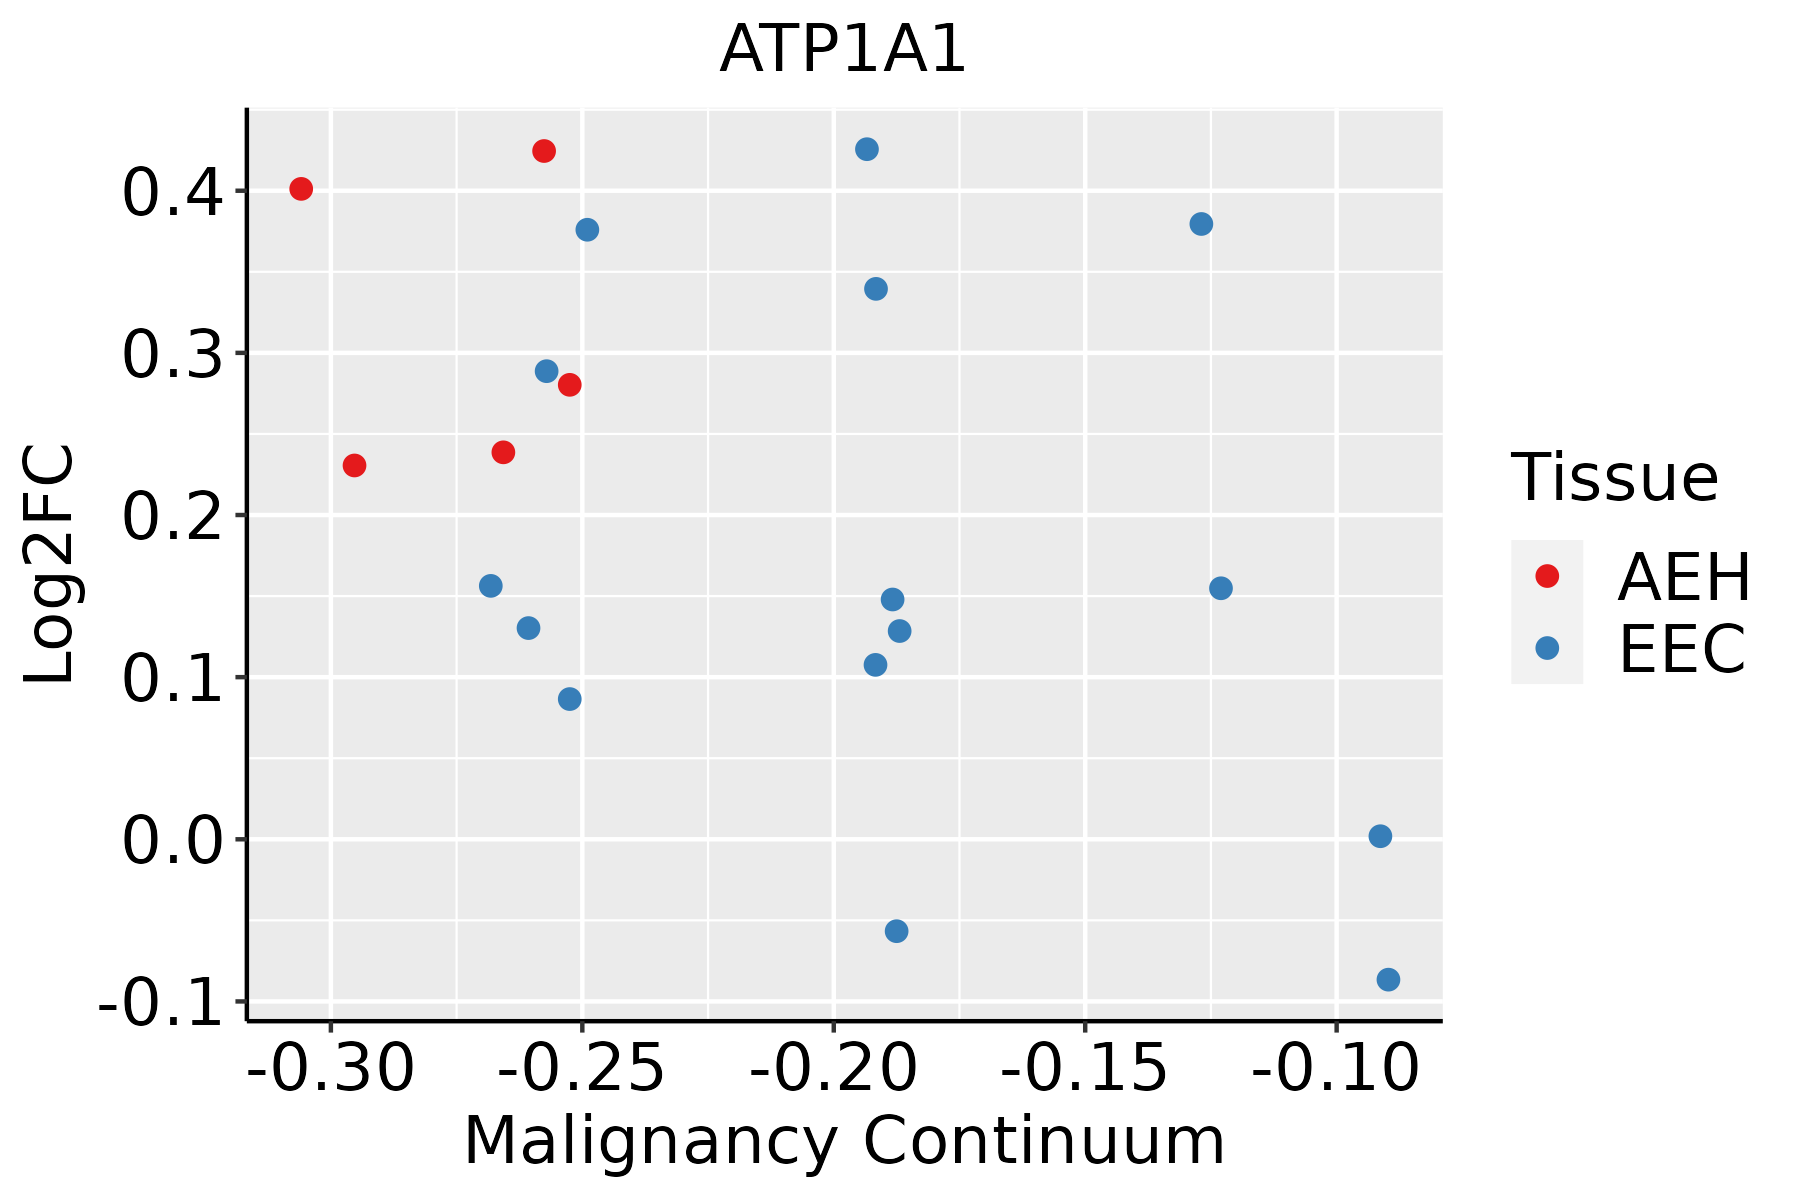 | AEH: Atypical endometrial hyperplasia |
| EEC: Endometrioid Cancer |
| Esophagus | 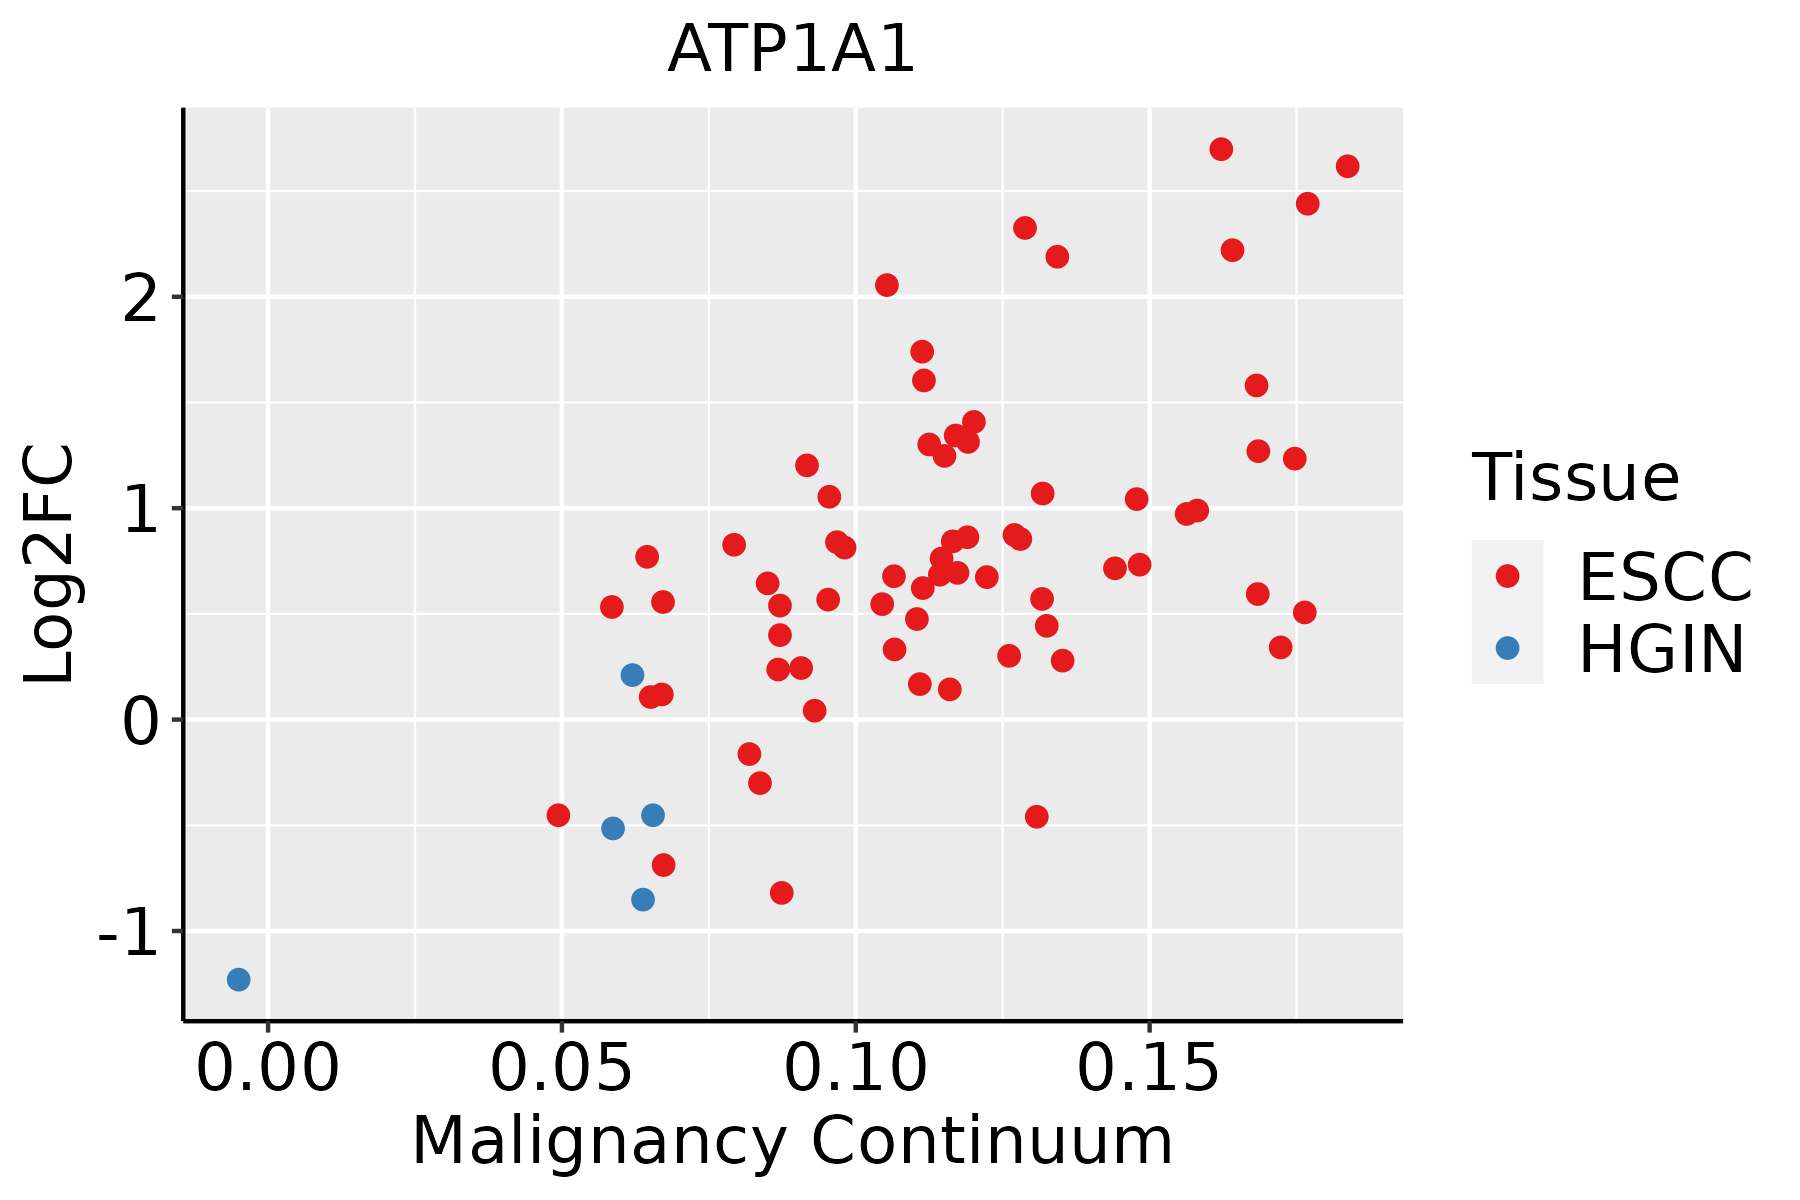 | ESCC: Esophageal squamous cell carcinoma |
| HGIN: High-grade intraepithelial neoplasias |
| LGIN: Low-grade intraepithelial neoplasias |
| Liver |  | HCC: Hepatocellular carcinoma |
| NAFLD: Non-alcoholic fatty liver disease |
| Oral Cavity |  | EOLP: Erosive Oral lichen planus |
| LP: leukoplakia |
| NEOLP: Non-erosive oral lichen planus |
| OSCC: Oral squamous cell carcinoma |
| Prostate |  | BPH: Benign Prostatic Hyperplasia |
| Skin | 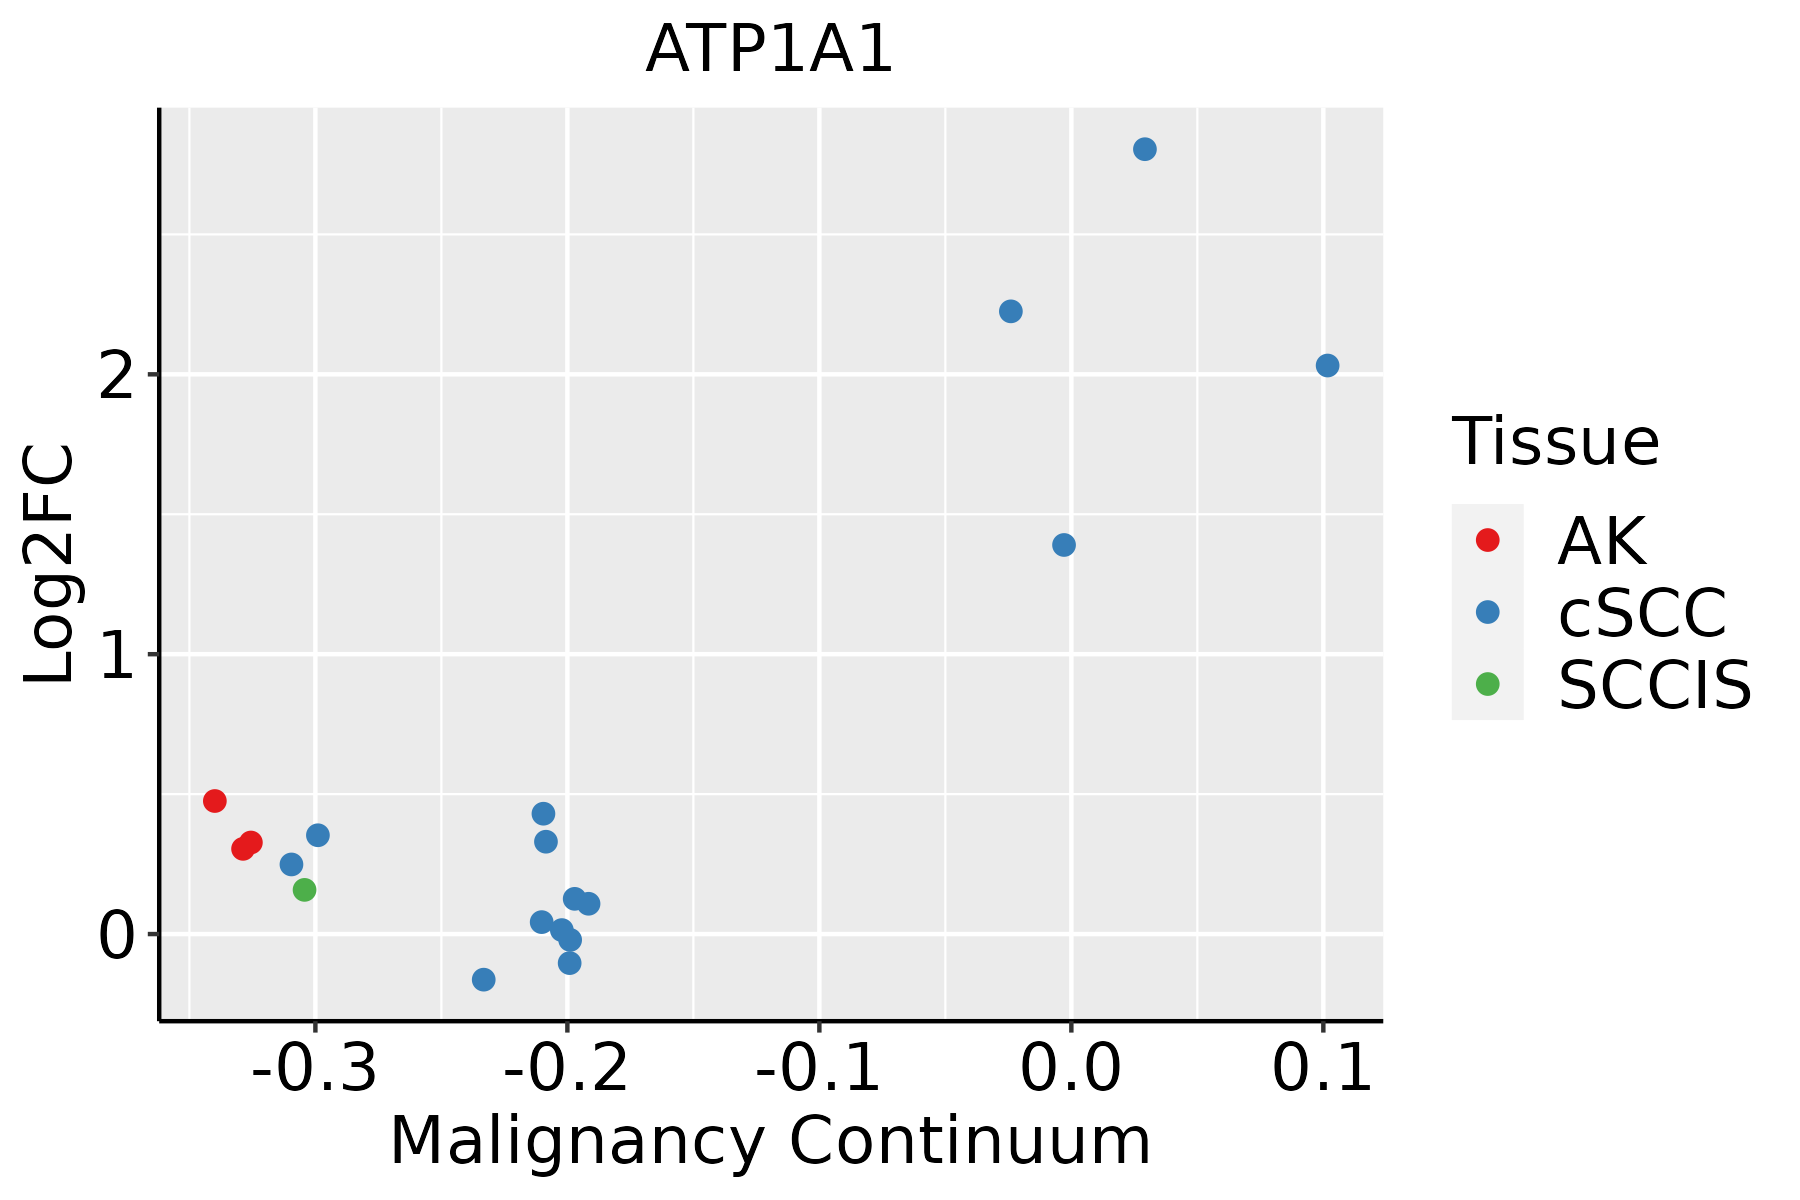 | AK: Actinic keratosis |
| cSCC: Cutaneous squamous cell carcinoma |
| SCCIS:squamous cell carcinoma in situ |
| Thyroid |  | ATC: Anaplastic thyroid cancer |
| HT: Hashimoto's thyroiditis |
| PTC: Papillary thyroid cancer |
| GO ID | Tissue | Disease Stage | Description | Gene Ratio | Bg Ratio | pvalue | p.adjust | Count |
| GO:007121415 | Prostate | Tumor | cellular response to abiotic stimulus | 92/3246 | 331/18723 | 1.25e-06 | 2.32e-05 | 92 |
| GO:010400415 | Prostate | Tumor | cellular response to environmental stimulus | 92/3246 | 331/18723 | 1.25e-06 | 2.32e-05 | 92 |
| GO:000961214 | Prostate | Tumor | response to mechanical stimulus | 60/3246 | 216/18723 | 8.45e-05 | 8.46e-04 | 60 |
| GO:007126013 | Prostate | Tumor | cellular response to mechanical stimulus | 28/3246 | 81/18723 | 1.39e-04 | 1.27e-03 | 28 |
| GO:000941017 | Prostate | Tumor | response to xenobiotic stimulus | 110/3246 | 462/18723 | 2.13e-04 | 1.84e-03 | 110 |
| GO:009025713 | Prostate | Tumor | regulation of muscle system process | 66/3246 | 252/18723 | 2.54e-04 | 2.13e-03 | 66 |
| GO:001631113 | Prostate | Tumor | dephosphorylation | 98/3246 | 417/18723 | 7.31e-04 | 5.08e-03 | 98 |
| GO:000301214 | Prostate | Tumor | muscle system process | 105/3246 | 452/18723 | 7.44e-04 | 5.14e-03 | 105 |
| GO:008600414 | Prostate | Tumor | regulation of cardiac muscle cell contraction | 14/3246 | 34/18723 | 9.26e-04 | 6.10e-03 | 14 |
| GO:003004815 | Prostate | Tumor | actin filament-based movement | 36/3246 | 127/18723 | 1.38e-03 | 8.62e-03 | 36 |
| GO:190311513 | Prostate | Tumor | regulation of actin filament-based movement | 15/3246 | 39/18723 | 1.42e-03 | 8.80e-03 | 15 |
| GO:00323501 | Prostate | Tumor | regulation of hormone metabolic process | 13/3246 | 35/18723 | 4.14e-03 | 2.08e-02 | 13 |
| GO:000202812 | Prostate | Tumor | regulation of sodium ion transport | 26/3246 | 90/18723 | 4.54e-03 | 2.24e-02 | 26 |
| GO:00192166 | Prostate | Tumor | regulation of lipid metabolic process | 76/3246 | 331/18723 | 5.04e-03 | 2.45e-02 | 76 |
| GO:0046885 | Prostate | Tumor | regulation of hormone biosynthetic process | 9/3246 | 21/18723 | 5.54e-03 | 2.61e-02 | 9 |
| GO:008606413 | Prostate | Tumor | cell communication by electrical coupling involved in cardiac conduction | 10/3246 | 25/18723 | 6.30e-03 | 2.89e-02 | 10 |
| GO:00468905 | Prostate | Tumor | regulation of lipid biosynthetic process | 42/3246 | 171/18723 | 1.02e-02 | 4.28e-02 | 42 |
| GO:004854528 | Skin | AK | response to steroid hormone | 73/1910 | 339/18723 | 4.51e-10 | 5.24e-08 | 73 |
| GO:007121420 | Skin | AK | cellular response to abiotic stimulus | 67/1910 | 331/18723 | 3.15e-08 | 1.71e-06 | 67 |
| GO:010400420 | Skin | AK | cellular response to environmental stimulus | 67/1910 | 331/18723 | 3.15e-08 | 1.71e-06 | 67 |
| Pathway ID | Tissue | Disease Stage | Description | Gene Ratio | Bg Ratio | pvalue | p.adjust | qvalue | Count |
| hsa0426016 | Breast | Precancer | Cardiac muscle contraction | 22/684 | 87/8465 | 9.72e-07 | 1.62e-05 | 1.24e-05 | 22 |
| hsa0496110 | Breast | Precancer | Endocrine and other factor-regulated calcium reabsorption | 11/684 | 53/8465 | 2.92e-03 | 1.81e-02 | 1.39e-02 | 11 |
| hsa0497114 | Breast | Precancer | Gastric acid secretion | 13/684 | 76/8465 | 7.35e-03 | 4.07e-02 | 3.12e-02 | 13 |
| hsa0426017 | Breast | Precancer | Cardiac muscle contraction | 22/684 | 87/8465 | 9.72e-07 | 1.62e-05 | 1.24e-05 | 22 |
| hsa0496111 | Breast | Precancer | Endocrine and other factor-regulated calcium reabsorption | 11/684 | 53/8465 | 2.92e-03 | 1.81e-02 | 1.39e-02 | 11 |
| hsa0497115 | Breast | Precancer | Gastric acid secretion | 13/684 | 76/8465 | 7.35e-03 | 4.07e-02 | 3.12e-02 | 13 |
| hsa0426022 | Breast | IDC | Cardiac muscle contraction | 23/867 | 87/8465 | 1.39e-05 | 1.61e-04 | 1.21e-04 | 23 |
| hsa0491916 | Breast | IDC | Thyroid hormone signaling pathway | 23/867 | 121/8465 | 2.45e-03 | 1.69e-02 | 1.27e-02 | 23 |
| hsa0497122 | Breast | IDC | Gastric acid secretion | 16/867 | 76/8465 | 3.80e-03 | 2.33e-02 | 1.74e-02 | 16 |
| hsa049704 | Breast | IDC | Salivary secretion | 18/867 | 93/8465 | 5.69e-03 | 3.13e-02 | 2.34e-02 | 18 |
| hsa0496121 | Breast | IDC | Endocrine and other factor-regulated calcium reabsorption | 12/867 | 53/8465 | 6.29e-03 | 3.30e-02 | 2.47e-02 | 12 |
| hsa0497812 | Breast | IDC | Mineral absorption | 13/867 | 60/8465 | 6.73e-03 | 3.42e-02 | 2.56e-02 | 13 |
| hsa0426032 | Breast | IDC | Cardiac muscle contraction | 23/867 | 87/8465 | 1.39e-05 | 1.61e-04 | 1.21e-04 | 23 |
| hsa0491917 | Breast | IDC | Thyroid hormone signaling pathway | 23/867 | 121/8465 | 2.45e-03 | 1.69e-02 | 1.27e-02 | 23 |
| hsa0497132 | Breast | IDC | Gastric acid secretion | 16/867 | 76/8465 | 3.80e-03 | 2.33e-02 | 1.74e-02 | 16 |
| hsa0497011 | Breast | IDC | Salivary secretion | 18/867 | 93/8465 | 5.69e-03 | 3.13e-02 | 2.34e-02 | 18 |
| hsa0496131 | Breast | IDC | Endocrine and other factor-regulated calcium reabsorption | 12/867 | 53/8465 | 6.29e-03 | 3.30e-02 | 2.47e-02 | 12 |
| hsa0497813 | Breast | IDC | Mineral absorption | 13/867 | 60/8465 | 6.73e-03 | 3.42e-02 | 2.56e-02 | 13 |
| hsa0491918 | Cervix | CC | Thyroid hormone signaling pathway | 33/1267 | 121/8465 | 3.11e-04 | 1.65e-03 | 9.78e-04 | 33 |
| hsa0497116 | Cervix | CC | Gastric acid secretion | 20/1267 | 76/8465 | 6.93e-03 | 2.27e-02 | 1.34e-02 | 20 |
| Hugo Symbol | Variant Class | Variant Classification | dbSNP RS | HGVSc | HGVSp | HGVSp Short | SWISSPROT | BIOTYPE | SIFT | PolyPhen | Tumor Sample Barcode | Tissue | Histology | Sex | Age | Stage | Therapy Types | Drugs | Outcome |
| ATP1A1 | SNV | Missense_Mutation | novel | c.784G>T | p.Gly262Trp | p.G262W | P05023 | protein_coding | deleterious(0) | probably_damaging(0.999) | TCGA-A7-A0DB-01 | Breast | breast invasive carcinoma | Female | <65 | I/II | Hormone Therapy | arimidex | SD |
| ATP1A1 | SNV | Missense_Mutation | | c.208G>C | p.Glu70Gln | p.E70Q | P05023 | protein_coding | tolerated(0.09) | benign(0.258) | TCGA-AC-A23H-01 | Breast | breast invasive carcinoma | Female | >=65 | I/II | Unknown | Unknown | PD |
| ATP1A1 | SNV | Missense_Mutation | novel | c.1522A>C | p.Lys508Gln | p.K508Q | P05023 | protein_coding | deleterious(0) | probably_damaging(1) | TCGA-AN-A046-01 | Breast | breast invasive carcinoma | Female | >=65 | I/II | Unknown | Unknown | SD |
| ATP1A1 | SNV | Missense_Mutation | | c.1553N>A | p.Cys518Tyr | p.C518Y | P05023 | protein_coding | deleterious(0) | probably_damaging(0.995) | TCGA-B6-A0IB-01 | Breast | breast invasive carcinoma | Female | <65 | III/IV | Unknown | Unknown | PD |
| ATP1A1 | SNV | Missense_Mutation | novel | c.1534N>A | p.Glu512Lys | p.E512K | P05023 | protein_coding | deleterious(0.01) | probably_damaging(1) | TCGA-BH-A0B6-01 | Breast | breast invasive carcinoma | Female | <65 | I/II | Unknown | Unknown | SD |
| ATP1A1 | SNV | Missense_Mutation | | c.2450T>C | p.Val817Ala | p.V817A | P05023 | protein_coding | tolerated(0.06) | possibly_damaging(0.466) | TCGA-BH-A18G-01 | Breast | breast invasive carcinoma | Female | >=65 | I/II | Unknown | Unknown | SD |
| ATP1A1 | SNV | Missense_Mutation | | c.2175G>T | p.Leu725Phe | p.L725F | P05023 | protein_coding | deleterious(0.01) | possibly_damaging(0.747) | TCGA-C8-A1HM-01 | Breast | breast invasive carcinoma | Female | >=65 | I/II | Chemotherapy | doxorubicin | CR |
| ATP1A1 | SNV | Missense_Mutation | | c.1223G>A | p.Gly408Asp | p.G408D | P05023 | protein_coding | tolerated(0.06) | benign(0.363) | TCGA-E2-A14Y-01 | Breast | breast invasive carcinoma | Female | <65 | I/II | Chemotherapy | carboplatin | SD |
| ATP1A1 | insertion | In_Frame_Ins | novel | c.117_118insCTCACCCTTTGCCTGTCAGTTGTTCAGCGTGTAACAGTTCCCTGC | p.Val39_Ser40insLeuThrLeuCysLeuSerValValGlnArgValThrValProCys | p.V39_S40insLTLCLSVVQRVTVPC | P05023 | protein_coding | | | TCGA-AN-A04A-01 | Breast | breast invasive carcinoma | Female | <65 | III/IV | Unknown | Unknown | SD |
| ATP1A1 | insertion | Frame_Shift_Ins | novel | c.2365_2366insTACCCCAGAAAAGGGAAAA | p.Pro789LeufsTer29 | p.P789Lfs*29 | P05023 | protein_coding | | | TCGA-AO-A0JD-01 | Breast | breast invasive carcinoma | Female | <65 | III/IV | Chemotherapy | cyclophosphamide | SD |
| Entrez ID | Symbol | Category | Interaction Types | Drug Claim Name | Drug Name | PMIDs |
| 476 | ATP1A1 | ION CHANNEL, DRUGGABLE GENOME, TRANSPORTER, ENZYME, CLINICALLY ACTIONABLE | | ISTAROXIME | ISTAROXIME | |
| 476 | ATP1A1 | ION CHANNEL, DRUGGABLE GENOME, TRANSPORTER, ENZYME, CLINICALLY ACTIONABLE | | Chloroprocaine | CHLOROPROCAINE | |
| 476 | ATP1A1 | ION CHANNEL, DRUGGABLE GENOME, TRANSPORTER, ENZYME, CLINICALLY ACTIONABLE | | ACETYLDIGITOXIN | ACETYLDIGITOXIN | |
| 476 | ATP1A1 | ION CHANNEL, DRUGGABLE GENOME, TRANSPORTER, ENZYME, CLINICALLY ACTIONABLE | | ALMITRINE | ALMITRINE | |
| 476 | ATP1A1 | ION CHANNEL, DRUGGABLE GENOME, TRANSPORTER, ENZYME, CLINICALLY ACTIONABLE | | Deslanoside | DESLANOSIDE | |
| 476 | ATP1A1 | ION CHANNEL, DRUGGABLE GENOME, TRANSPORTER, ENZYME, CLINICALLY ACTIONABLE | | DIGOXIN | DIGOXIN | |
| 476 | ATP1A1 | ION CHANNEL, DRUGGABLE GENOME, TRANSPORTER, ENZYME, CLINICALLY ACTIONABLE | | DESLANOSIDE | DESLANOSIDE | |
| 476 | ATP1A1 | ION CHANNEL, DRUGGABLE GENOME, TRANSPORTER, ENZYME, CLINICALLY ACTIONABLE | | DESLANOSIDE | DESLANOSIDE | |
| 476 | ATP1A1 | ION CHANNEL, DRUGGABLE GENOME, TRANSPORTER, ENZYME, CLINICALLY ACTIONABLE | | BEPRIDIL | BEPRIDIL | |
| 476 | ATP1A1 | ION CHANNEL, DRUGGABLE GENOME, TRANSPORTER, ENZYME, CLINICALLY ACTIONABLE | | DIGITOXIN | DIGITOXIN | |


