
|
|||||
|
 | |
| |
| |
| |
| |
| |
|
Gene: TECR |
Gene summary for TECR |
| Gene information | Species | Human | Gene symbol | TECR | Gene ID | 9524 |
| Gene name | trans-2,3-enoyl-CoA reductase | |
| Gene Alias | GPSN2 | |
| Cytomap | 19p13.12 | |
| Gene Type | protein-coding | GO ID | GO:0000038 | UniProtAcc | B3KSQ1 |
Top |
Malignant transformation analysis |
| Identification of the aberrant gene expression in precancerous and cancerous lesions by comparing the gene expression of stem-like cells in diseased tissues with normal stem cells |
| Entrez ID | Symbol | Replicates | Species | Organ | Tissue | Adj P-value | Log2FC | Malignancy |
| 9524 | TECR | GSM4909282 | Human | Breast | IDC | 3.48e-22 | 5.52e-01 | -0.0288 |
| 9524 | TECR | GSM4909285 | Human | Breast | IDC | 2.76e-31 | 6.72e-01 | 0.21 |
| 9524 | TECR | GSM4909287 | Human | Breast | IDC | 5.62e-19 | 5.48e-01 | 0.2057 |
| 9524 | TECR | GSM4909294 | Human | Breast | IDC | 6.60e-05 | -2.32e-01 | 0.2022 |
| 9524 | TECR | GSM4909296 | Human | Breast | IDC | 2.27e-09 | 8.78e-02 | 0.1524 |
| 9524 | TECR | GSM4909297 | Human | Breast | IDC | 3.83e-21 | -6.84e-02 | 0.1517 |
| 9524 | TECR | GSM4909304 | Human | Breast | IDC | 1.58e-03 | 3.19e-01 | 0.1636 |
| 9524 | TECR | GSM4909306 | Human | Breast | IDC | 1.12e-07 | 3.86e-01 | 0.1564 |
| 9524 | TECR | GSM4909311 | Human | Breast | IDC | 1.30e-33 | -3.25e-01 | 0.1534 |
| 9524 | TECR | GSM4909312 | Human | Breast | IDC | 3.31e-10 | -5.70e-02 | 0.1552 |
| 9524 | TECR | GSM4909315 | Human | Breast | IDC | 4.74e-03 | -1.95e-01 | 0.21 |
| 9524 | TECR | GSM4909317 | Human | Breast | IDC | 5.65e-05 | 3.69e-01 | 0.1355 |
| 9524 | TECR | GSM4909319 | Human | Breast | IDC | 3.95e-45 | -1.40e-01 | 0.1563 |
| 9524 | TECR | GSM4909320 | Human | Breast | IDC | 3.85e-02 | -1.92e-01 | 0.1575 |
| 9524 | TECR | GSM4909321 | Human | Breast | IDC | 1.41e-17 | 1.47e-01 | 0.1559 |
| 9524 | TECR | NCCBC14 | Human | Breast | DCIS | 6.09e-13 | -3.00e-01 | 0.2021 |
| 9524 | TECR | NCCBC3 | Human | Breast | DCIS | 7.44e-03 | -1.99e-02 | 0.1198 |
| 9524 | TECR | NCCBC5 | Human | Breast | DCIS | 1.66e-15 | -2.78e-01 | 0.2046 |
| 9524 | TECR | P1 | Human | Breast | IDC | 2.39e-20 | -1.67e-01 | 0.1527 |
| 9524 | TECR | P2 | Human | Breast | IDC | 8.05e-03 | -9.59e-02 | 0.21 |
| Page: 1 2 3 4 5 6 7 8 9 10 11 |
| Tissue | Expression Dynamics | Abbreviation |
| Breast | 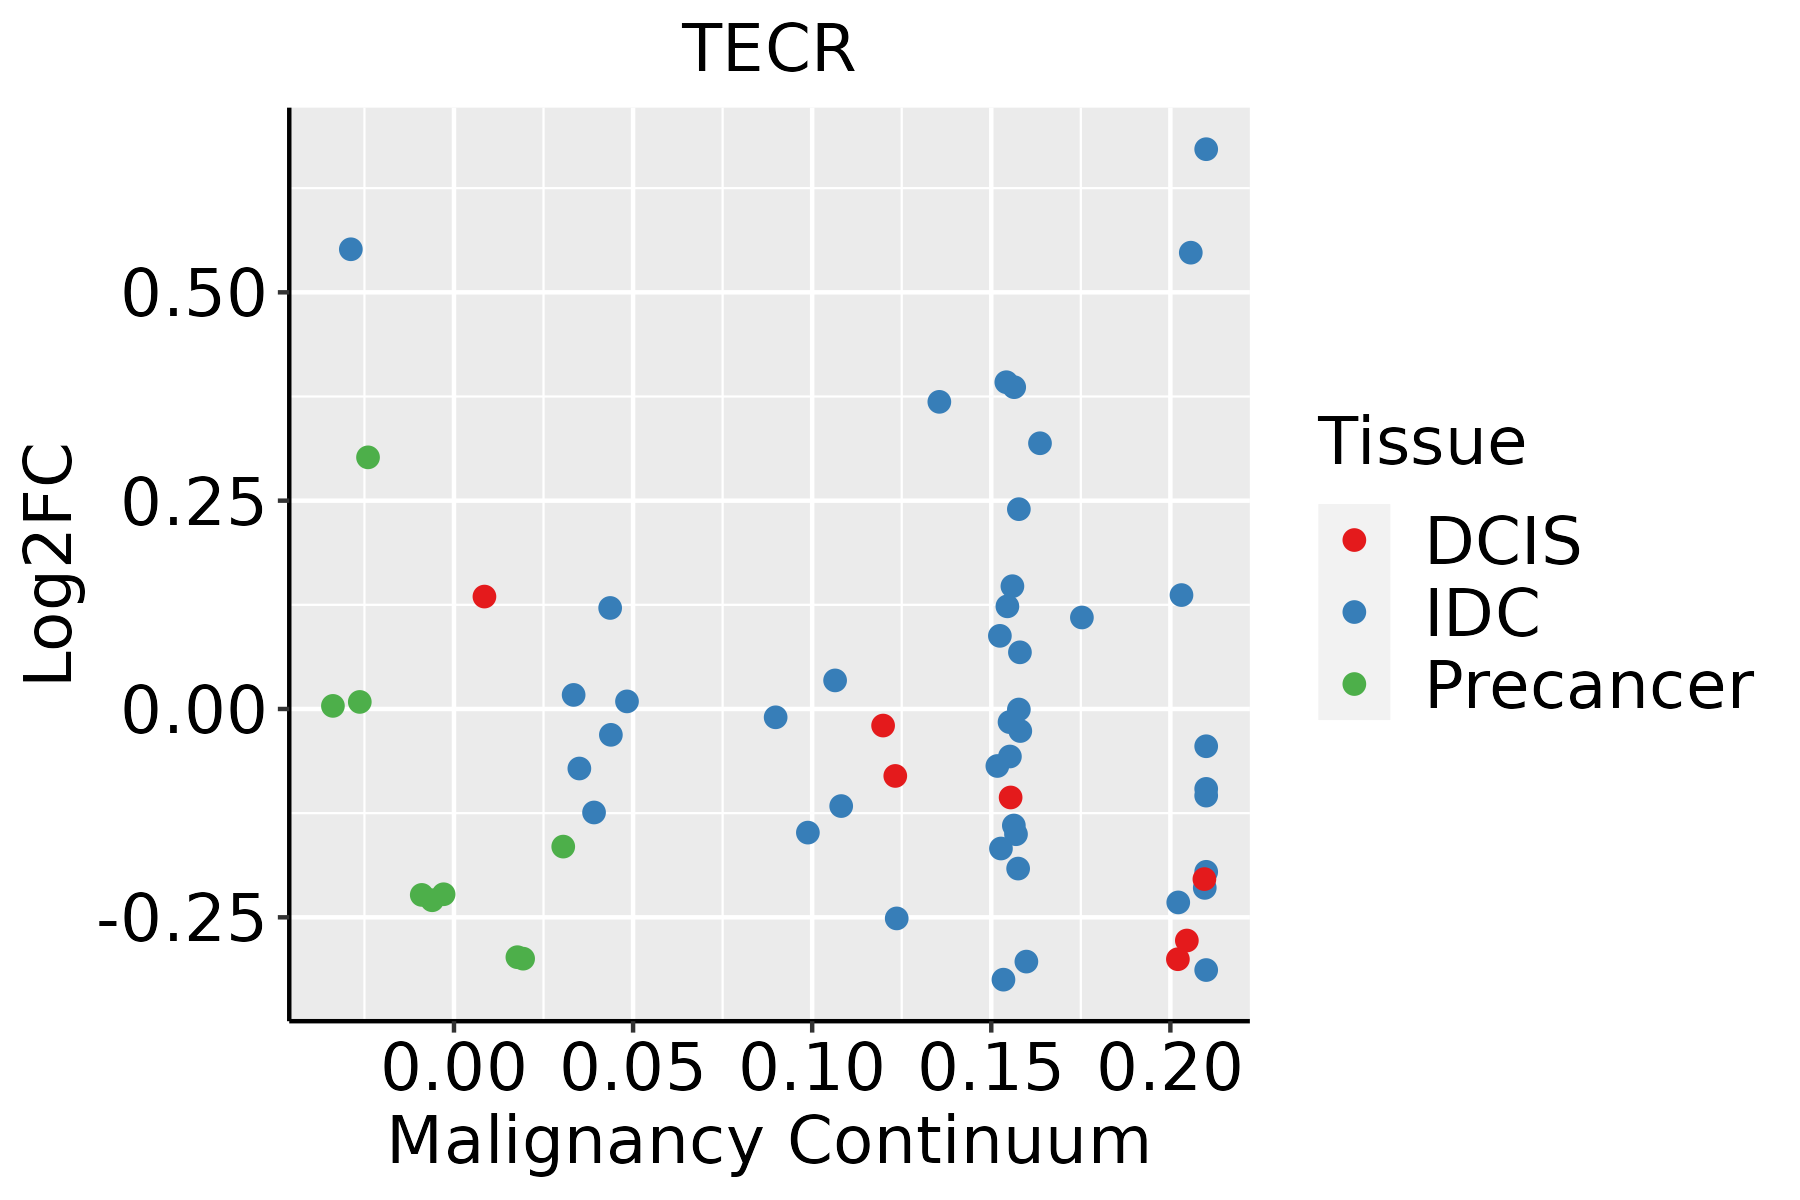 | IDC: Invasive ductal carcinoma |
| DCIS: Ductal carcinoma in situ | ||
| Precancer(BRCA1-mut): Precancerous lesion from BRCA1 mutation carriers | ||
| Colorectum (GSE201348) |  | FAP: Familial adenomatous polyposis |
| CRC: Colorectal cancer | ||
| Colorectum (HTA11) |  | AD: Adenomas |
| SER: Sessile serrated lesions | ||
| MSI-H: Microsatellite-high colorectal cancer | ||
| MSS: Microsatellite stable colorectal cancer | ||
| Esophagus | 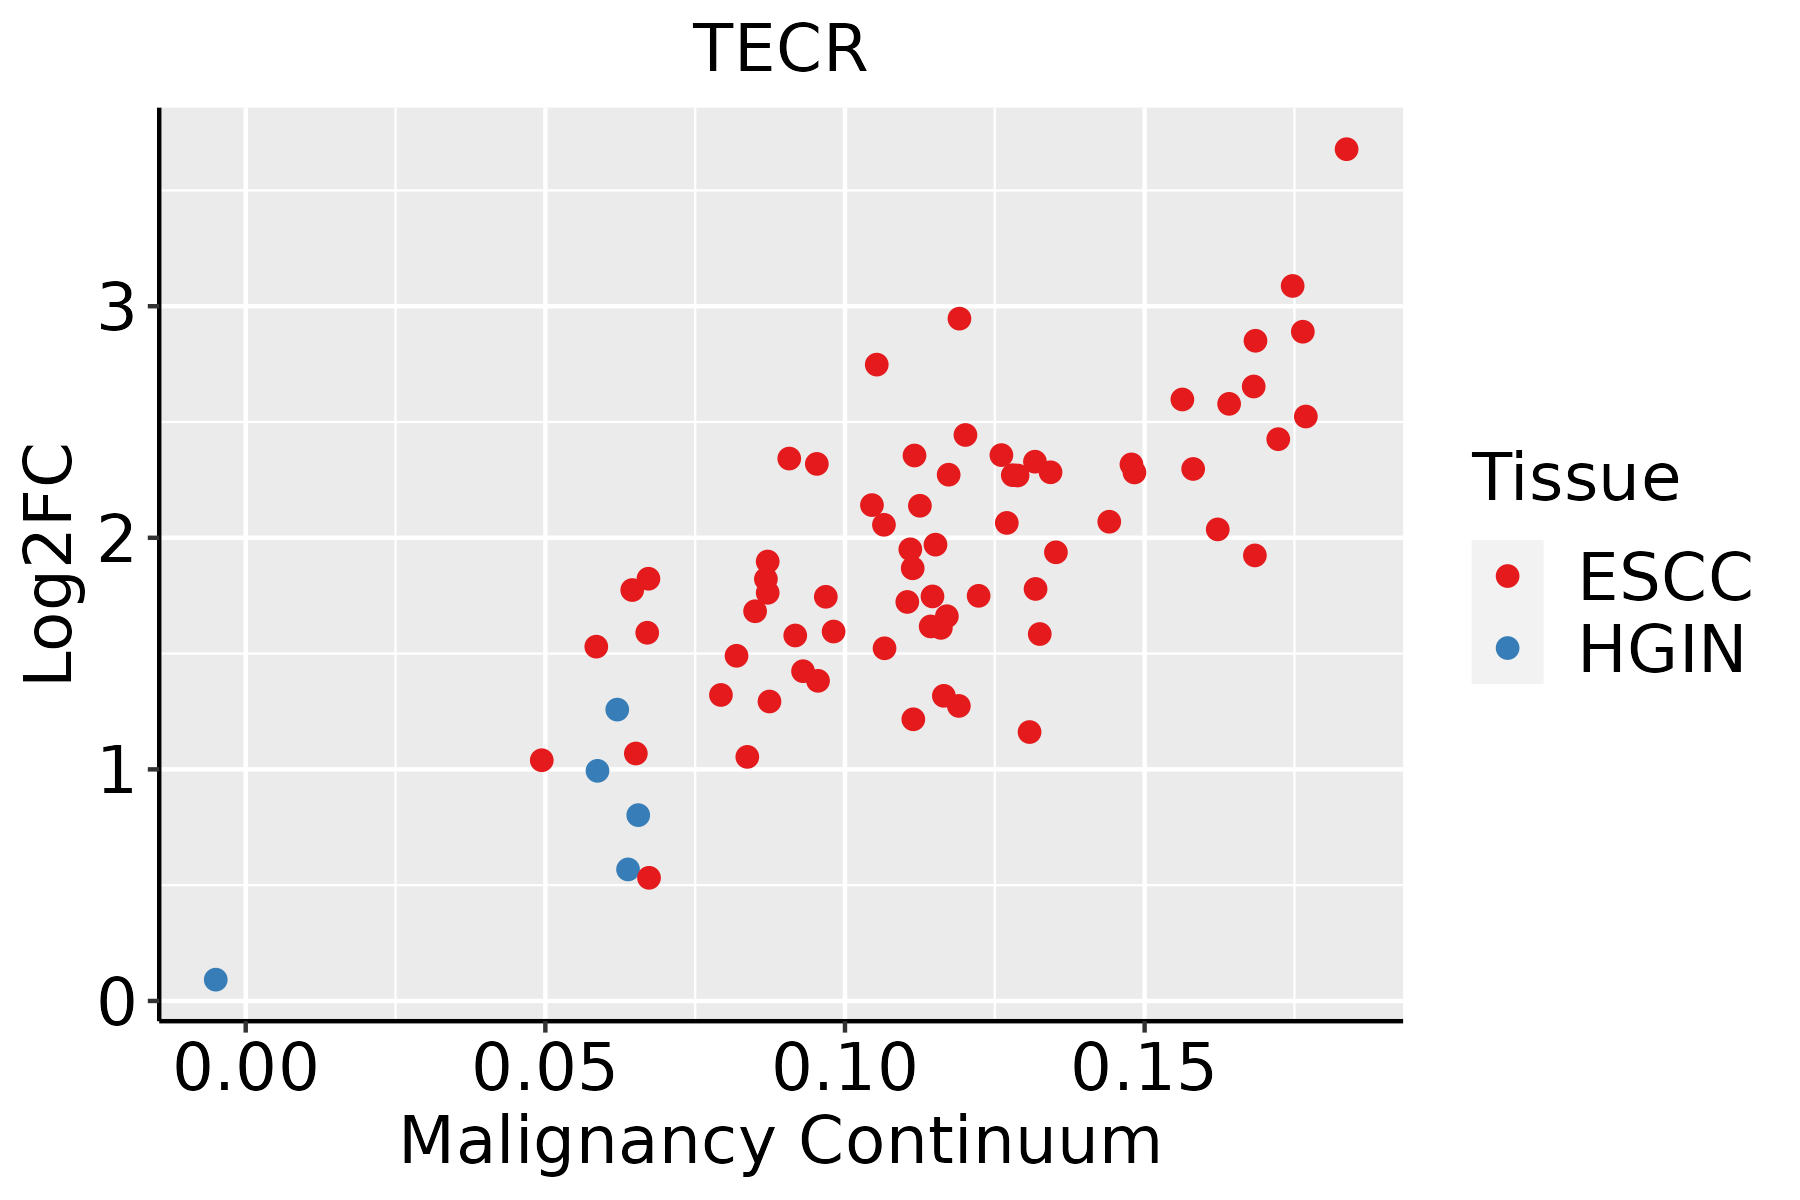 | ESCC: Esophageal squamous cell carcinoma |
| HGIN: High-grade intraepithelial neoplasias | ||
| LGIN: Low-grade intraepithelial neoplasias | ||
| GC | 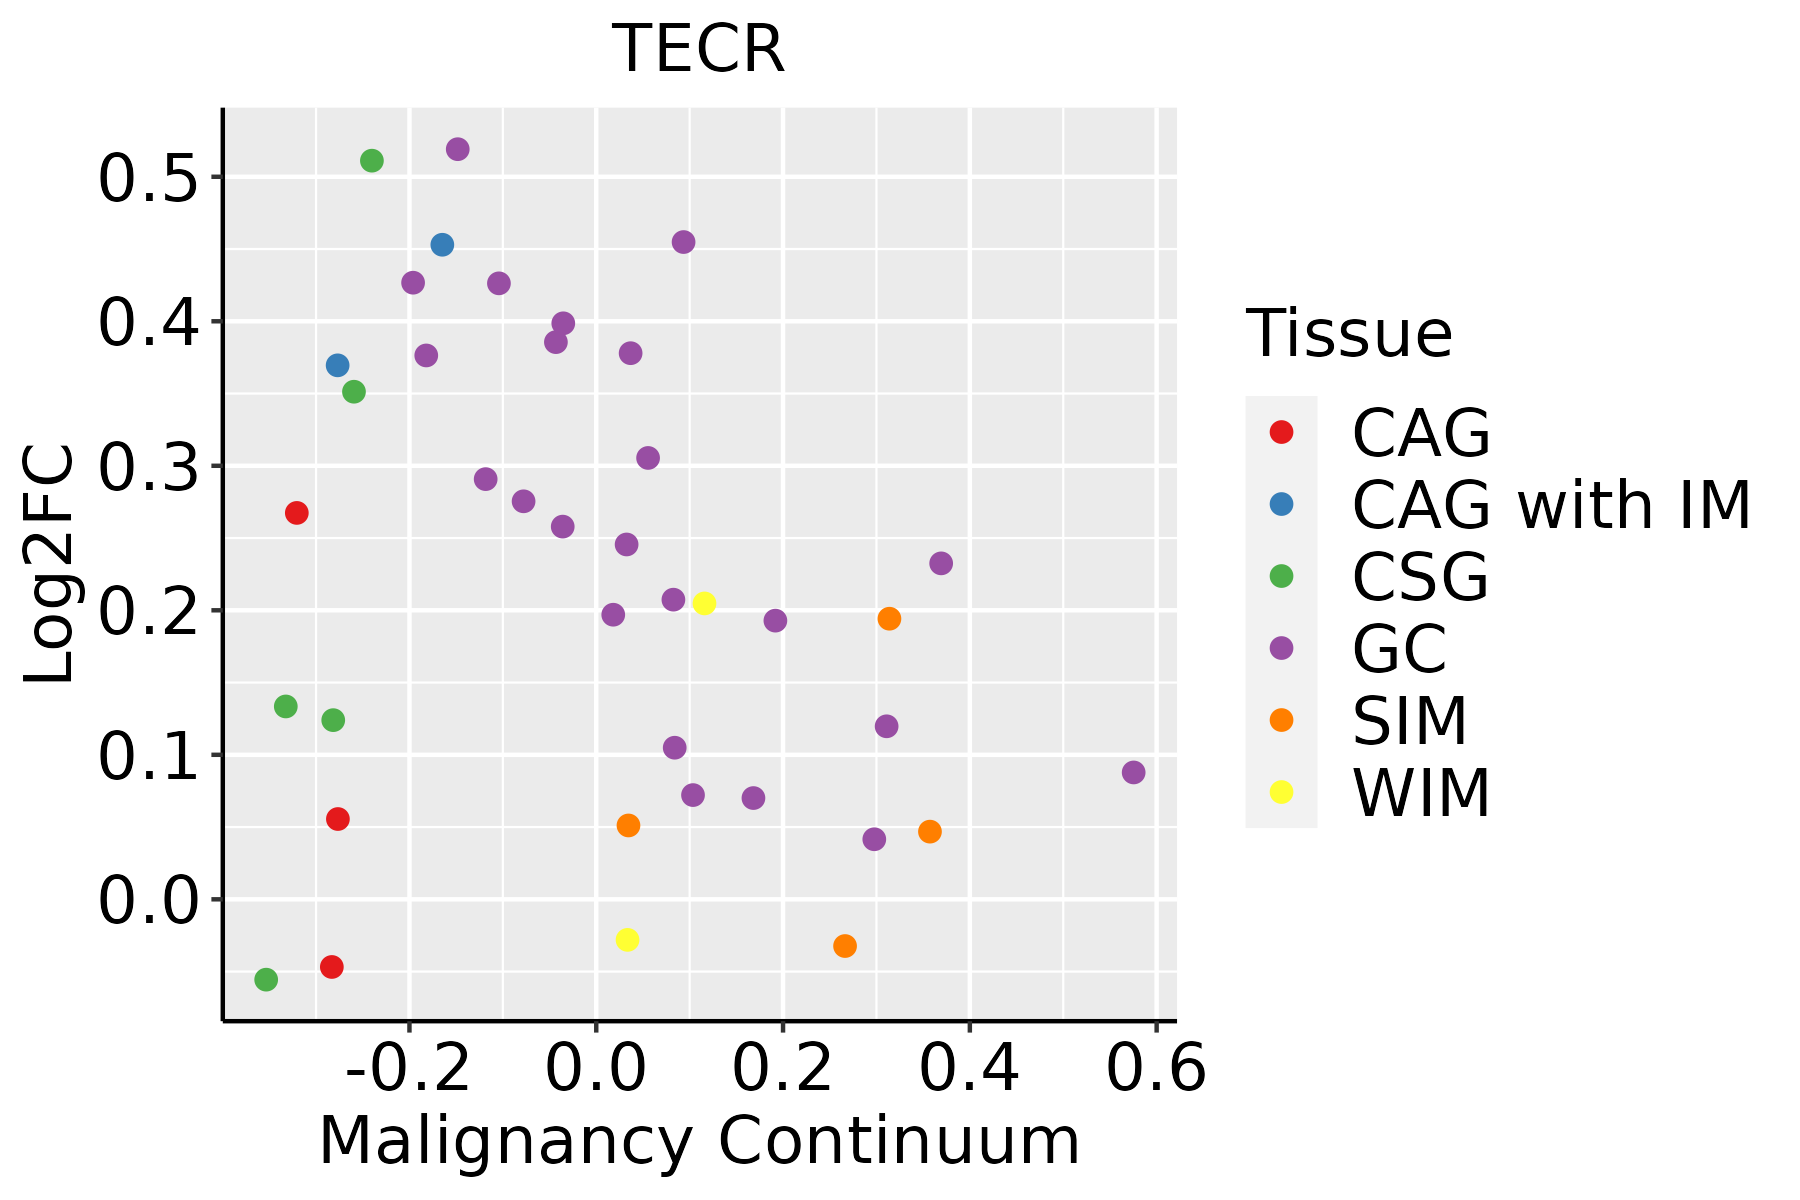 | CAG: Chronic atrophic gastritis |
| CAG with IM: Chronic atrophic gastritis with intestinal metaplasia | ||
| CSG: Chronic superficial gastritis | ||
| GC: Gastric cancer | ||
| SIM: Severe intestinal metaplasia | ||
| WIM: Wild intestinal metaplasia | ||
| Liver | 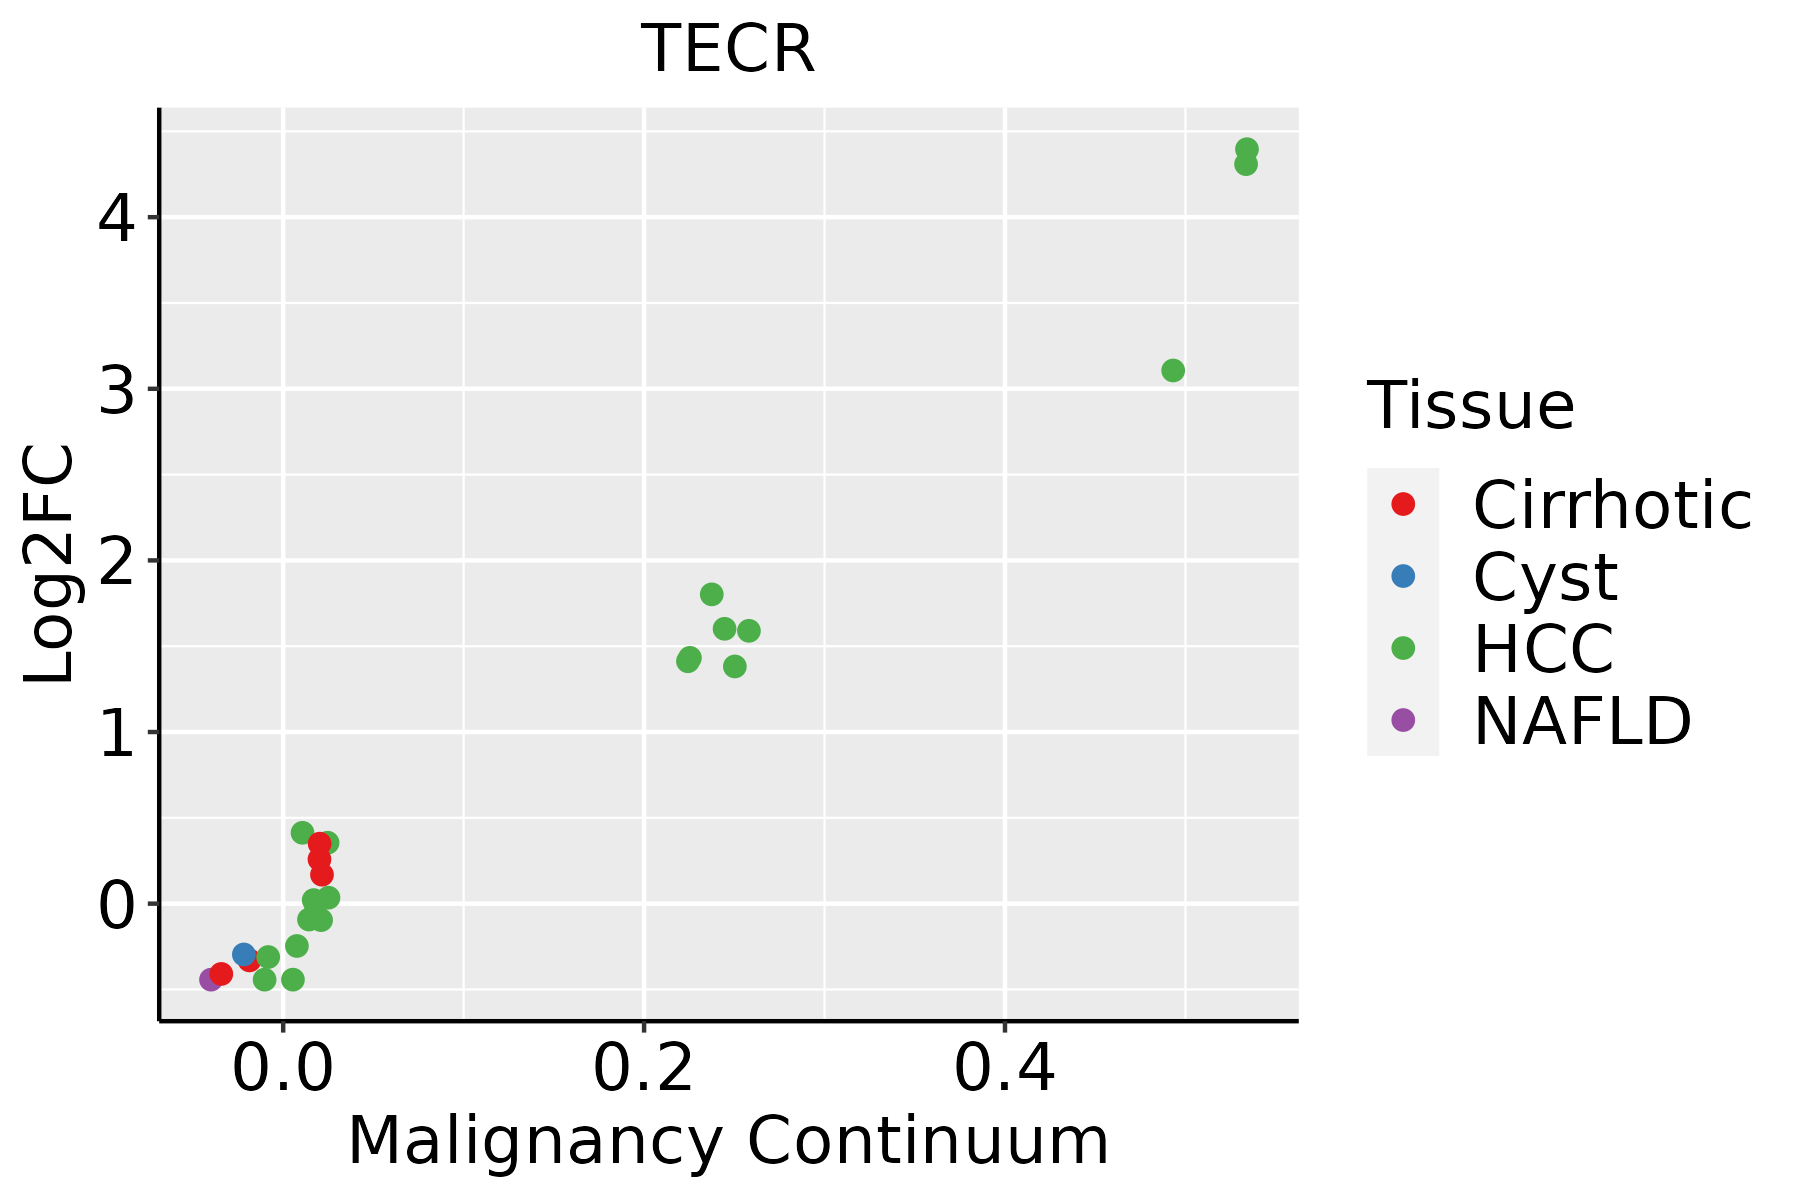 | HCC: Hepatocellular carcinoma |
| NAFLD: Non-alcoholic fatty liver disease | ||
| Oral Cavity | 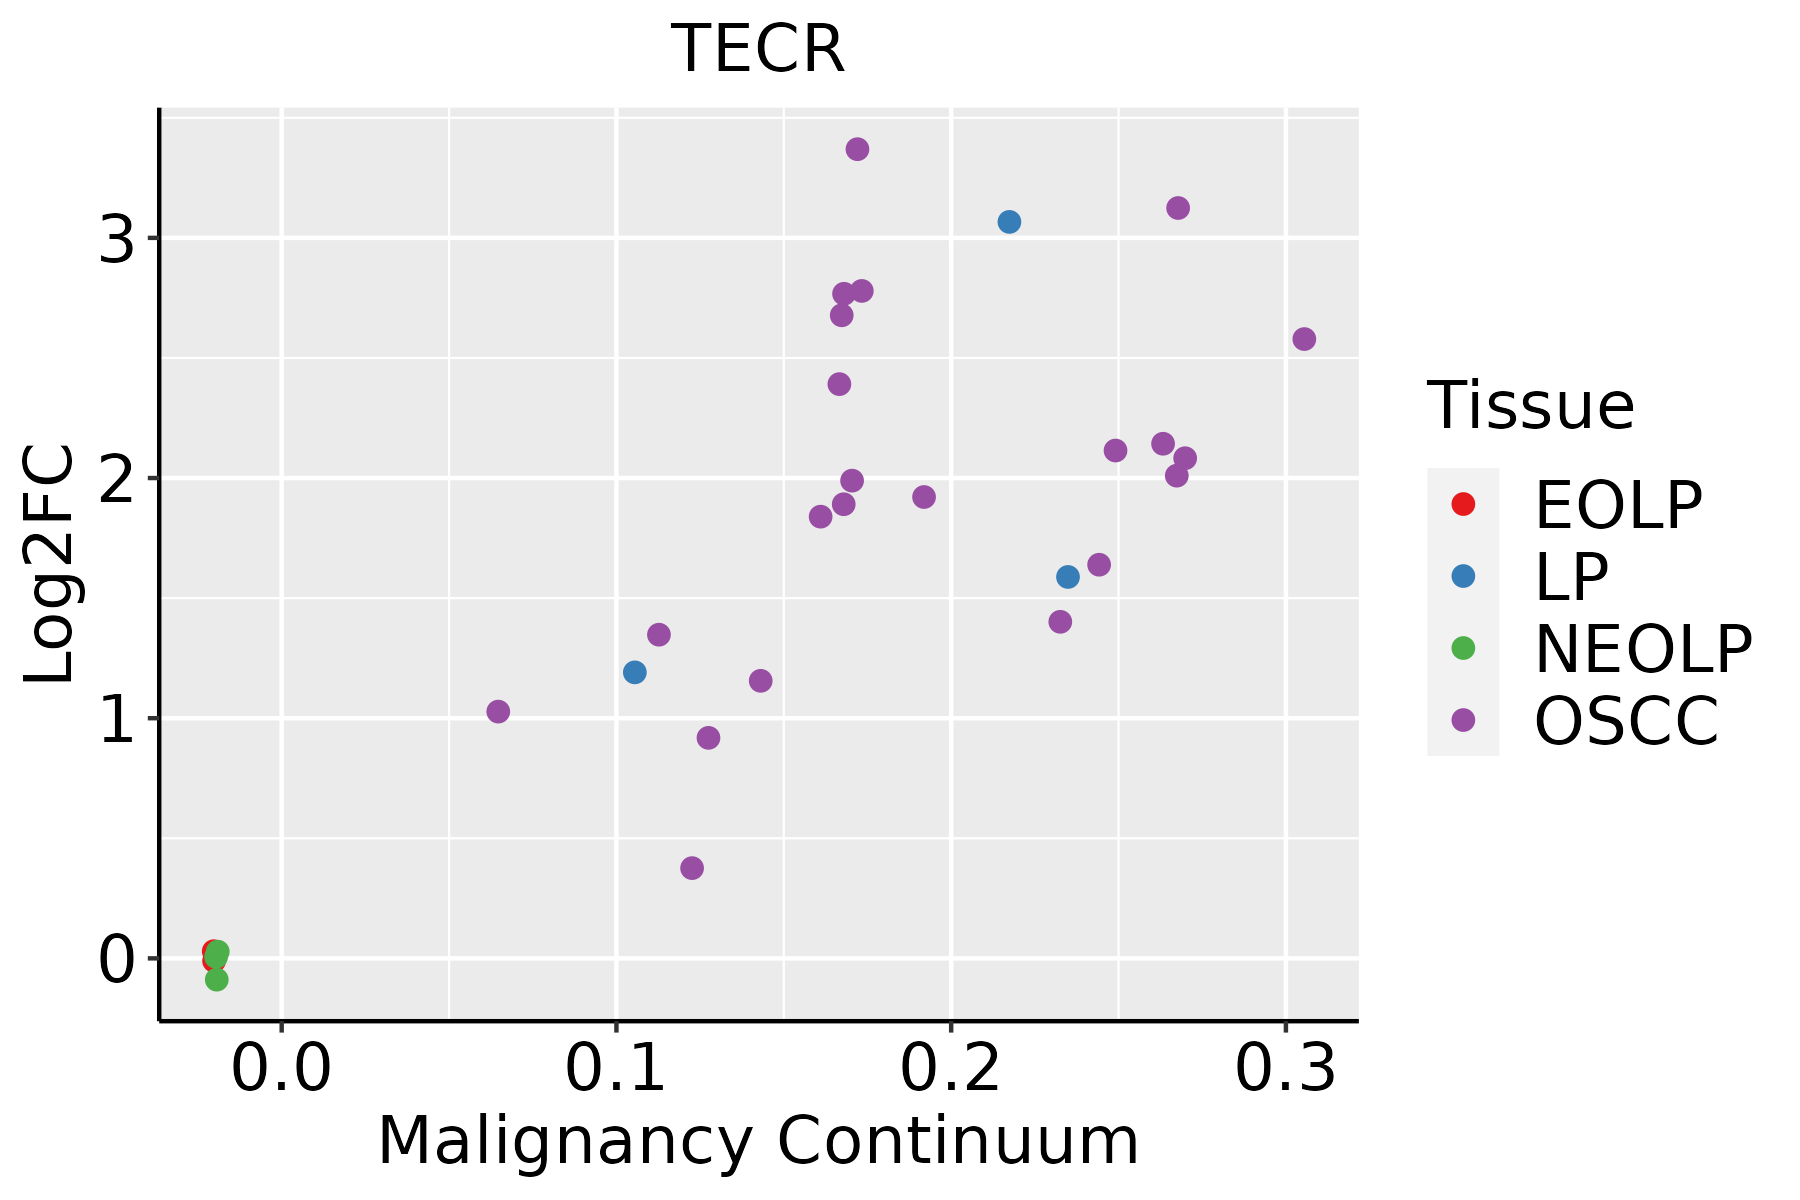 | EOLP: Erosive Oral lichen planus |
| LP: leukoplakia | ||
| NEOLP: Non-erosive oral lichen planus | ||
| OSCC: Oral squamous cell carcinoma | ||
| Prostate | 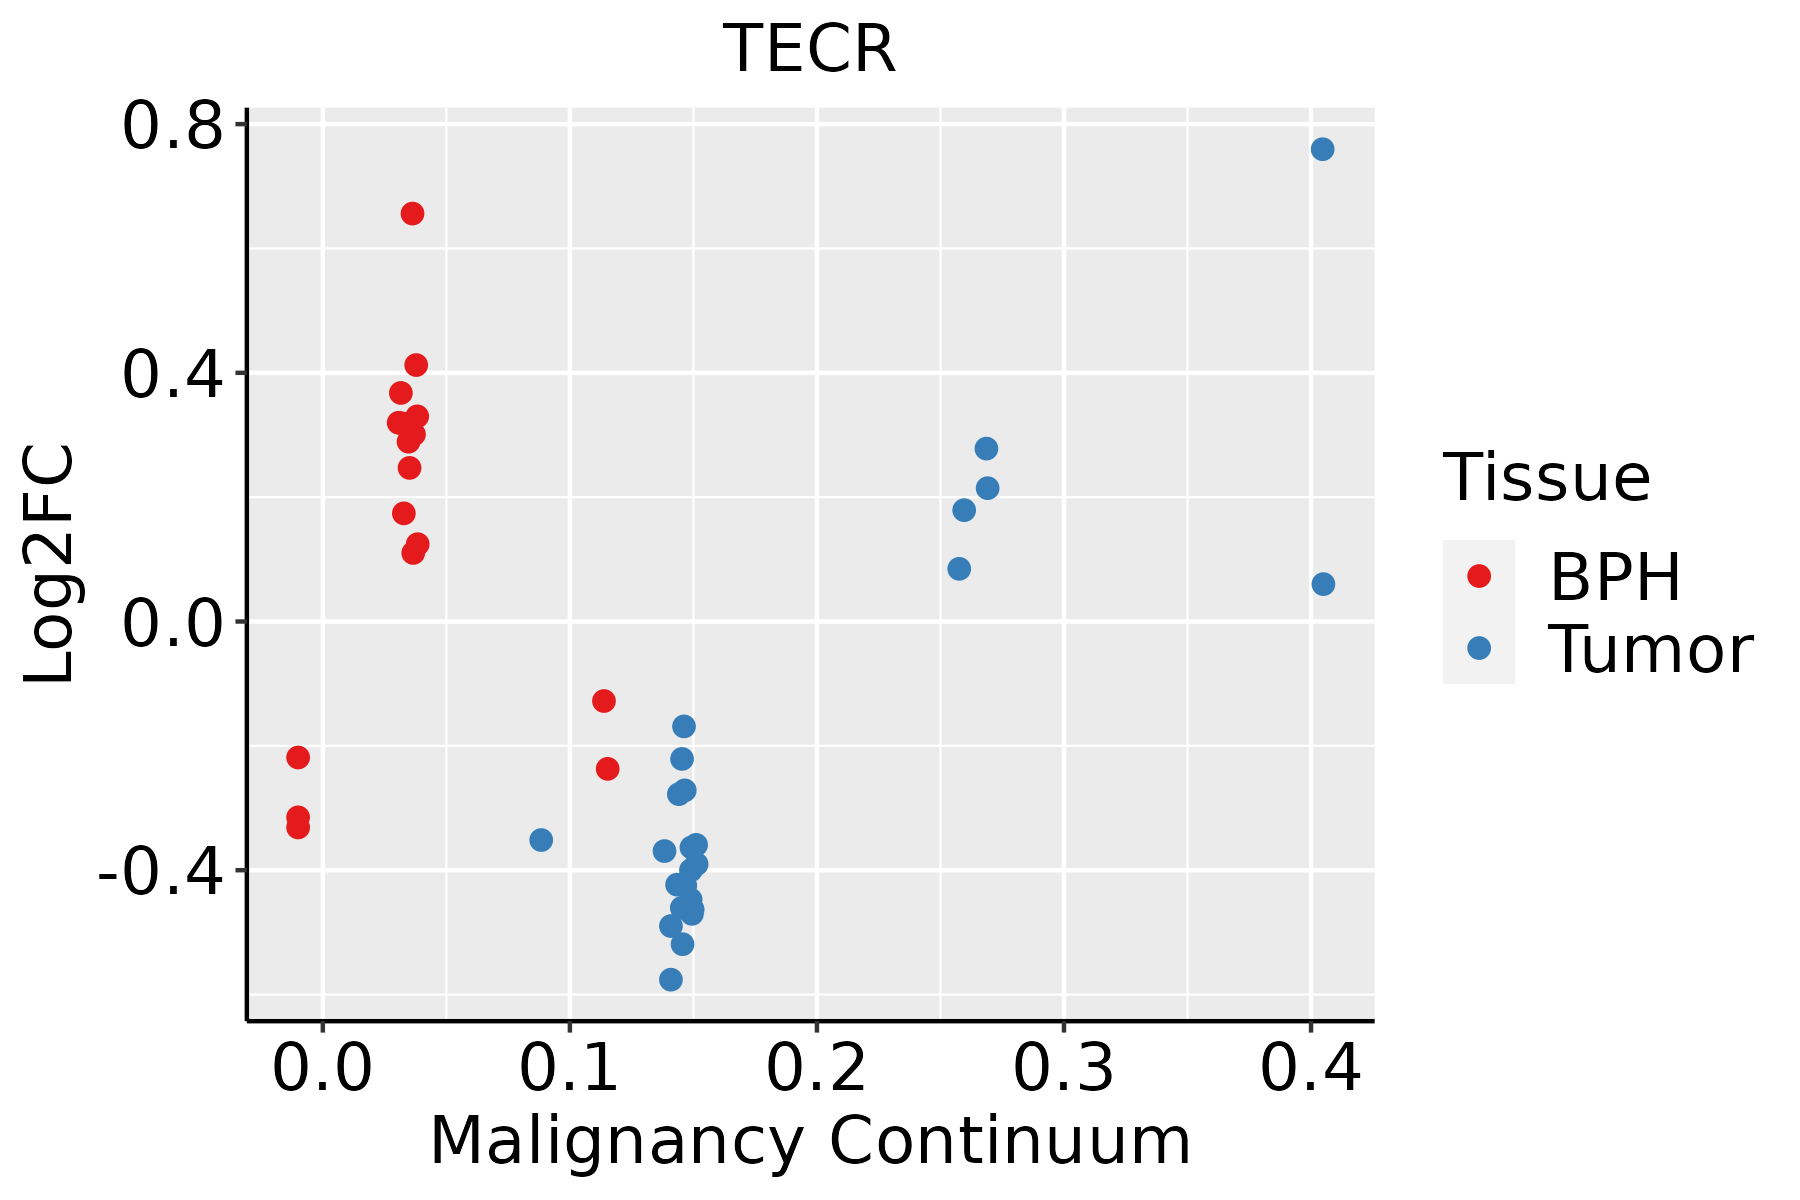 | BPH: Benign Prostatic Hyperplasia |
| Skin | 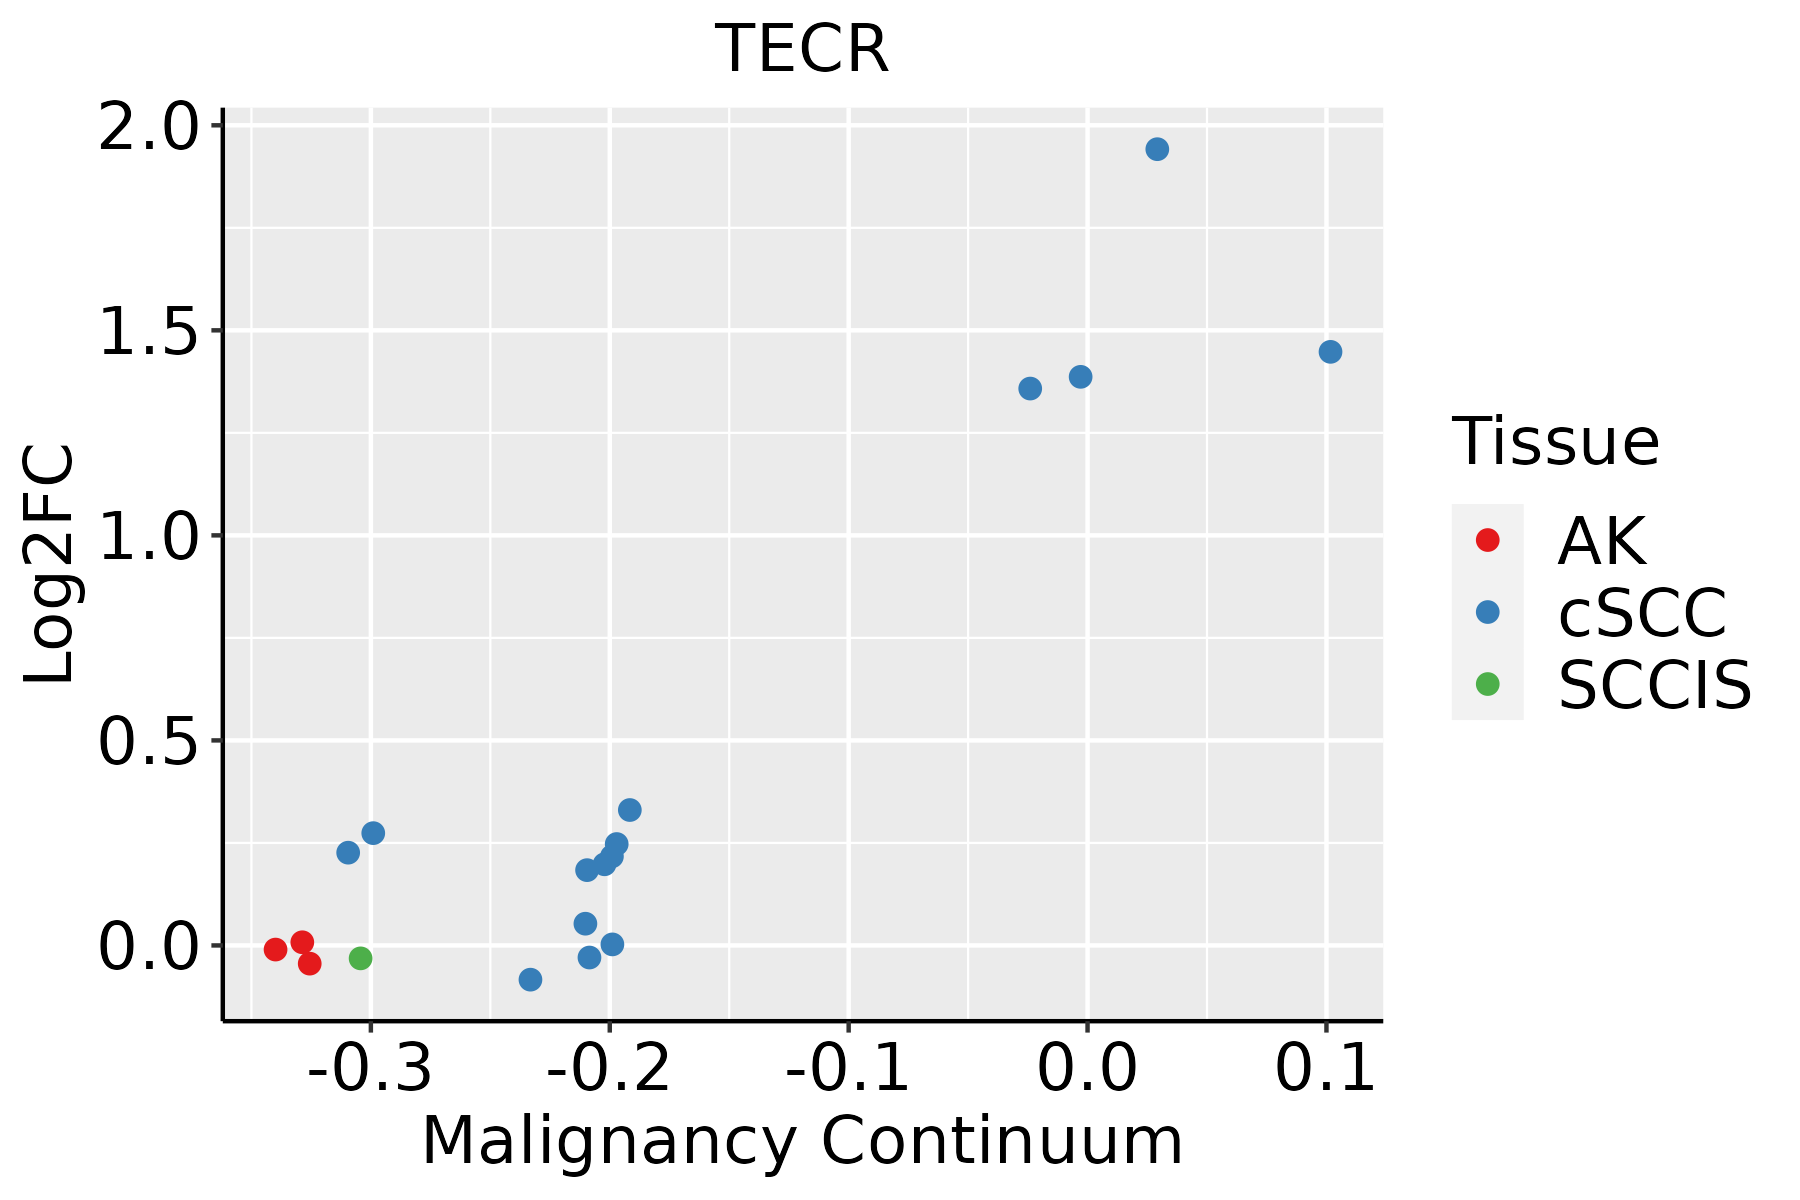 | AK: Actinic keratosis |
| cSCC: Cutaneous squamous cell carcinoma | ||
| SCCIS:squamous cell carcinoma in situ | ||
| Thyroid |  | ATC: Anaplastic thyroid cancer |
| HT: Hashimoto's thyroiditis | ||
| PTC: Papillary thyroid cancer |
| ∗log2FC in expression of this searched gene in stem-like cells from each diseased tissue sample relative to stem-like cells in normal samples in each tissue plotted against the malignancy continuum. Samples are colored based on if they are from different disease stage. |
Top |
Malignant transformation related pathway analysis |
| Find out the enriched GO biological processes and KEGG pathways involved in transition from healthy to precancer to cancer |
| Tissue | Disease Stage | Enriched GO biological Processes |
| Colorectum | AD |  |
| Colorectum | SER |  |
| Colorectum | MSS |  |
| Colorectum | MSI-H |  |
| Colorectum | FAP |  |
| ∗Top 15 enriched GO BP terms are showed in the bar plot of each disease state in each tissue. Each row represents a significant GO biological process which is colored according to the -log10(p.adjust). |
| Page: 1 2 3 4 5 6 7 8 9 |
| GO ID | Tissue | Disease Stage | Description | Gene Ratio | Bg Ratio | pvalue | p.adjust | Count |
| GO:00160532 | Stomach | CSG | organic acid biosynthetic process | 30/1034 | 316/18723 | 2.77e-03 | 2.63e-02 | 30 |
| GO:001969327 | Thyroid | PTC | ribose phosphate metabolic process | 176/5968 | 396/18723 | 8.28e-08 | 1.70e-06 | 176 |
| GO:000915028 | Thyroid | PTC | purine ribonucleotide metabolic process | 165/5968 | 368/18723 | 1.03e-07 | 2.05e-06 | 165 |
| GO:007252127 | Thyroid | PTC | purine-containing compound metabolic process | 182/5968 | 416/18723 | 1.92e-07 | 3.51e-06 | 182 |
| GO:000925927 | Thyroid | PTC | ribonucleotide metabolic process | 170/5968 | 385/18723 | 2.32e-07 | 4.08e-06 | 170 |
| GO:000616327 | Thyroid | PTC | purine nucleotide metabolic process | 170/5968 | 396/18723 | 2.02e-06 | 2.75e-05 | 170 |
| GO:000675325 | Thyroid | PTC | nucleoside phosphate metabolic process | 205/5968 | 497/18723 | 5.24e-06 | 6.35e-05 | 205 |
| GO:000911725 | Thyroid | PTC | nucleotide metabolic process | 202/5968 | 489/18723 | 5.46e-06 | 6.60e-05 | 202 |
| GO:000915224 | Thyroid | PTC | purine ribonucleotide biosynthetic process | 78/5968 | 169/18723 | 6.88e-05 | 6.01e-04 | 78 |
| GO:004639024 | Thyroid | PTC | ribose phosphate biosynthetic process | 85/5968 | 190/18723 | 1.30e-04 | 1.03e-03 | 85 |
| GO:000926024 | Thyroid | PTC | ribonucleotide biosynthetic process | 81/5968 | 182/18723 | 2.27e-04 | 1.65e-03 | 81 |
| GO:007252219 | Thyroid | PTC | purine-containing compound biosynthetic process | 86/5968 | 200/18723 | 5.85e-04 | 3.72e-03 | 86 |
| GO:000616419 | Thyroid | PTC | purine nucleotide biosynthetic process | 81/5968 | 191/18723 | 1.35e-03 | 7.65e-03 | 81 |
| GO:00442726 | Thyroid | PTC | sulfur compound biosynthetic process | 63/5968 | 148/18723 | 3.91e-03 | 1.87e-02 | 63 |
| GO:001969328 | Thyroid | ATC | ribose phosphate metabolic process | 184/6293 | 396/18723 | 5.87e-08 | 1.05e-06 | 184 |
| GO:000915029 | Thyroid | ATC | purine ribonucleotide metabolic process | 172/6293 | 368/18723 | 9.58e-08 | 1.64e-06 | 172 |
| GO:000925928 | Thyroid | ATC | ribonucleotide metabolic process | 178/6293 | 385/18723 | 1.47e-07 | 2.39e-06 | 178 |
| GO:007252128 | Thyroid | ATC | purine-containing compound metabolic process | 189/6293 | 416/18723 | 2.83e-07 | 4.29e-06 | 189 |
| GO:0006753111 | Thyroid | ATC | nucleoside phosphate metabolic process | 219/6293 | 497/18723 | 5.92e-07 | 8.29e-06 | 219 |
| GO:0009117112 | Thyroid | ATC | nucleotide metabolic process | 215/6293 | 489/18723 | 9.09e-07 | 1.20e-05 | 215 |
| Page: 1 2 3 4 5 6 7 8 9 10 11 12 13 14 15 16 17 18 19 20 21 |
| Pathway ID | Tissue | Disease Stage | Description | Gene Ratio | Bg Ratio | pvalue | p.adjust | qvalue | Count |
| hsa00062 | Colorectum | SER | Fatty acid elongation | 11/1580 | 27/8465 | 6.38e-03 | 3.68e-02 | 2.67e-02 | 11 |
| hsa000621 | Colorectum | SER | Fatty acid elongation | 11/1580 | 27/8465 | 6.38e-03 | 3.68e-02 | 2.67e-02 | 11 |
| hsa012129 | Esophagus | ESCC | Fatty acid metabolism | 41/4205 | 57/8465 | 5.13e-04 | 1.75e-03 | 8.98e-04 | 41 |
| hsa0121214 | Esophagus | ESCC | Fatty acid metabolism | 41/4205 | 57/8465 | 5.13e-04 | 1.75e-03 | 8.98e-04 | 41 |
| hsa012122 | Liver | Cirrhotic | Fatty acid metabolism | 32/2530 | 57/8465 | 3.12e-05 | 2.47e-04 | 1.52e-04 | 32 |
| hsa01040 | Liver | Cirrhotic | Biosynthesis of unsaturated fatty acids | 14/2530 | 27/8465 | 1.36e-02 | 4.25e-02 | 2.62e-02 | 14 |
| hsa012123 | Liver | Cirrhotic | Fatty acid metabolism | 32/2530 | 57/8465 | 3.12e-05 | 2.47e-04 | 1.52e-04 | 32 |
| hsa010401 | Liver | Cirrhotic | Biosynthesis of unsaturated fatty acids | 14/2530 | 27/8465 | 1.36e-02 | 4.25e-02 | 2.62e-02 | 14 |
| hsa012124 | Liver | HCC | Fatty acid metabolism | 45/4020 | 57/8465 | 1.05e-06 | 1.10e-05 | 6.09e-06 | 45 |
| hsa000622 | Liver | HCC | Fatty acid elongation | 20/4020 | 27/8465 | 4.58e-03 | 1.36e-02 | 7.55e-03 | 20 |
| hsa010402 | Liver | HCC | Biosynthesis of unsaturated fatty acids | 19/4020 | 27/8465 | 1.37e-02 | 3.33e-02 | 1.85e-02 | 19 |
| hsa012125 | Liver | HCC | Fatty acid metabolism | 45/4020 | 57/8465 | 1.05e-06 | 1.10e-05 | 6.09e-06 | 45 |
| hsa0006211 | Liver | HCC | Fatty acid elongation | 20/4020 | 27/8465 | 4.58e-03 | 1.36e-02 | 7.55e-03 | 20 |
| hsa010403 | Liver | HCC | Biosynthesis of unsaturated fatty acids | 19/4020 | 27/8465 | 1.37e-02 | 3.33e-02 | 1.85e-02 | 19 |
| hsa012128 | Oral cavity | OSCC | Fatty acid metabolism | 35/3704 | 57/8465 | 5.37e-03 | 1.29e-02 | 6.55e-03 | 35 |
| hsa0121213 | Oral cavity | OSCC | Fatty acid metabolism | 35/3704 | 57/8465 | 5.37e-03 | 1.29e-02 | 6.55e-03 | 35 |
| hsa012127 | Prostate | BPH | Fatty acid metabolism | 19/1718 | 57/8465 | 1.44e-02 | 4.17e-02 | 2.58e-02 | 19 |
| hsa0121212 | Prostate | BPH | Fatty acid metabolism | 19/1718 | 57/8465 | 1.44e-02 | 4.17e-02 | 2.58e-02 | 19 |
| hsa0121221 | Prostate | Tumor | Fatty acid metabolism | 23/1791 | 57/8465 | 7.60e-04 | 3.59e-03 | 2.23e-03 | 23 |
| hsa010404 | Prostate | Tumor | Biosynthesis of unsaturated fatty acids | 12/1791 | 27/8465 | 5.53e-03 | 1.93e-02 | 1.19e-02 | 12 |
| Page: 1 2 |
Top |
Cell-cell communication analysis |
| Identification of potential cell-cell interactions between two cell types and their ligand-receptor pairs for different disease states |
| Ligand | Receptor | LRpair | Pathway | Tissue | Disease Stage |
| Page: 1 |
Top |
Single-cell gene regulatory network inference analysis |
| Find out the significant the regulons (TFs) and the target genes of each regulon across cell types for different disease states |
| TF | Cell Type | Tissue | Disease Stage | Target Gene | RSS | Regulon Activity |
| ∗The dot plots of a searched regulon are shown for all cell subpopulations in each disease state of each tissue based on the regulon specific score inferred using pySCENIC and by calculating the average expression. |
| Page: 1 |
Top |
Somatic mutation of malignant transformation related genes |
| Annotation of somatic variants for genes involved in malignant transformation |
| Hugo Symbol | Variant Class | Variant Classification | dbSNP RS | HGVSc | HGVSp | HGVSp Short | SWISSPROT | BIOTYPE | SIFT | PolyPhen | Tumor Sample Barcode | Tissue | Histology | Sex | Age | Stage | Therapy Types | Drugs | Outcome |
| TECR | SNV | Missense_Mutation | rs763449006 | c.79N>A | p.Ala27Thr | p.A27T | Q9NZ01 | protein_coding | tolerated(0.54) | benign(0.015) | TCGA-B6-A1KF-01 | Breast | breast invasive carcinoma | Female | >=65 | I/II | Unknown | Unknown | SD |
| TECR | SNV | Missense_Mutation | novel | c.252N>T | p.Gln84His | p.Q84H | Q9NZ01 | protein_coding | deleterious(0) | possibly_damaging(0.907) | TCGA-2W-A8YY-01 | Cervix | cervical & endocervical cancer | Female | <65 | I/II | Chemotherapy | cisplatin | CR |
| TECR | SNV | Missense_Mutation | novel | c.292N>T | p.Pro98Ser | p.P98S | Q9NZ01 | protein_coding | deleterious(0.01) | benign(0.266) | TCGA-2W-A8YY-01 | Cervix | cervical & endocervical cancer | Female | <65 | I/II | Chemotherapy | cisplatin | CR |
| TECR | SNV | Missense_Mutation | rs765698953 | c.514N>A | p.Ala172Thr | p.A172T | Q9NZ01 | protein_coding | tolerated(0.26) | benign(0.141) | TCGA-2W-A8YY-01 | Cervix | cervical & endocervical cancer | Female | <65 | I/II | Chemotherapy | cisplatin | CR |
| TECR | SNV | Missense_Mutation | c.118N>A | p.His40Asn | p.H40N | Q9NZ01 | protein_coding | tolerated(0.31) | benign(0) | TCGA-FU-A23K-01 | Cervix | cervical & endocervical cancer | Female | <65 | III/IV | Unknown | Unknown | SD | |
| TECR | SNV | Missense_Mutation | novel | c.812C>A | p.Ser271Tyr | p.S271Y | Q9NZ01 | protein_coding | deleterious(0) | possibly_damaging(0.567) | TCGA-Q1-A5R2-01 | Cervix | cervical & endocervical cancer | Female | <65 | I/II | Chemotherapy | cisplatin | PR |
| TECR | SNV | Missense_Mutation | rs545666123 | c.266C>T | p.Thr89Met | p.T89M | Q9NZ01 | protein_coding | tolerated(0.11) | benign(0.029) | TCGA-AA-3811-01 | Colorectum | colon adenocarcinoma | Female | >=65 | III/IV | Unknown | Unknown | PD |
| TECR | SNV | Missense_Mutation | c.422N>A | p.Arg141His | p.R141H | Q9NZ01 | protein_coding | deleterious(0.02) | benign(0.006) | TCGA-CM-6162-01 | Colorectum | colon adenocarcinoma | Female | <65 | III/IV | Chemotherapy | oxaliplatin | SD | |
| TECR | SNV | Missense_Mutation | rs763449006 | c.79N>A | p.Ala27Thr | p.A27T | Q9NZ01 | protein_coding | tolerated(0.54) | benign(0.015) | TCGA-G4-6628-01 | Colorectum | colon adenocarcinoma | Male | >=65 | I/II | Unknown | Unknown | SD |
| TECR | SNV | Missense_Mutation | novel | c.899N>A | p.Arg300His | p.R300H | Q9NZ01 | protein_coding | deleterious(0.03) | benign(0.212) | TCGA-G4-6628-01 | Colorectum | colon adenocarcinoma | Male | >=65 | I/II | Unknown | Unknown | SD |
| Page: 1 2 3 4 |
Top |
Related drugs of malignant transformation related genes |
| Identification of chemicals and drugs interact with genes involved in malignant transfromation |
| (DGIdb 4.0) |
| Entrez ID | Symbol | Category | Interaction Types | Drug Claim Name | Drug Name | PMIDs |
| Page: 1 |

Copyright 2023-Present -The University of Texas Health Science Center at Houston |