| Tissue | Expression Dynamics | Abbreviation |
| Cervix | 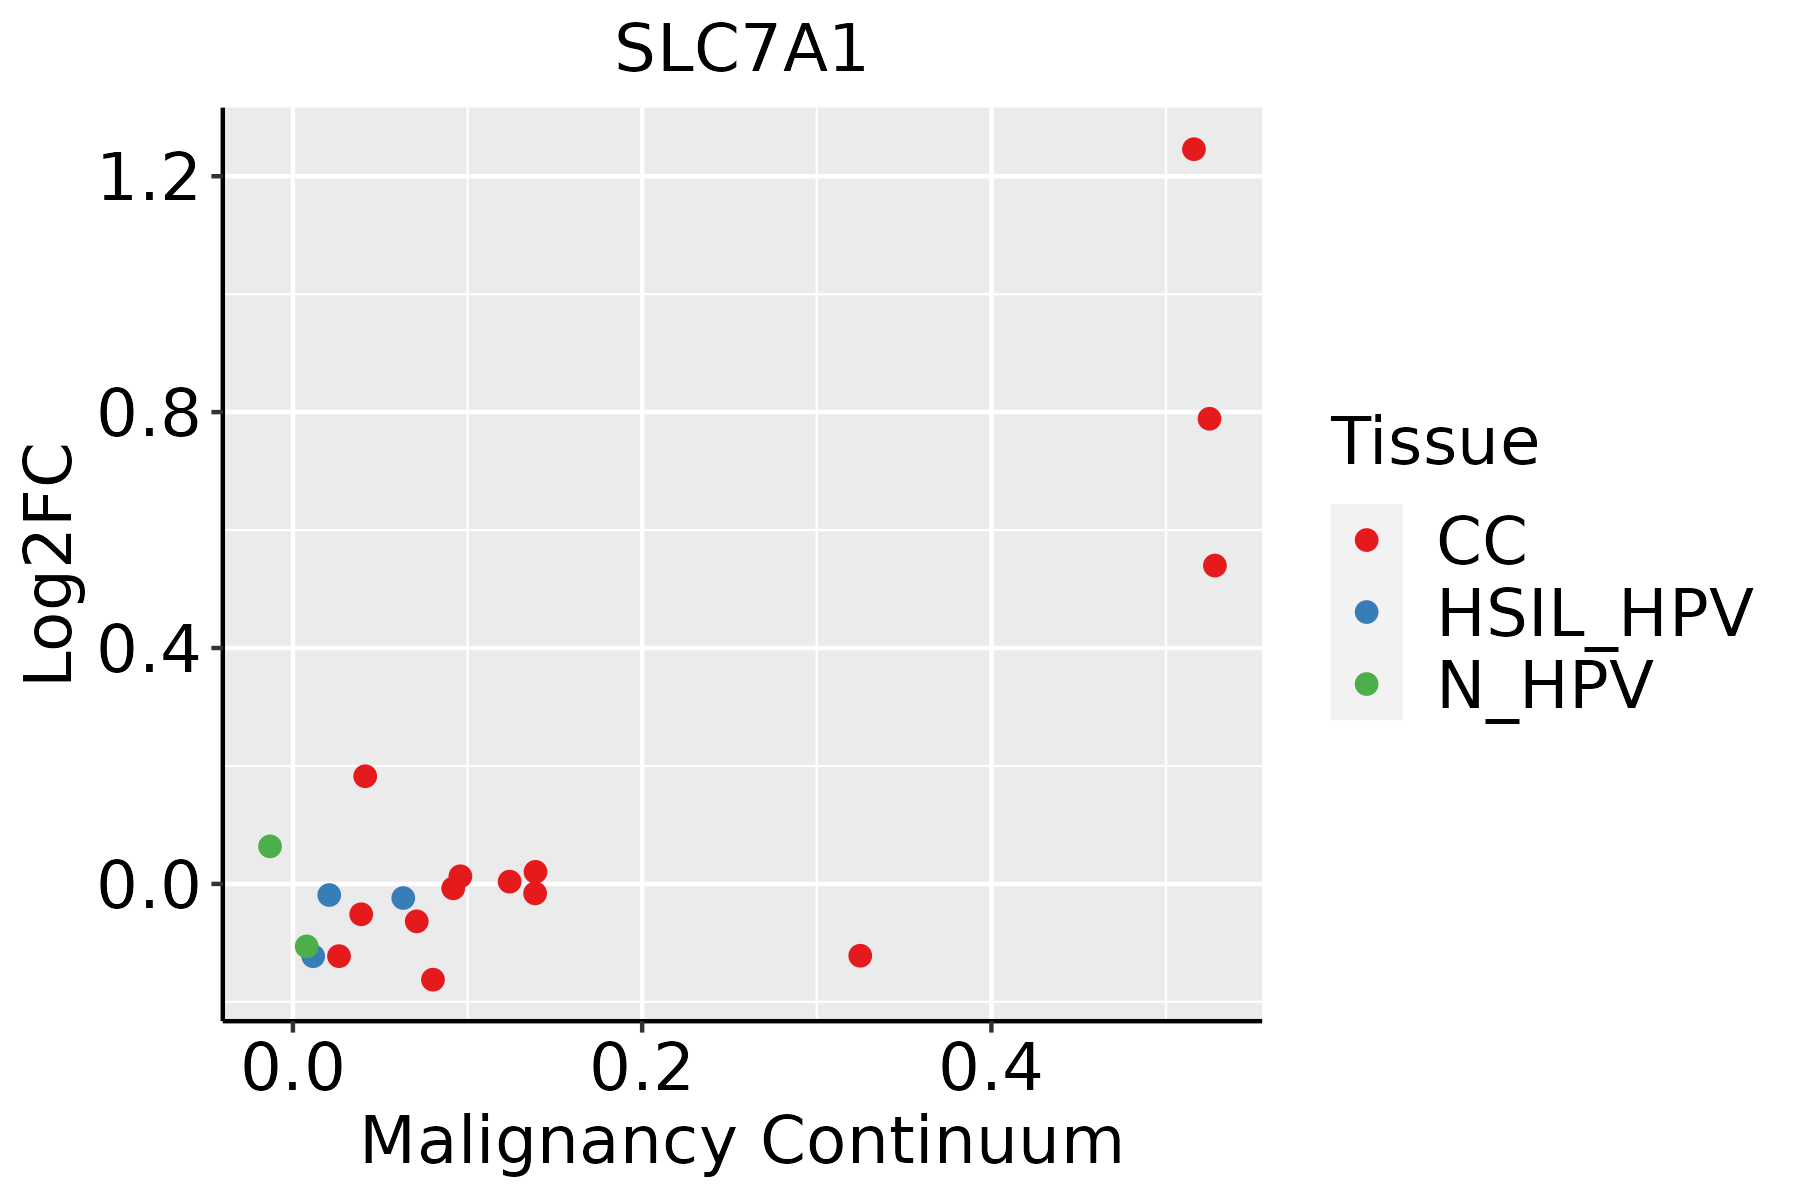 | CC: Cervix cancer |
| HSIL_HPV: HPV-infected high-grade squamous intraepithelial lesions |
| N_HPV: HPV-infected normal cervix |
| Endometrium | 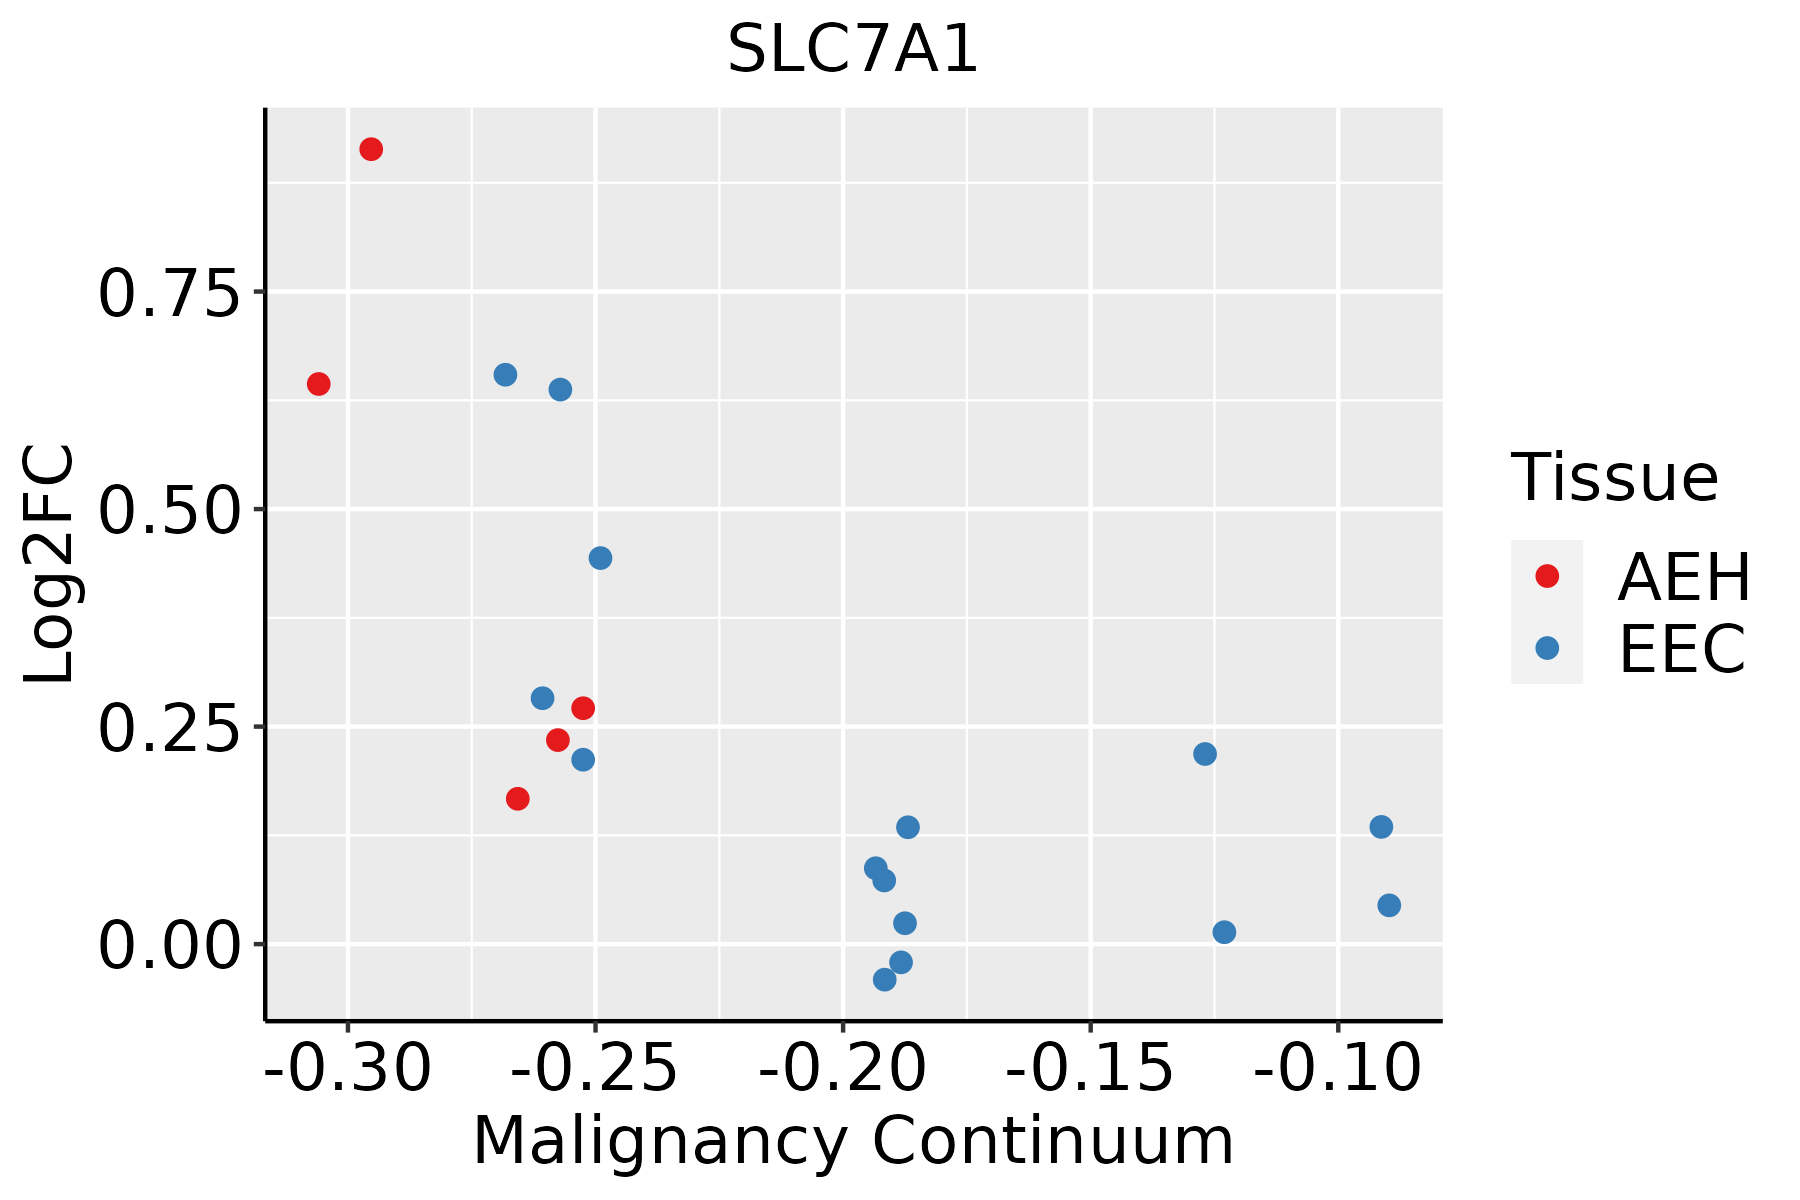 | AEH: Atypical endometrial hyperplasia |
| EEC: Endometrioid Cancer |
| Esophagus | 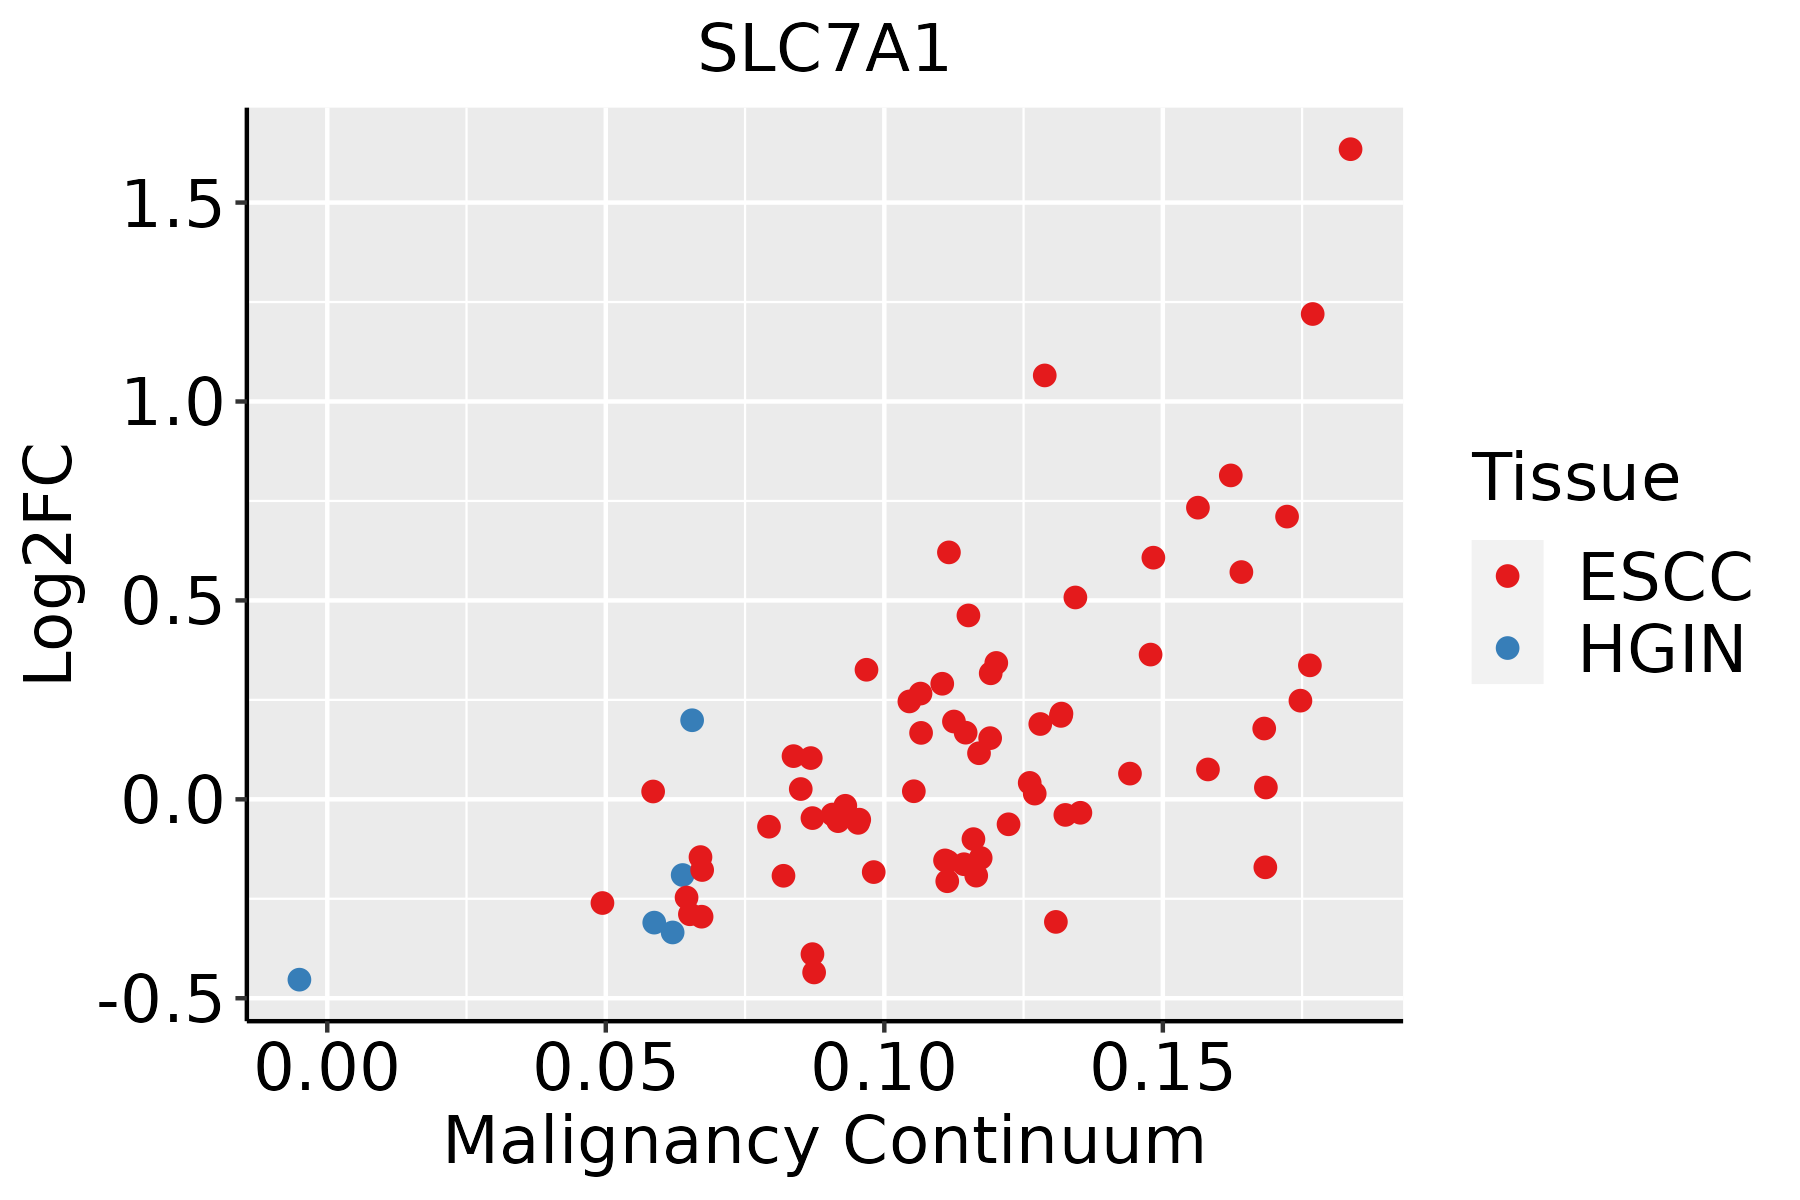 | ESCC: Esophageal squamous cell carcinoma |
| HGIN: High-grade intraepithelial neoplasias |
| LGIN: Low-grade intraepithelial neoplasias |
| Oral Cavity | 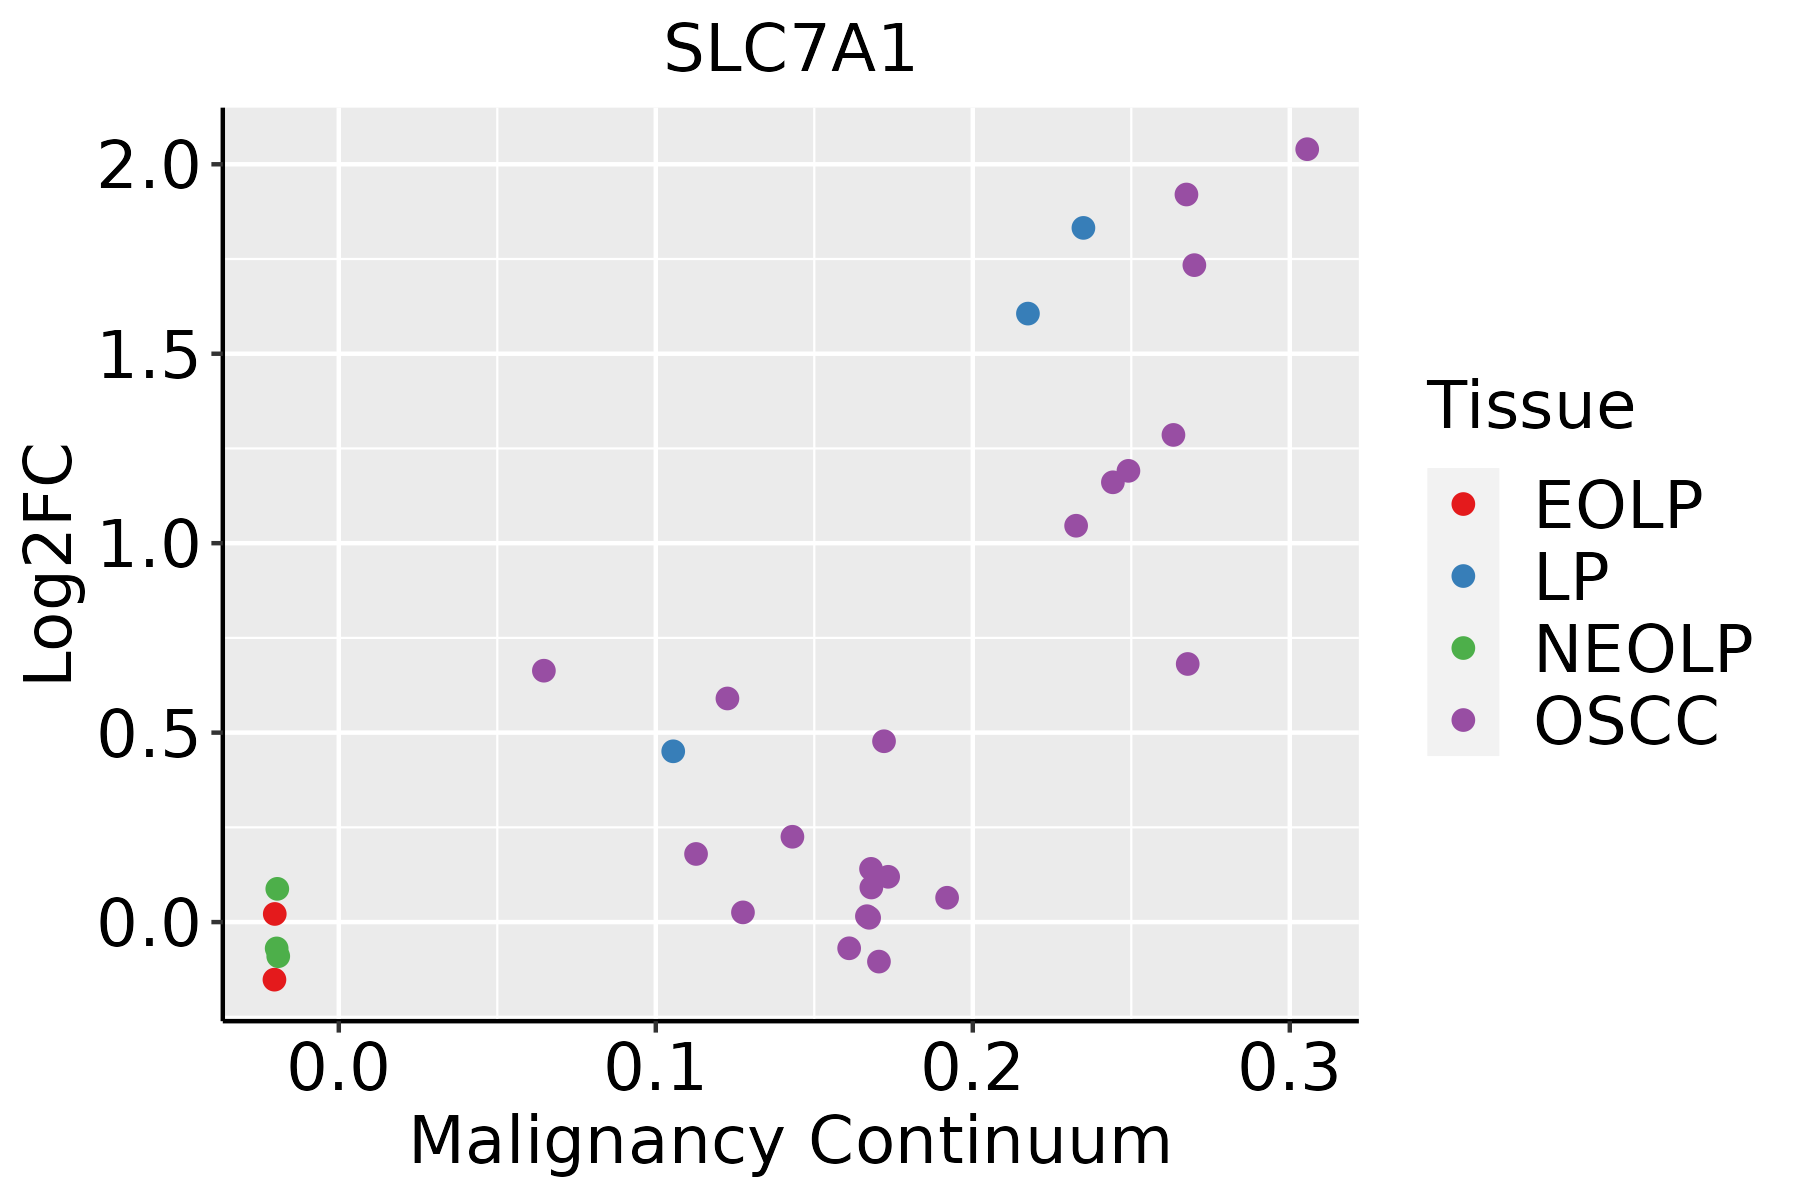 | EOLP: Erosive Oral lichen planus |
| LP: leukoplakia |
| NEOLP: Non-erosive oral lichen planus |
| OSCC: Oral squamous cell carcinoma |
| Prostate |  | BPH: Benign Prostatic Hyperplasia |
| Skin | 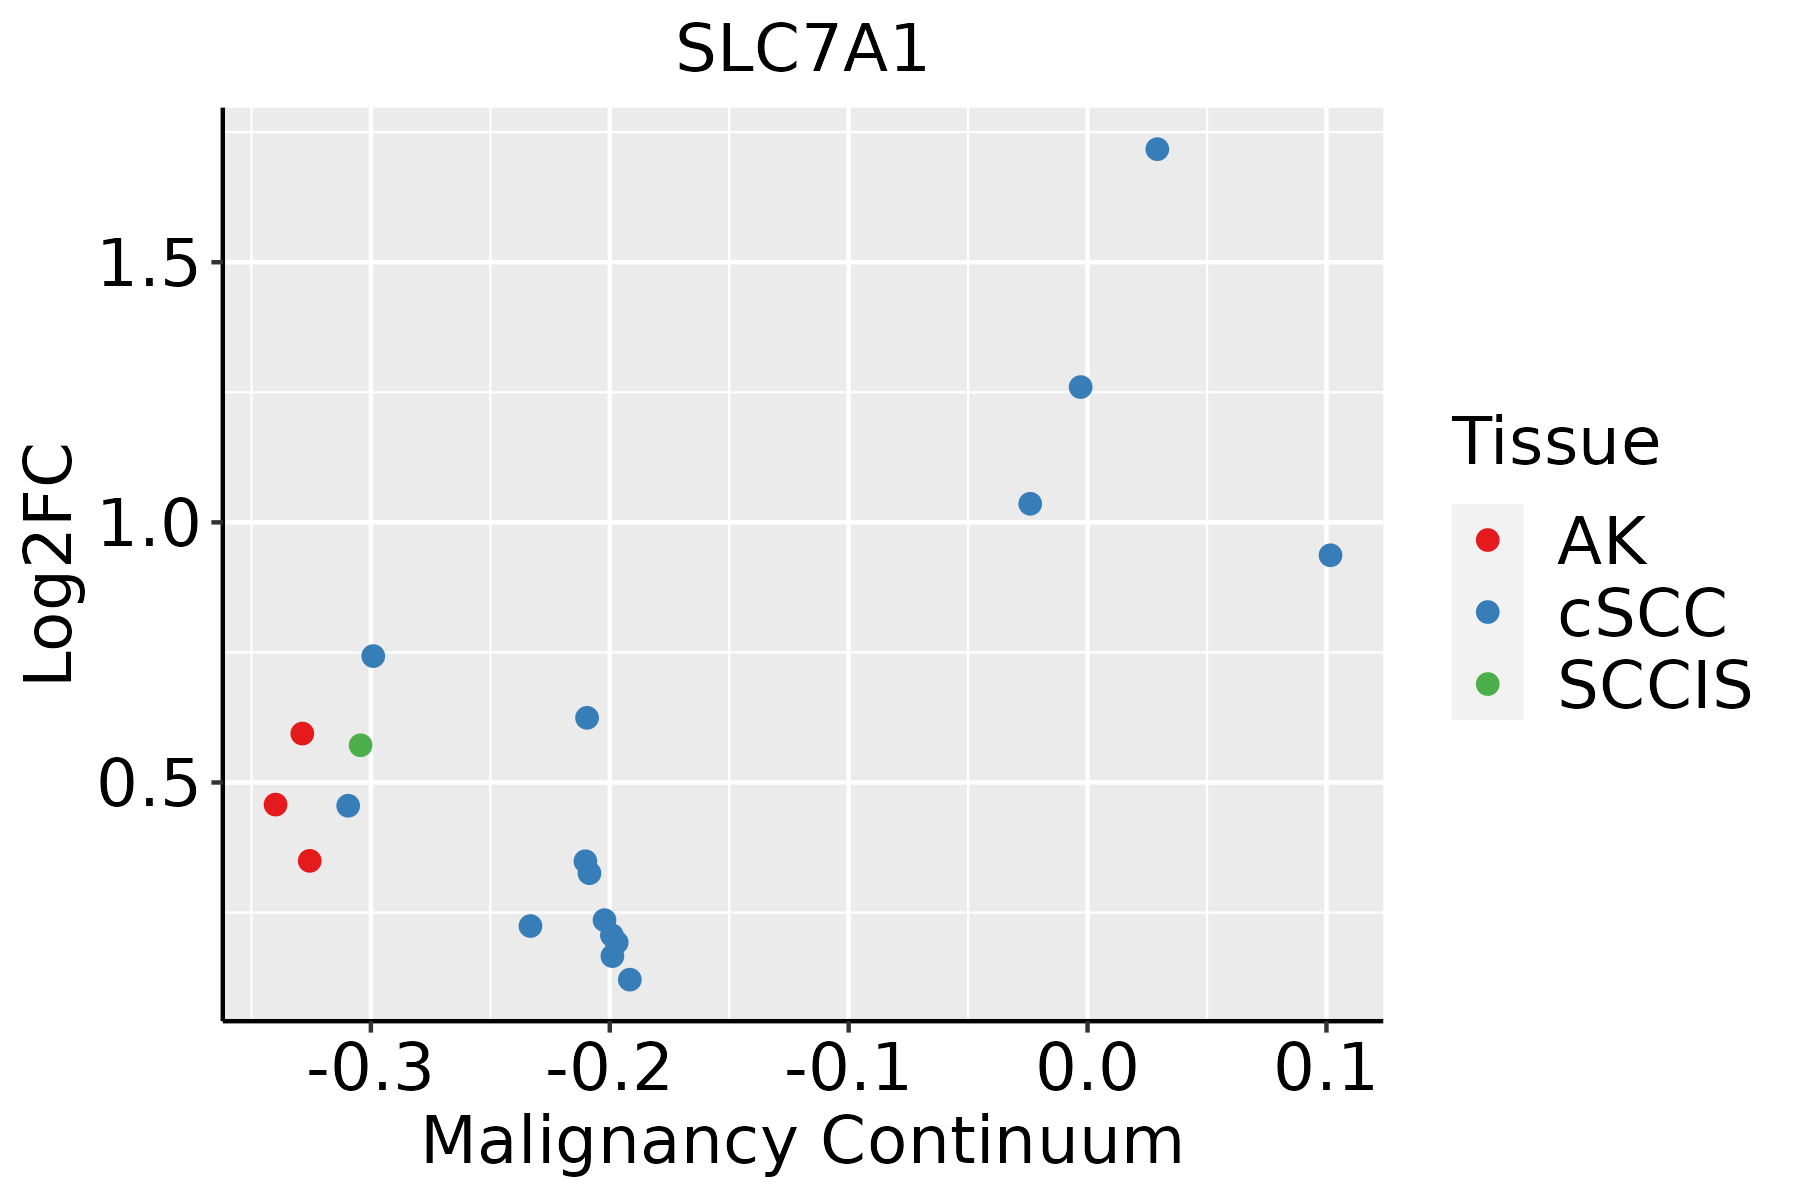 | AK: Actinic keratosis |
| cSCC: Cutaneous squamous cell carcinoma |
| SCCIS:squamous cell carcinoma in situ |
| Thyroid | 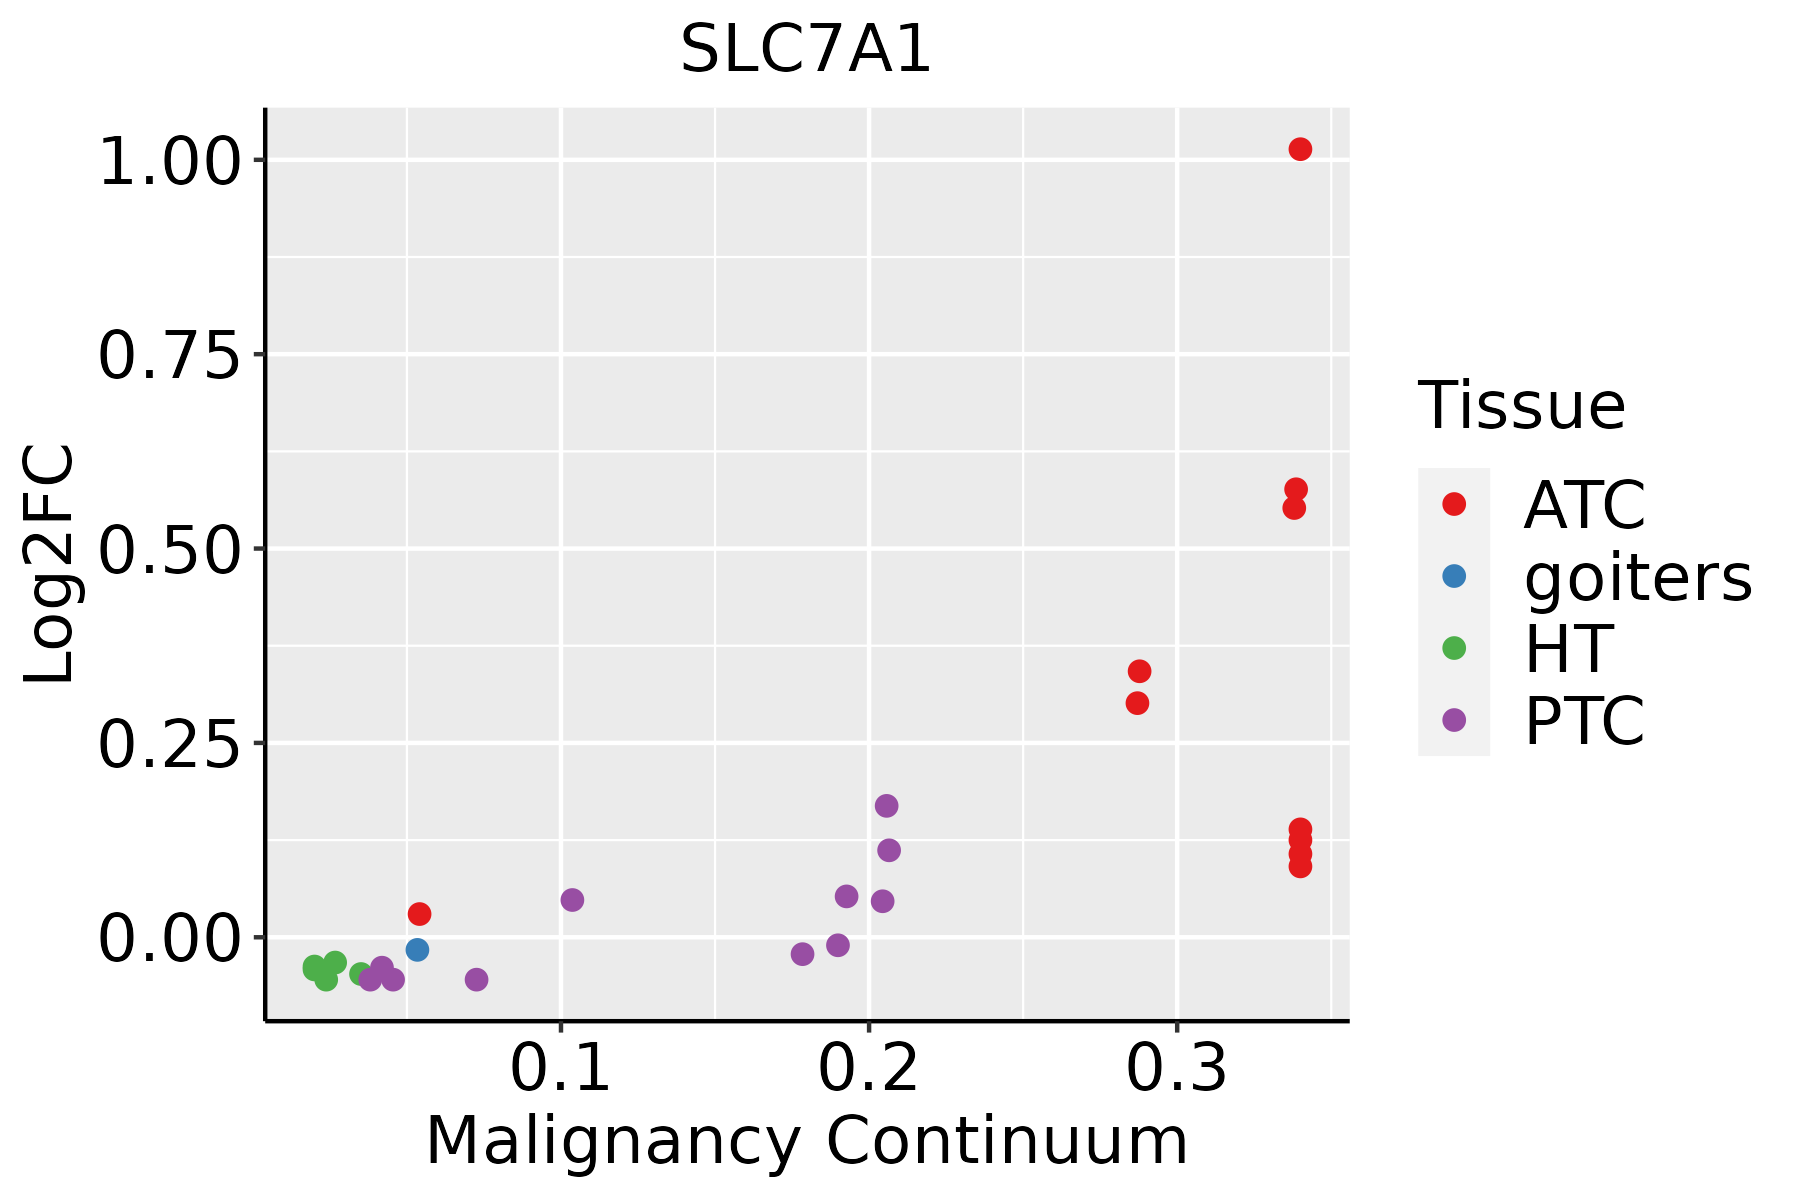 | ATC: Anaplastic thyroid cancer |
| HT: Hashimoto's thyroiditis |
| PTC: Papillary thyroid cancer |
| GO ID | Tissue | Disease Stage | Description | Gene Ratio | Bg Ratio | pvalue | p.adjust | Count |
| GO:00601738 | Thyroid | ATC | limb development | 76/6293 | 172/18723 | 2.41e-03 | 1.12e-02 | 76 |
| GO:000657522 | Thyroid | ATC | cellular modified amino acid metabolic process | 82/6293 | 188/18723 | 2.60e-03 | 1.20e-02 | 82 |
| GO:000759618 | Thyroid | ATC | blood coagulation | 93/6293 | 217/18723 | 2.69e-03 | 1.23e-02 | 93 |
| GO:004239822 | Thyroid | ATC | cellular modified amino acid biosynthetic process | 25/6293 | 46/18723 | 3.00e-03 | 1.36e-02 | 25 |
| GO:004427212 | Thyroid | ATC | sulfur compound biosynthetic process | 66/6293 | 148/18723 | 3.43e-03 | 1.53e-02 | 66 |
| GO:000759918 | Thyroid | ATC | hemostasis | 94/6293 | 222/18723 | 3.92e-03 | 1.70e-02 | 94 |
| GO:005081718 | Thyroid | ATC | coagulation | 94/6293 | 222/18723 | 3.92e-03 | 1.70e-02 | 94 |
| GO:20001062 | Thyroid | ATC | regulation of leukocyte apoptotic process | 39/6293 | 81/18723 | 4.65e-03 | 1.92e-02 | 39 |
| GO:00330281 | Thyroid | ATC | myeloid cell apoptotic process | 17/6293 | 29/18723 | 4.95e-03 | 2.03e-02 | 17 |
| GO:190320125 | Thyroid | ATC | regulation of oxidative stress-induced cell death | 36/6293 | 74/18723 | 5.19e-03 | 2.12e-02 | 36 |
| GO:190320422 | Thyroid | ATC | negative regulation of oxidative stress-induced neuron death | 12/6293 | 19/18723 | 7.97e-03 | 3.08e-02 | 12 |
| GO:00323292 | Thyroid | ATC | serine transport | 8/6293 | 11/18723 | 9.31e-03 | 3.44e-02 | 8 |
| GO:190040725 | Thyroid | ATC | regulation of cellular response to oxidative stress | 41/6293 | 89/18723 | 9.71e-03 | 3.56e-02 | 41 |
| GO:0050878112 | Thyroid | ATC | regulation of body fluid levels | 149/6293 | 379/18723 | 1.08e-02 | 3.90e-02 | 149 |
| GO:003016813 | Thyroid | ATC | platelet activation | 54/6293 | 123/18723 | 1.10e-02 | 3.95e-02 | 54 |
| GO:005080712 | Thyroid | ATC | regulation of synapse organization | 87/6293 | 211/18723 | 1.20e-02 | 4.27e-02 | 87 |
| GO:003647521 | Thyroid | ATC | neuron death in response to oxidative stress | 17/6293 | 31/18723 | 1.21e-02 | 4.27e-02 | 17 |
| GO:1902882110 | Thyroid | ATC | regulation of response to oxidative stress | 44/6293 | 98/18723 | 1.30e-02 | 4.55e-02 | 44 |
| GO:0043113 | Thyroid | ATC | receptor clustering | 26/6293 | 53/18723 | 1.42e-02 | 4.91e-02 | 26 |
| Hugo Symbol | Variant Class | Variant Classification | dbSNP RS | HGVSc | HGVSp | HGVSp Short | SWISSPROT | BIOTYPE | SIFT | PolyPhen | Tumor Sample Barcode | Tissue | Histology | Sex | Age | Stage | Therapy Types | Drugs | Outcome |
| SLC7A1 | SNV | Missense_Mutation | | c.623N>A | p.Gly208Glu | p.G208E | P30825 | protein_coding | deleterious(0) | probably_damaging(1) | TCGA-A8-A0A7-01 | Breast | breast invasive carcinoma | Female | <65 | I/II | Unknown | Unknown | SD |
| SLC7A1 | insertion | Nonsense_Mutation | novel | c.1165_1166insTTTAAATTTGTTTTAGTTGCAGTGATCTAGAGGGGCTTGA | p.Thr389IlefsTer2 | p.T389Ifs*2 | P30825 | protein_coding | | | TCGA-A8-A08H-01 | Breast | breast invasive carcinoma | Female | >=65 | I/II | Unknown | Unknown | SD |
| SLC7A1 | insertion | Frame_Shift_Ins | novel | c.1601_1602insTAAAT | p.Ser535LysfsTer37 | p.S535Kfs*37 | P30825 | protein_coding | | | TCGA-B6-A0IK-01 | Breast | breast invasive carcinoma | Female | <65 | III/IV | Unknown | Unknown | PD |
| SLC7A1 | insertion | In_Frame_Ins | novel | c.1600_1601insTCCCTCCGGGGTGGTGGGATGCTTCTC | p.Gly534delinsValProProGlyTrpTrpAspAlaSerArg | p.G534delinsVPPGWWDASR | P30825 | protein_coding | | | TCGA-B6-A0IK-01 | Breast | breast invasive carcinoma | Female | <65 | III/IV | Unknown | Unknown | PD |
| SLC7A1 | insertion | In_Frame_Ins | novel | c.373_374insAAACGATGAGAGGCGTCCATGGCAGAGCAGTGGTCT | p.Thr125delinsLysThrMetArgGlyValHisGlyArgAlaValValSer | p.T125delinsKTMRGVHGRAVVS | P30825 | protein_coding | | | TCGA-BH-A0EB-01 | Breast | breast invasive carcinoma | Female | >=65 | I/II | Hormone Therapy | arimidex | SD |
| SLC7A1 | SNV | Missense_Mutation | novel | c.874G>A | p.Ala292Thr | p.A292T | P30825 | protein_coding | tolerated(0.29) | possibly_damaging(0.555) | TCGA-2W-A8YY-01 | Cervix | cervical & endocervical cancer | Female | <65 | I/II | Chemotherapy | cisplatin | CR |
| SLC7A1 | SNV | Missense_Mutation | | c.308N>C | p.Val103Ala | p.V103A | P30825 | protein_coding | deleterious(0) | probably_damaging(0.999) | TCGA-FU-A3HZ-01 | Cervix | cervical & endocervical cancer | Female | <65 | I/II | Chemotherapy | cisplatin | CR |
| SLC7A1 | SNV | Missense_Mutation | rs767310993 | c.817N>A | p.Ala273Thr | p.A273T | P30825 | protein_coding | deleterious(0.01) | probably_damaging(0.981) | TCGA-VS-A94Z-01 | Cervix | cervical & endocervical cancer | Female | <65 | I/II | Chemotherapy | cisplatin | CR |
| SLC7A1 | SNV | Missense_Mutation | rs548607156 | c.1633N>A | p.Val545Ile | p.V545I | P30825 | protein_coding | tolerated(1) | benign(0) | TCGA-WL-A834-01 | Cervix | cervical & endocervical cancer | Female | <65 | I/II | Chemotherapy | paclitaxel | SD |
| SLC7A1 | SNV | Missense_Mutation | | c.44G>A | p.Arg15Gln | p.R15Q | P30825 | protein_coding | deleterious(0) | probably_damaging(0.999) | TCGA-A6-3810-01 | Colorectum | colon adenocarcinoma | Male | <65 | I/II | Unknown | Unknown | SD |


