
|
|||||
|
 | |
| |
| |
| |
| |
| |
|
Gene: S100A8 |
Gene summary for S100A8 |
| Gene information | Species | Human | Gene symbol | S100A8 | Gene ID | 6279 |
| Gene name | S100 calcium binding protein A8 | |
| Gene Alias | 60B8AG | |
| Cytomap | 1q21.3 | |
| Gene Type | protein-coding | GO ID | GO:0001558 | UniProtAcc | P05109 |
Top |
Malignant transformation analysis |
| Identification of the aberrant gene expression in precancerous and cancerous lesions by comparing the gene expression of stem-like cells in diseased tissues with normal stem cells |
| Entrez ID | Symbol | Replicates | Species | Organ | Tissue | Adj P-value | Log2FC | Malignancy |
| 6279 | S100A8 | GSM4909281 | Human | Breast | IDC | 7.21e-05 | -5.96e-01 | 0.21 |
| 6279 | S100A8 | GSM4909282 | Human | Breast | IDC | 1.05e-22 | 9.13e-02 | -0.0288 |
| 6279 | S100A8 | GSM4909285 | Human | Breast | IDC | 1.66e-11 | -7.11e-01 | 0.21 |
| 6279 | S100A8 | GSM4909286 | Human | Breast | IDC | 3.04e-13 | -7.14e-01 | 0.1081 |
| 6279 | S100A8 | GSM4909287 | Human | Breast | IDC | 8.51e-03 | -5.33e-01 | 0.2057 |
| 6279 | S100A8 | GSM4909290 | Human | Breast | IDC | 9.99e-07 | 1.30e-01 | 0.2096 |
| 6279 | S100A8 | GSM4909291 | Human | Breast | IDC | 2.83e-03 | -6.56e-01 | 0.1753 |
| 6279 | S100A8 | GSM4909293 | Human | Breast | IDC | 1.35e-11 | -6.97e-01 | 0.1581 |
| 6279 | S100A8 | GSM4909294 | Human | Breast | IDC | 8.86e-03 | -5.66e-01 | 0.2022 |
| 6279 | S100A8 | GSM4909297 | Human | Breast | IDC | 4.59e-10 | -7.04e-01 | 0.1517 |
| 6279 | S100A8 | GSM4909298 | Human | Breast | IDC | 2.44e-15 | -7.14e-01 | 0.1551 |
| 6279 | S100A8 | GSM4909299 | Human | Breast | IDC | 5.10e-04 | -5.79e-01 | 0.035 |
| 6279 | S100A8 | GSM4909301 | Human | Breast | IDC | 5.48e-15 | -7.03e-01 | 0.1577 |
| 6279 | S100A8 | GSM4909302 | Human | Breast | IDC | 6.86e-11 | -6.91e-01 | 0.1545 |
| 6279 | S100A8 | GSM4909303 | Human | Breast | IDC | 2.85e-03 | -7.14e-01 | 0.0438 |
| 6279 | S100A8 | GSM4909304 | Human | Breast | IDC | 6.28e-13 | -7.11e-01 | 0.1636 |
| 6279 | S100A8 | GSM4909305 | Human | Breast | IDC | 9.16e-08 | -7.05e-01 | 0.0436 |
| 6279 | S100A8 | GSM4909306 | Human | Breast | IDC | 1.66e-06 | -6.72e-01 | 0.1564 |
| 6279 | S100A8 | GSM4909307 | Human | Breast | IDC | 6.13e-14 | -7.14e-01 | 0.1569 |
| 6279 | S100A8 | GSM4909308 | Human | Breast | IDC | 4.53e-13 | -7.14e-01 | 0.158 |
| Page: 1 2 3 4 5 6 7 8 |
| Tissue | Expression Dynamics | Abbreviation |
| Breast |  | IDC: Invasive ductal carcinoma |
| DCIS: Ductal carcinoma in situ | ||
| Precancer(BRCA1-mut): Precancerous lesion from BRCA1 mutation carriers | ||
| Cervix | 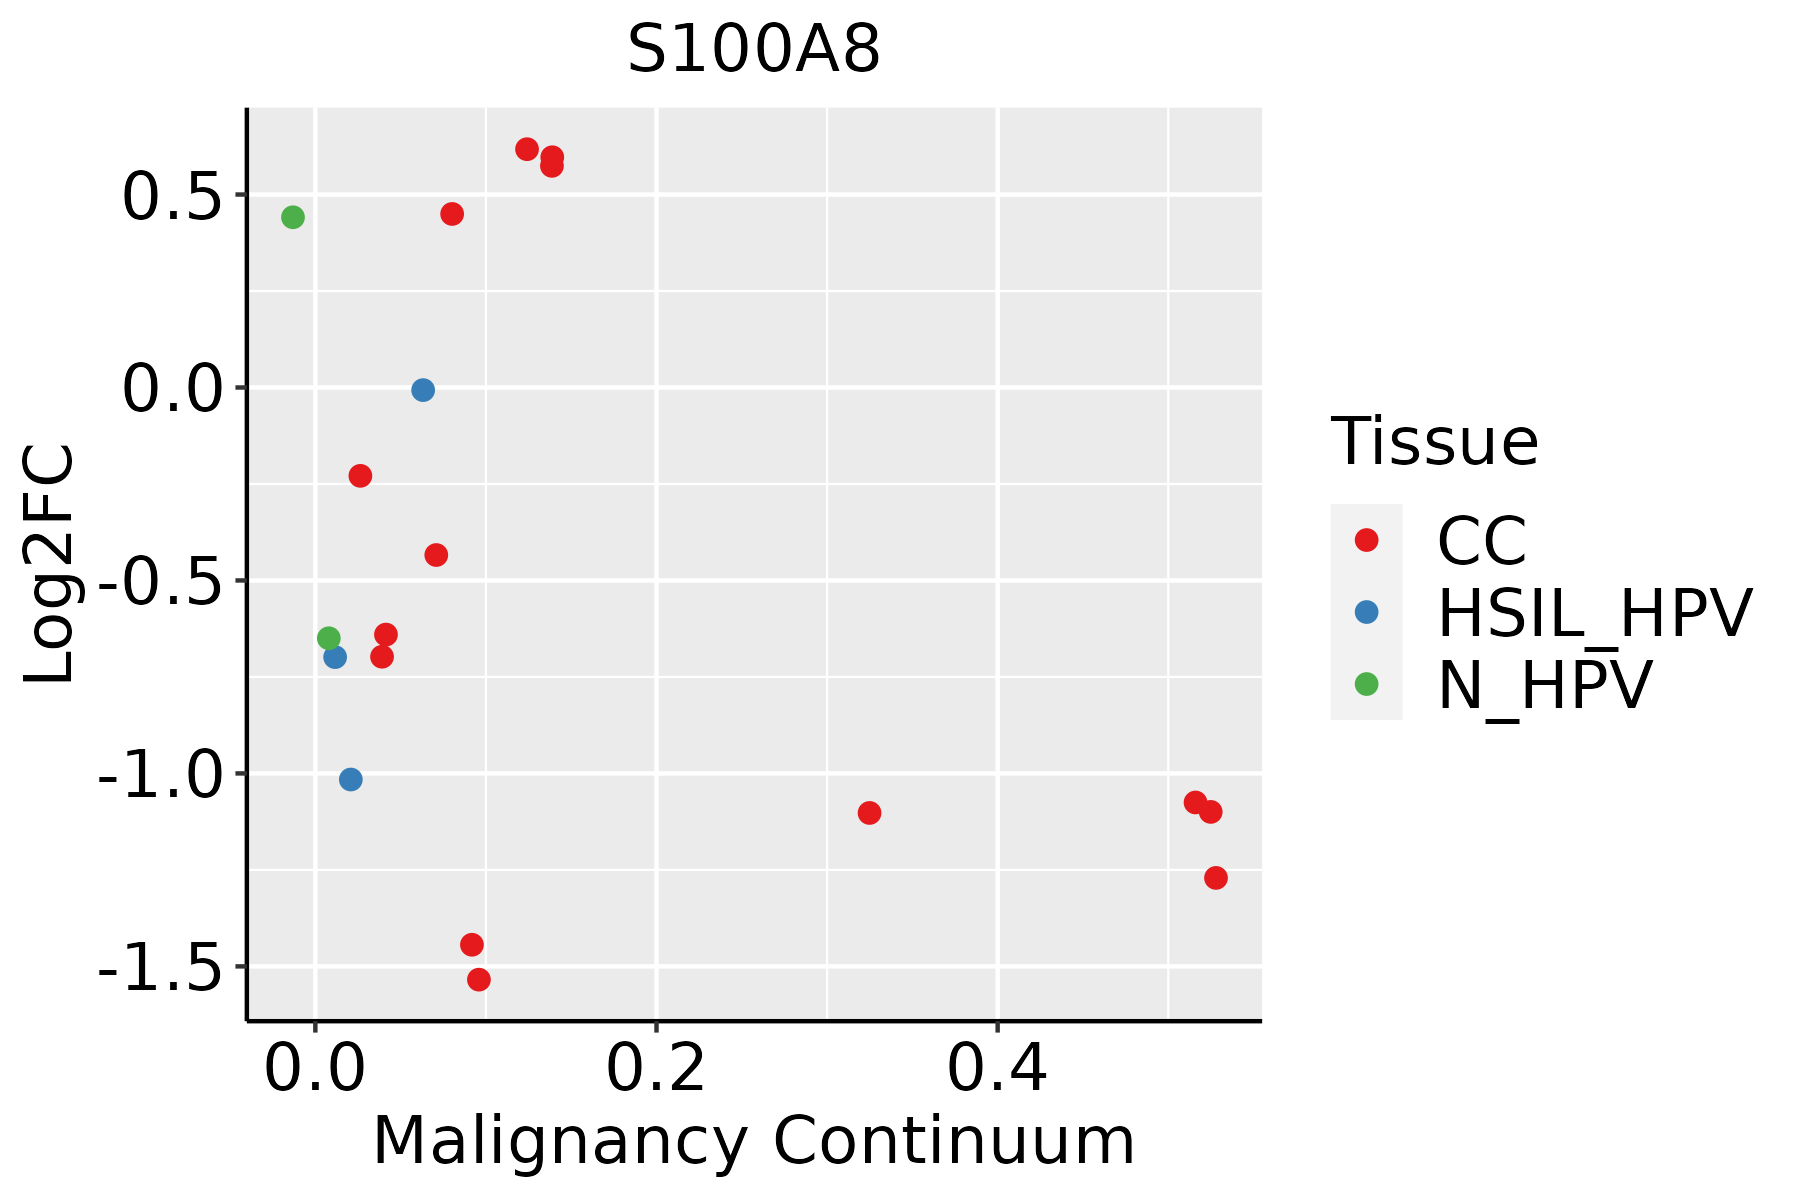 | CC: Cervix cancer |
| HSIL_HPV: HPV-infected high-grade squamous intraepithelial lesions | ||
| N_HPV: HPV-infected normal cervix | ||
| Esophagus |  | ESCC: Esophageal squamous cell carcinoma |
| HGIN: High-grade intraepithelial neoplasias | ||
| LGIN: Low-grade intraepithelial neoplasias | ||
| Oral Cavity | 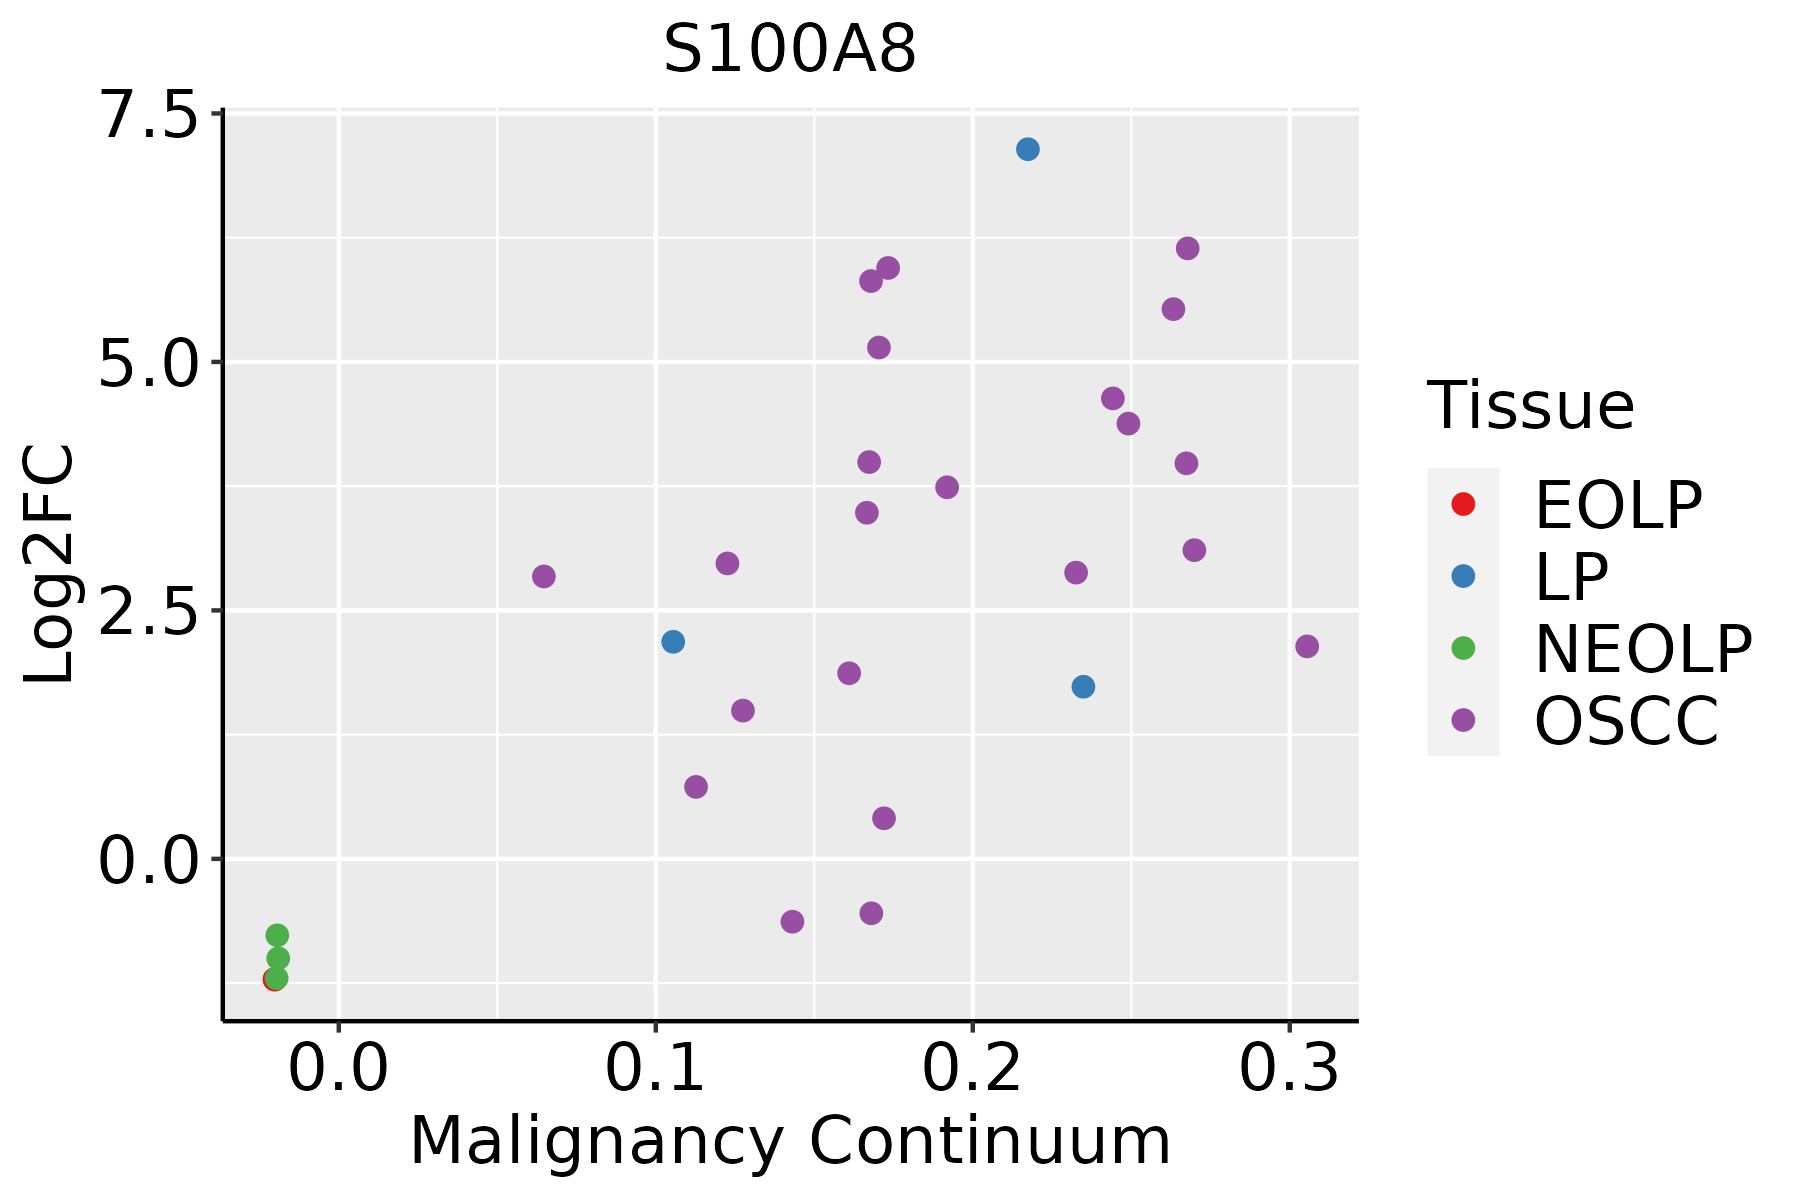 | EOLP: Erosive Oral lichen planus |
| LP: leukoplakia | ||
| NEOLP: Non-erosive oral lichen planus | ||
| OSCC: Oral squamous cell carcinoma | ||
| Skin |  | AK: Actinic keratosis |
| cSCC: Cutaneous squamous cell carcinoma | ||
| SCCIS:squamous cell carcinoma in situ |
| ∗log2FC in expression of this searched gene in stem-like cells from each diseased tissue sample relative to stem-like cells in normal samples in each tissue plotted against the malignancy continuum. Samples are colored based on if they are from different disease stage. |
Top |
Malignant transformation related pathway analysis |
| Find out the enriched GO biological processes and KEGG pathways involved in transition from healthy to precancer to cancer |
| Tissue | Disease Stage | Enriched GO biological Processes |
| Colorectum | AD |  |
| Colorectum | SER |  |
| Colorectum | MSS |  |
| Colorectum | MSI-H |  |
| Colorectum | FAP |  |
| ∗Top 15 enriched GO BP terms are showed in the bar plot of each disease state in each tissue. Each row represents a significant GO biological process which is colored according to the -log10(p.adjust). |
| Page: 1 2 3 4 5 6 7 8 9 |
| GO ID | Tissue | Disease Stage | Description | Gene Ratio | Bg Ratio | pvalue | p.adjust | Count |
| GO:004592710 | Oral cavity | OSCC | positive regulation of growth | 125/7305 | 259/18723 | 1.44e-03 | 6.97e-03 | 125 |
| GO:00100015 | Oral cavity | OSCC | glial cell differentiation | 110/7305 | 225/18723 | 1.56e-03 | 7.45e-03 | 110 |
| GO:00603269 | Oral cavity | OSCC | cell chemotaxis | 146/7305 | 310/18723 | 2.13e-03 | 9.80e-03 | 146 |
| GO:00305959 | Oral cavity | OSCC | leukocyte chemotaxis | 110/7305 | 230/18723 | 3.86e-03 | 1.58e-02 | 110 |
| GO:00550695 | Oral cavity | OSCC | zinc ion homeostasis | 24/7305 | 40/18723 | 5.76e-03 | 2.22e-02 | 24 |
| GO:00068825 | Oral cavity | OSCC | cellular zinc ion homeostasis | 23/7305 | 38/18723 | 5.87e-03 | 2.24e-02 | 23 |
| GO:007162110 | Oral cavity | OSCC | granulocyte chemotaxis | 62/7305 | 125/18723 | 1.02e-02 | 3.52e-02 | 62 |
| GO:00313495 | Oral cavity | OSCC | positive regulation of defense response | 127/7305 | 278/18723 | 1.32e-02 | 4.39e-02 | 127 |
| GO:0097193110 | Oral cavity | LP | intrinsic apoptotic signaling pathway | 146/4623 | 288/18723 | 9.76e-22 | 2.78e-19 | 146 |
| GO:2001233110 | Oral cavity | LP | regulation of apoptotic signaling pathway | 168/4623 | 356/18723 | 1.35e-20 | 3.02e-18 | 168 |
| GO:2001242110 | Oral cavity | LP | regulation of intrinsic apoptotic signaling pathway | 95/4623 | 164/18723 | 9.85e-20 | 1.99e-17 | 95 |
| GO:0045862110 | Oral cavity | LP | positive regulation of proteolysis | 165/4623 | 372/18723 | 5.40e-17 | 8.46e-15 | 165 |
| GO:2000116110 | Oral cavity | LP | regulation of cysteine-type endopeptidase activity | 109/4623 | 235/18723 | 3.16e-13 | 2.91e-11 | 109 |
| GO:0043281110 | Oral cavity | LP | regulation of cysteine-type endopeptidase activity involved in apoptotic process | 99/4623 | 209/18723 | 7.89e-13 | 6.68e-11 | 99 |
| GO:0052547110 | Oral cavity | LP | regulation of peptidase activity | 177/4623 | 461/18723 | 3.01e-11 | 2.00e-09 | 177 |
| GO:0052548110 | Oral cavity | LP | regulation of endopeptidase activity | 164/4623 | 432/18723 | 4.33e-10 | 2.20e-08 | 164 |
| GO:0010952110 | Oral cavity | LP | positive regulation of peptidase activity | 88/4623 | 197/18723 | 6.52e-10 | 3.14e-08 | 88 |
| GO:200123518 | Oral cavity | LP | positive regulation of apoptotic signaling pathway | 63/4623 | 126/18723 | 7.17e-10 | 3.43e-08 | 63 |
| GO:0010950110 | Oral cavity | LP | positive regulation of endopeptidase activity | 79/4623 | 179/18723 | 9.34e-09 | 3.62e-07 | 79 |
| GO:200124416 | Oral cavity | LP | positive regulation of intrinsic apoptotic signaling pathway | 33/4623 | 58/18723 | 1.63e-07 | 5.11e-06 | 33 |
| Page: 1 2 3 4 5 6 7 8 9 10 11 12 13 14 15 16 17 18 19 20 21 22 23 24 25 26 27 28 29 30 31 32 |
| Pathway ID | Tissue | Disease Stage | Description | Gene Ratio | Bg Ratio | pvalue | p.adjust | qvalue | Count |
| hsa0465721 | Breast | IDC | IL-17 signaling pathway | 18/867 | 94/8465 | 6.39e-03 | 3.30e-02 | 2.47e-02 | 18 |
| hsa0465731 | Breast | IDC | IL-17 signaling pathway | 18/867 | 94/8465 | 6.39e-03 | 3.30e-02 | 2.47e-02 | 18 |
| hsa0465741 | Breast | DCIS | IL-17 signaling pathway | 18/846 | 94/8465 | 4.95e-03 | 2.67e-02 | 1.96e-02 | 18 |
| hsa0465751 | Breast | DCIS | IL-17 signaling pathway | 18/846 | 94/8465 | 4.95e-03 | 2.67e-02 | 1.96e-02 | 18 |
| hsa0465718 | Cervix | CC | IL-17 signaling pathway | 31/1267 | 94/8465 | 8.71e-06 | 7.43e-05 | 4.39e-05 | 31 |
| hsa0465719 | Cervix | CC | IL-17 signaling pathway | 31/1267 | 94/8465 | 8.71e-06 | 7.43e-05 | 4.39e-05 | 31 |
| hsa0465722 | Cervix | HSIL_HPV | IL-17 signaling pathway | 15/459 | 94/8465 | 1.45e-04 | 1.74e-03 | 1.40e-03 | 15 |
| hsa0465732 | Cervix | HSIL_HPV | IL-17 signaling pathway | 15/459 | 94/8465 | 1.45e-04 | 1.74e-03 | 1.40e-03 | 15 |
| hsa0465742 | Cervix | N_HPV | IL-17 signaling pathway | 16/349 | 94/8465 | 1.20e-06 | 1.64e-05 | 1.28e-05 | 16 |
| hsa0465752 | Cervix | N_HPV | IL-17 signaling pathway | 16/349 | 94/8465 | 1.20e-06 | 1.64e-05 | 1.28e-05 | 16 |
| hsa0465726 | Esophagus | HGIN | IL-17 signaling pathway | 25/1383 | 94/8465 | 7.52e-03 | 4.63e-02 | 3.68e-02 | 25 |
| hsa04657113 | Esophagus | HGIN | IL-17 signaling pathway | 25/1383 | 94/8465 | 7.52e-03 | 4.63e-02 | 3.68e-02 | 25 |
| hsa0465727 | Esophagus | ESCC | IL-17 signaling pathway | 66/4205 | 94/8465 | 3.93e-05 | 1.75e-04 | 8.99e-05 | 66 |
| hsa0465734 | Esophagus | ESCC | IL-17 signaling pathway | 66/4205 | 94/8465 | 3.93e-05 | 1.75e-04 | 8.99e-05 | 66 |
| hsa0465724 | Oral cavity | OSCC | IL-17 signaling pathway | 64/3704 | 94/8465 | 1.48e-06 | 7.87e-06 | 4.01e-06 | 64 |
| hsa04657112 | Oral cavity | OSCC | IL-17 signaling pathway | 64/3704 | 94/8465 | 1.48e-06 | 7.87e-06 | 4.01e-06 | 64 |
| hsa0465725 | Oral cavity | LP | IL-17 signaling pathway | 47/2418 | 94/8465 | 8.45e-06 | 6.25e-05 | 4.03e-05 | 47 |
| hsa0465733 | Oral cavity | LP | IL-17 signaling pathway | 47/2418 | 94/8465 | 8.45e-06 | 6.25e-05 | 4.03e-05 | 47 |
| hsa0465743 | Oral cavity | EOLP | IL-17 signaling pathway | 24/1218 | 94/8465 | 2.98e-03 | 9.61e-03 | 5.67e-03 | 24 |
| hsa0465753 | Oral cavity | EOLP | IL-17 signaling pathway | 24/1218 | 94/8465 | 2.98e-03 | 9.61e-03 | 5.67e-03 | 24 |
| Page: 1 2 |
Top |
Cell-cell communication analysis |
| Identification of potential cell-cell interactions between two cell types and their ligand-receptor pairs for different disease states |
| Ligand | Receptor | LRpair | Pathway | Tissue | Disease Stage |
| Page: 1 |
Top |
Single-cell gene regulatory network inference analysis |
| Find out the significant the regulons (TFs) and the target genes of each regulon across cell types for different disease states |
| TF | Cell Type | Tissue | Disease Stage | Target Gene | RSS | Regulon Activity |
| ∗The dot plots of a searched regulon are shown for all cell subpopulations in each disease state of each tissue based on the regulon specific score inferred using pySCENIC and by calculating the average expression. |
| Page: 1 |
Top |
Somatic mutation of malignant transformation related genes |
| Annotation of somatic variants for genes involved in malignant transformation |
| Hugo Symbol | Variant Class | Variant Classification | dbSNP RS | HGVSc | HGVSp | HGVSp Short | SWISSPROT | BIOTYPE | SIFT | PolyPhen | Tumor Sample Barcode | Tissue | Histology | Sex | Age | Stage | Therapy Types | Drugs | Outcome |
| S100A8 | SNV | Missense_Mutation | c.221N>C | p.Leu74Pro | p.L74P | P05109 | protein_coding | deleterious(0) | possibly_damaging(0.87) | TCGA-CK-5916-01 | Colorectum | colon adenocarcinoma | Female | >=65 | I/II | Unknown | Unknown | PD | |
| S100A8 | deletion | Frame_Shift_Del | c.256delA | p.Ser86AlafsTer10 | p.S86Afs*10 | P05109 | protein_coding | TCGA-A6-5665-01 | Colorectum | colon adenocarcinoma | Female | >=65 | I/II | Unknown | Unknown | PD | |||
| S100A8 | deletion | Frame_Shift_Del | c.256delN | p.Ser86AlafsTer10 | p.S86Afs*10 | P05109 | protein_coding | TCGA-AU-6004-01 | Colorectum | colon adenocarcinoma | Female | >=65 | I/II | Unknown | Unknown | SD | |||
| S100A8 | deletion | Frame_Shift_Del | c.256delN | p.Ser86AlafsTer10 | p.S86Afs*10 | P05109 | protein_coding | TCGA-AZ-6598-01 | Colorectum | colon adenocarcinoma | Female | >=65 | I/II | Unknown | Unknown | SD | |||
| S100A8 | SNV | Missense_Mutation | novel | c.154N>A | p.Asp52Asn | p.D52N | P05109 | protein_coding | tolerated(0.05) | benign(0.003) | TCGA-A5-A0G2-01 | Endometrium | uterine corpus endometrioid carcinoma | Female | <65 | III/IV | Unknown | Unknown | SD |
| S100A8 | SNV | Missense_Mutation | c.207N>T | p.Gln69His | p.Q69H | P05109 | protein_coding | deleterious(0) | benign(0.258) | TCGA-AP-A0LM-01 | Endometrium | uterine corpus endometrioid carcinoma | Female | <65 | III/IV | Chemotherapy | cisplatin | SD | |
| S100A8 | SNV | Missense_Mutation | rs780156471 | c.59C>T | p.Ser20Phe | p.S20F | P05109 | protein_coding | deleterious(0) | probably_damaging(0.998) | TCGA-AP-A0LP-01 | Endometrium | uterine corpus endometrioid carcinoma | Female | >=65 | I/II | Hormone Therapy | megace | SD |
| S100A8 | SNV | Missense_Mutation | novel | c.245C>T | p.Ala82Val | p.A82V | P05109 | protein_coding | deleterious(0.03) | possibly_damaging(0.494) | TCGA-DI-A1BY-01 | Endometrium | uterine corpus endometrioid carcinoma | Female | <65 | I/II | Unknown | Unknown | SD |
| S100A8 | SNV | Missense_Mutation | novel | c.263N>C | p.Glu88Ala | p.E88A | P05109 | protein_coding | deleterious(0) | benign(0.011) | TCGA-E6-A1LX-01 | Endometrium | uterine corpus endometrioid carcinoma | Female | <65 | I/II | Unknown | Unknown | SD |
| S100A8 | insertion | Frame_Shift_Ins | novel | c.256dupA | p.Ser86LysfsTer3 | p.S86Kfs*3 | P05109 | protein_coding | TCGA-B5-A3FC-01 | Endometrium | uterine corpus endometrioid carcinoma | Female | <65 | I/II | Unknown | Unknown | SD |
| Page: 1 2 |
Top |
Related drugs of malignant transformation related genes |
| Identification of chemicals and drugs interact with genes involved in malignant transfromation |
| (DGIdb 4.0) |
| Entrez ID | Symbol | Category | Interaction Types | Drug Claim Name | Drug Name | PMIDs |
| 6279 | S100A8 | DRUGGABLE GENOME, KINASE, ENZYME | MTX | METHOTREXATE | 14722212 |
| Page: 1 |

Copyright 2023-Present -The University of Texas Health Science Center at Houston |