
|
|||||
|
 | |
| |
| |
| |
| |
| |
|
Gene: RAB11A |
Gene summary for RAB11A |
| Gene information | Species | Human | Gene symbol | RAB11A | Gene ID | 8766 |
| Gene name | RAB11A, member RAS oncogene family | |
| Gene Alias | YL8 | |
| Cytomap | 15q22.31 | |
| Gene Type | protein-coding | GO ID | GO:0000070 | UniProtAcc | P62491 |
Top |
Malignant transformation analysis |
| Identification of the aberrant gene expression in precancerous and cancerous lesions by comparing the gene expression of stem-like cells in diseased tissues with normal stem cells |
| Entrez ID | Symbol | Replicates | Species | Organ | Tissue | Adj P-value | Log2FC | Malignancy |
| 8766 | RAB11A | CA_HPV_1 | Human | Cervix | CC | 4.39e-05 | -1.31e-01 | 0.0264 |
| 8766 | RAB11A | N_HPV_1 | Human | Cervix | N_HPV | 2.49e-03 | -9.69e-02 | 0.0079 |
| 8766 | RAB11A | CCI_2 | Human | Cervix | CC | 7.53e-06 | 1.07e+00 | 0.5249 |
| 8766 | RAB11A | Tumor | Human | Cervix | CC | 2.58e-14 | 4.78e-01 | 0.1241 |
| 8766 | RAB11A | sample3 | Human | Cervix | CC | 3.38e-22 | 5.28e-01 | 0.1387 |
| 8766 | RAB11A | T3 | Human | Cervix | CC | 4.64e-22 | 5.65e-01 | 0.1389 |
| 8766 | RAB11A | HTA11_347_2000001011 | Human | Colorectum | AD | 2.28e-07 | 4.38e-01 | -0.1954 |
| 8766 | RAB11A | HTA11_99999974143_84620 | Human | Colorectum | MSS | 1.81e-03 | -1.98e-01 | 0.3005 |
| 8766 | RAB11A | A001-C-207 | Human | Colorectum | FAP | 1.35e-02 | -2.57e-01 | 0.1278 |
| 8766 | RAB11A | A015-C-203 | Human | Colorectum | FAP | 1.47e-16 | -3.05e-01 | -0.1294 |
| 8766 | RAB11A | A015-C-204 | Human | Colorectum | FAP | 3.09e-04 | -3.03e-01 | -0.0228 |
| 8766 | RAB11A | A002-C-201 | Human | Colorectum | FAP | 1.01e-09 | -3.26e-01 | 0.0324 |
| 8766 | RAB11A | A001-C-119 | Human | Colorectum | FAP | 1.50e-02 | -2.73e-01 | -0.1557 |
| 8766 | RAB11A | A001-C-108 | Human | Colorectum | FAP | 7.54e-15 | -3.29e-01 | -0.0272 |
| 8766 | RAB11A | A002-C-205 | Human | Colorectum | FAP | 9.06e-12 | -3.37e-01 | -0.1236 |
| 8766 | RAB11A | A001-C-104 | Human | Colorectum | FAP | 9.80e-06 | -2.65e-01 | 0.0184 |
| 8766 | RAB11A | A015-C-005 | Human | Colorectum | FAP | 3.18e-03 | -2.73e-01 | -0.0336 |
| 8766 | RAB11A | A015-C-006 | Human | Colorectum | FAP | 3.16e-09 | -4.14e-01 | -0.0994 |
| 8766 | RAB11A | A015-C-106 | Human | Colorectum | FAP | 2.86e-10 | -2.94e-01 | -0.0511 |
| 8766 | RAB11A | A002-C-114 | Human | Colorectum | FAP | 1.75e-11 | -3.97e-01 | -0.1561 |
| Page: 1 2 3 4 5 6 7 8 9 |
| Tissue | Expression Dynamics | Abbreviation |
| Cervix | 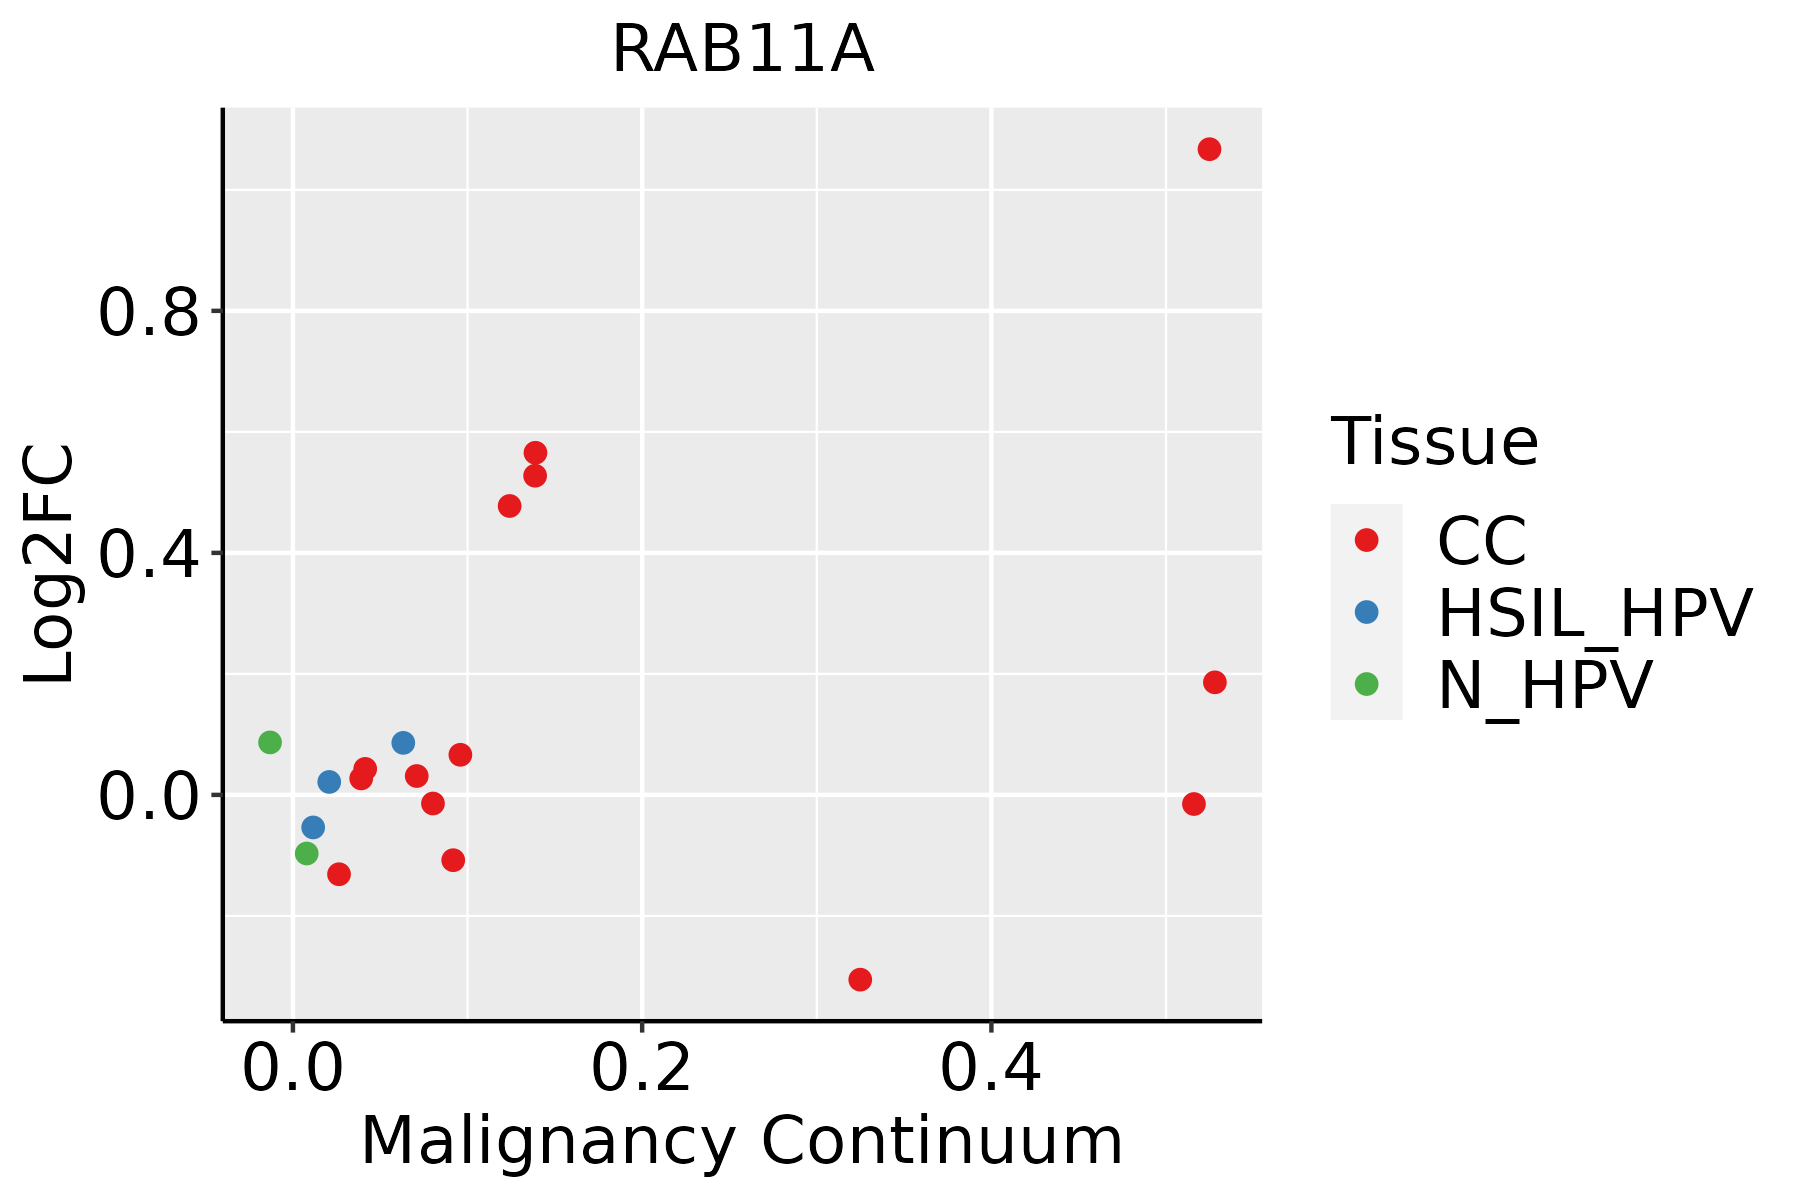 | CC: Cervix cancer |
| HSIL_HPV: HPV-infected high-grade squamous intraepithelial lesions | ||
| N_HPV: HPV-infected normal cervix | ||
| Colorectum (GSE201348) | 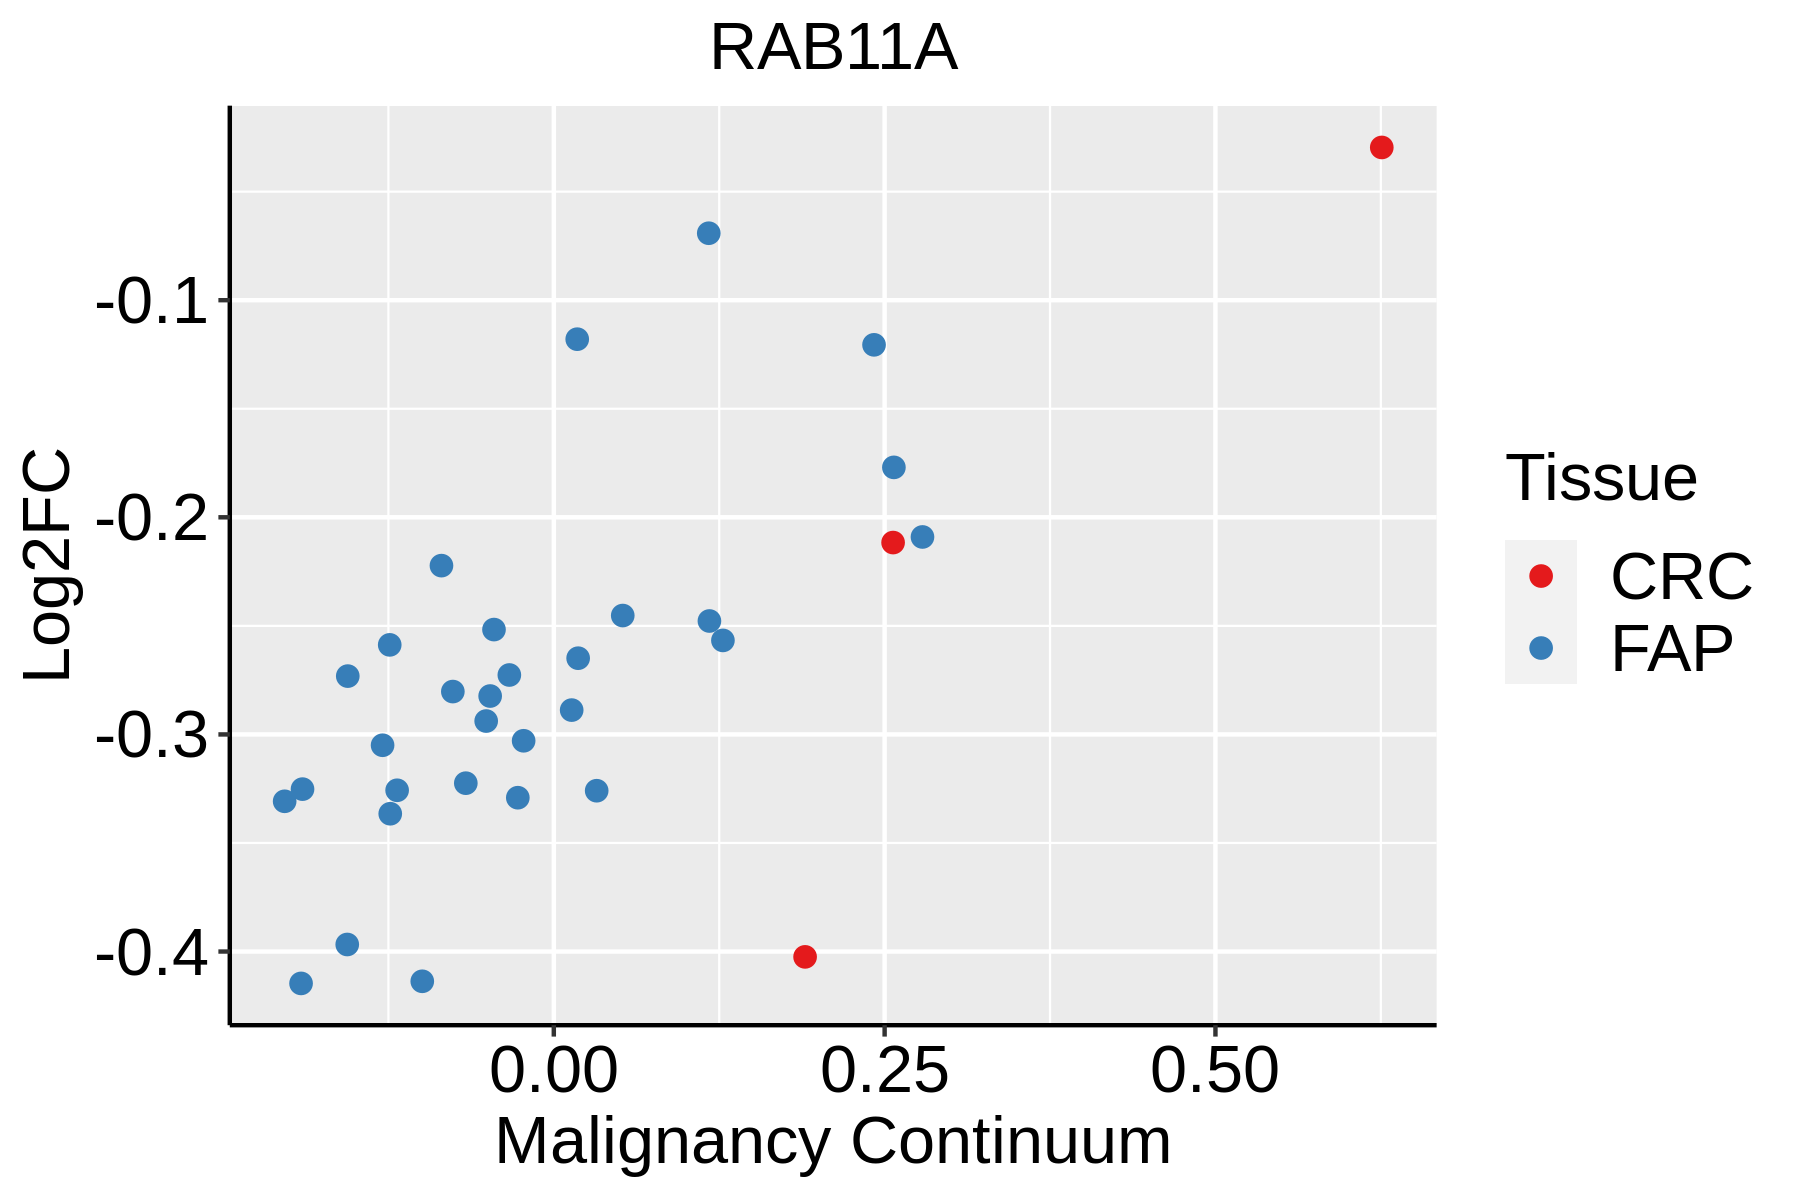 | FAP: Familial adenomatous polyposis |
| CRC: Colorectal cancer | ||
| Colorectum (HTA11) |  | AD: Adenomas |
| SER: Sessile serrated lesions | ||
| MSI-H: Microsatellite-high colorectal cancer | ||
| MSS: Microsatellite stable colorectal cancer | ||
| Esophagus | 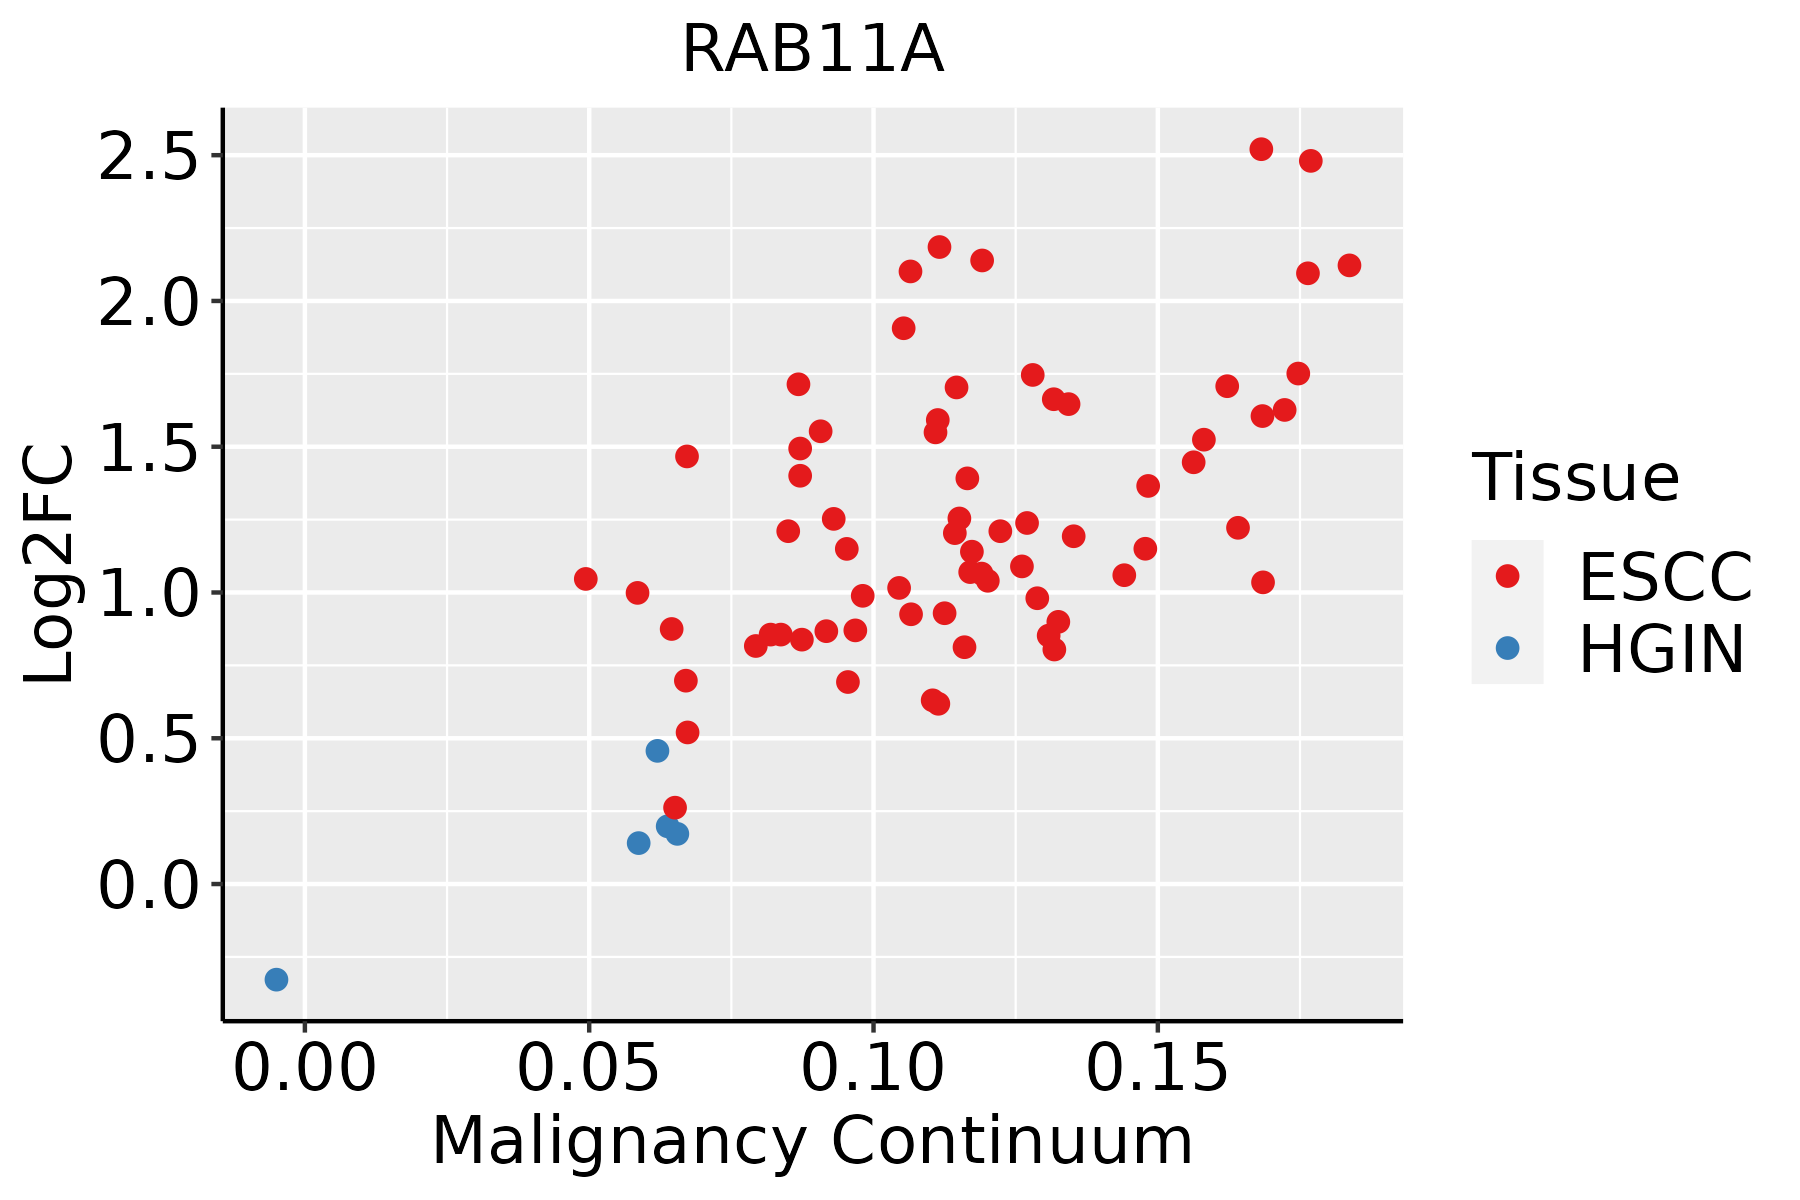 | ESCC: Esophageal squamous cell carcinoma |
| HGIN: High-grade intraepithelial neoplasias | ||
| LGIN: Low-grade intraepithelial neoplasias | ||
| Liver |  | HCC: Hepatocellular carcinoma |
| NAFLD: Non-alcoholic fatty liver disease | ||
| Oral Cavity | 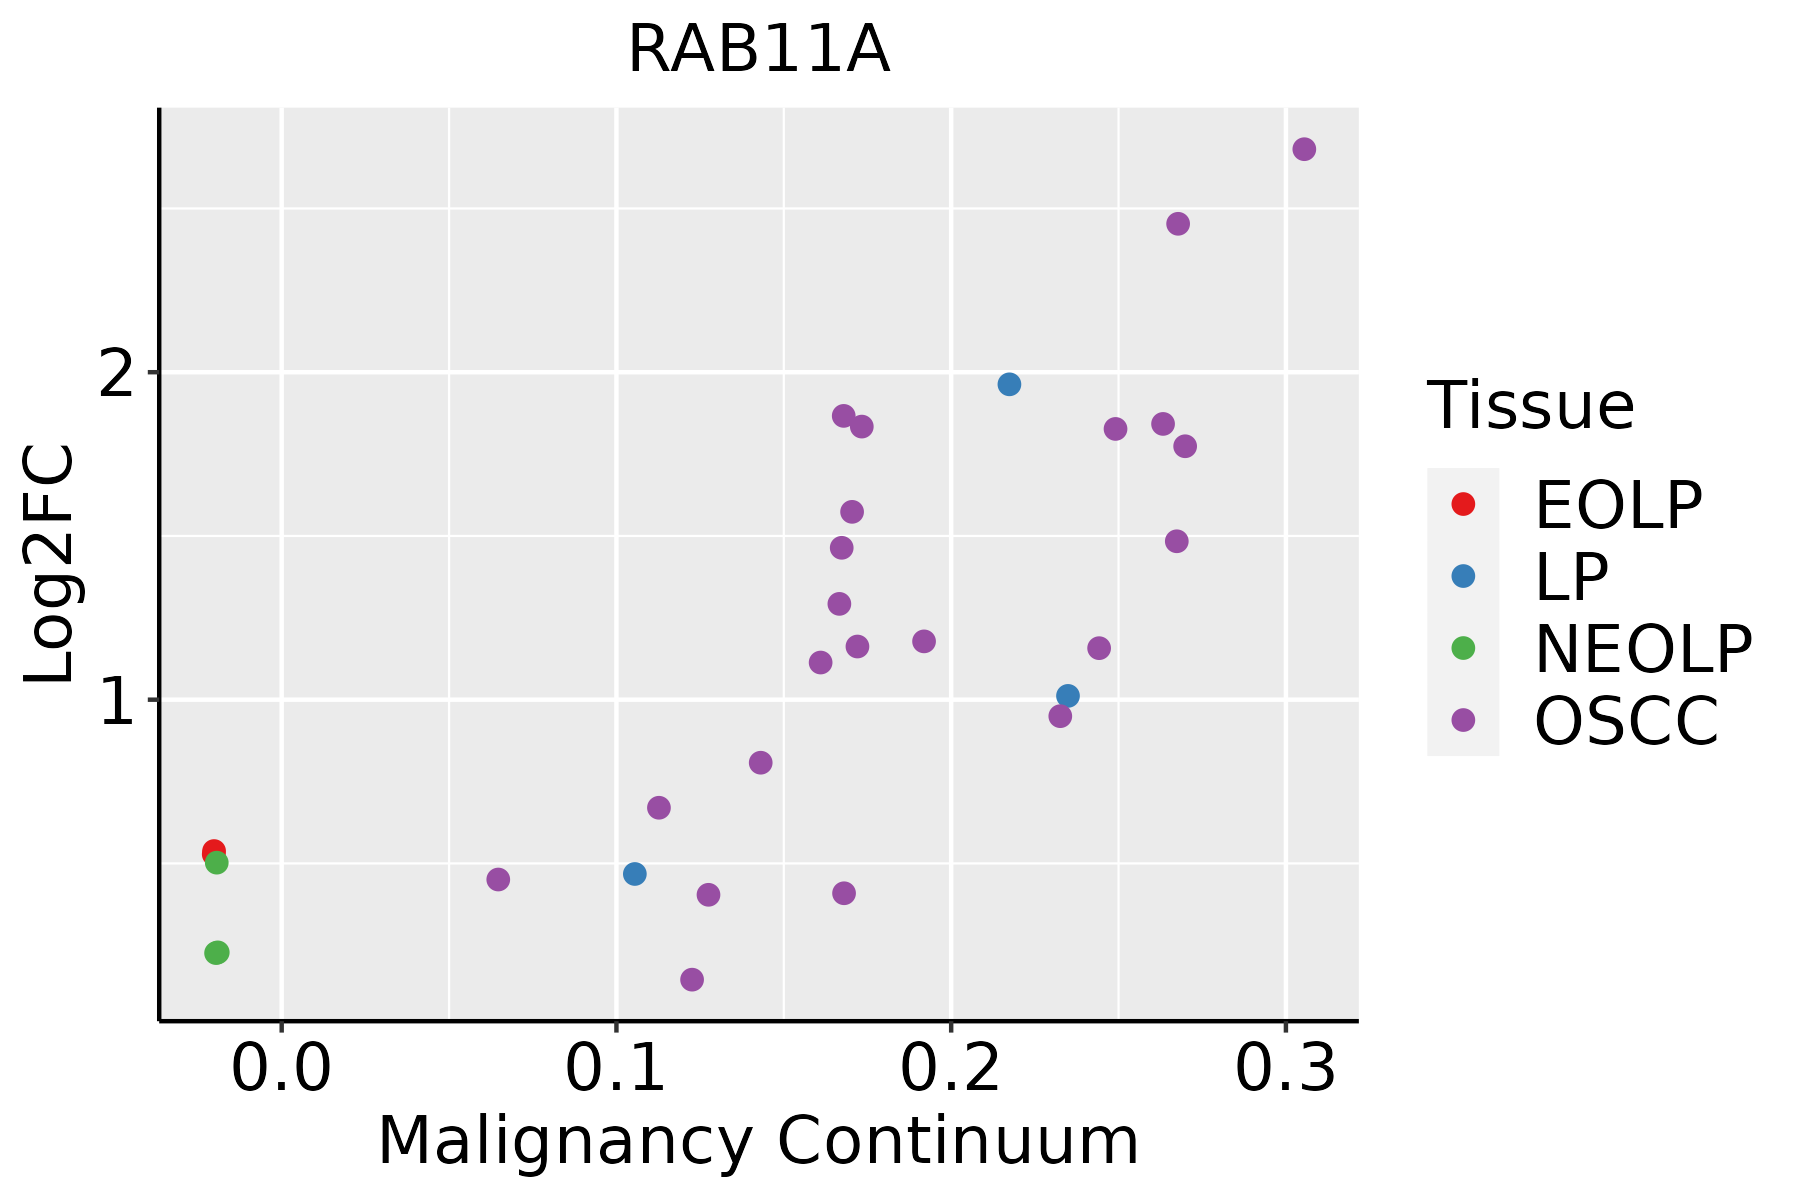 | EOLP: Erosive Oral lichen planus |
| LP: leukoplakia | ||
| NEOLP: Non-erosive oral lichen planus | ||
| OSCC: Oral squamous cell carcinoma | ||
| Prostate | 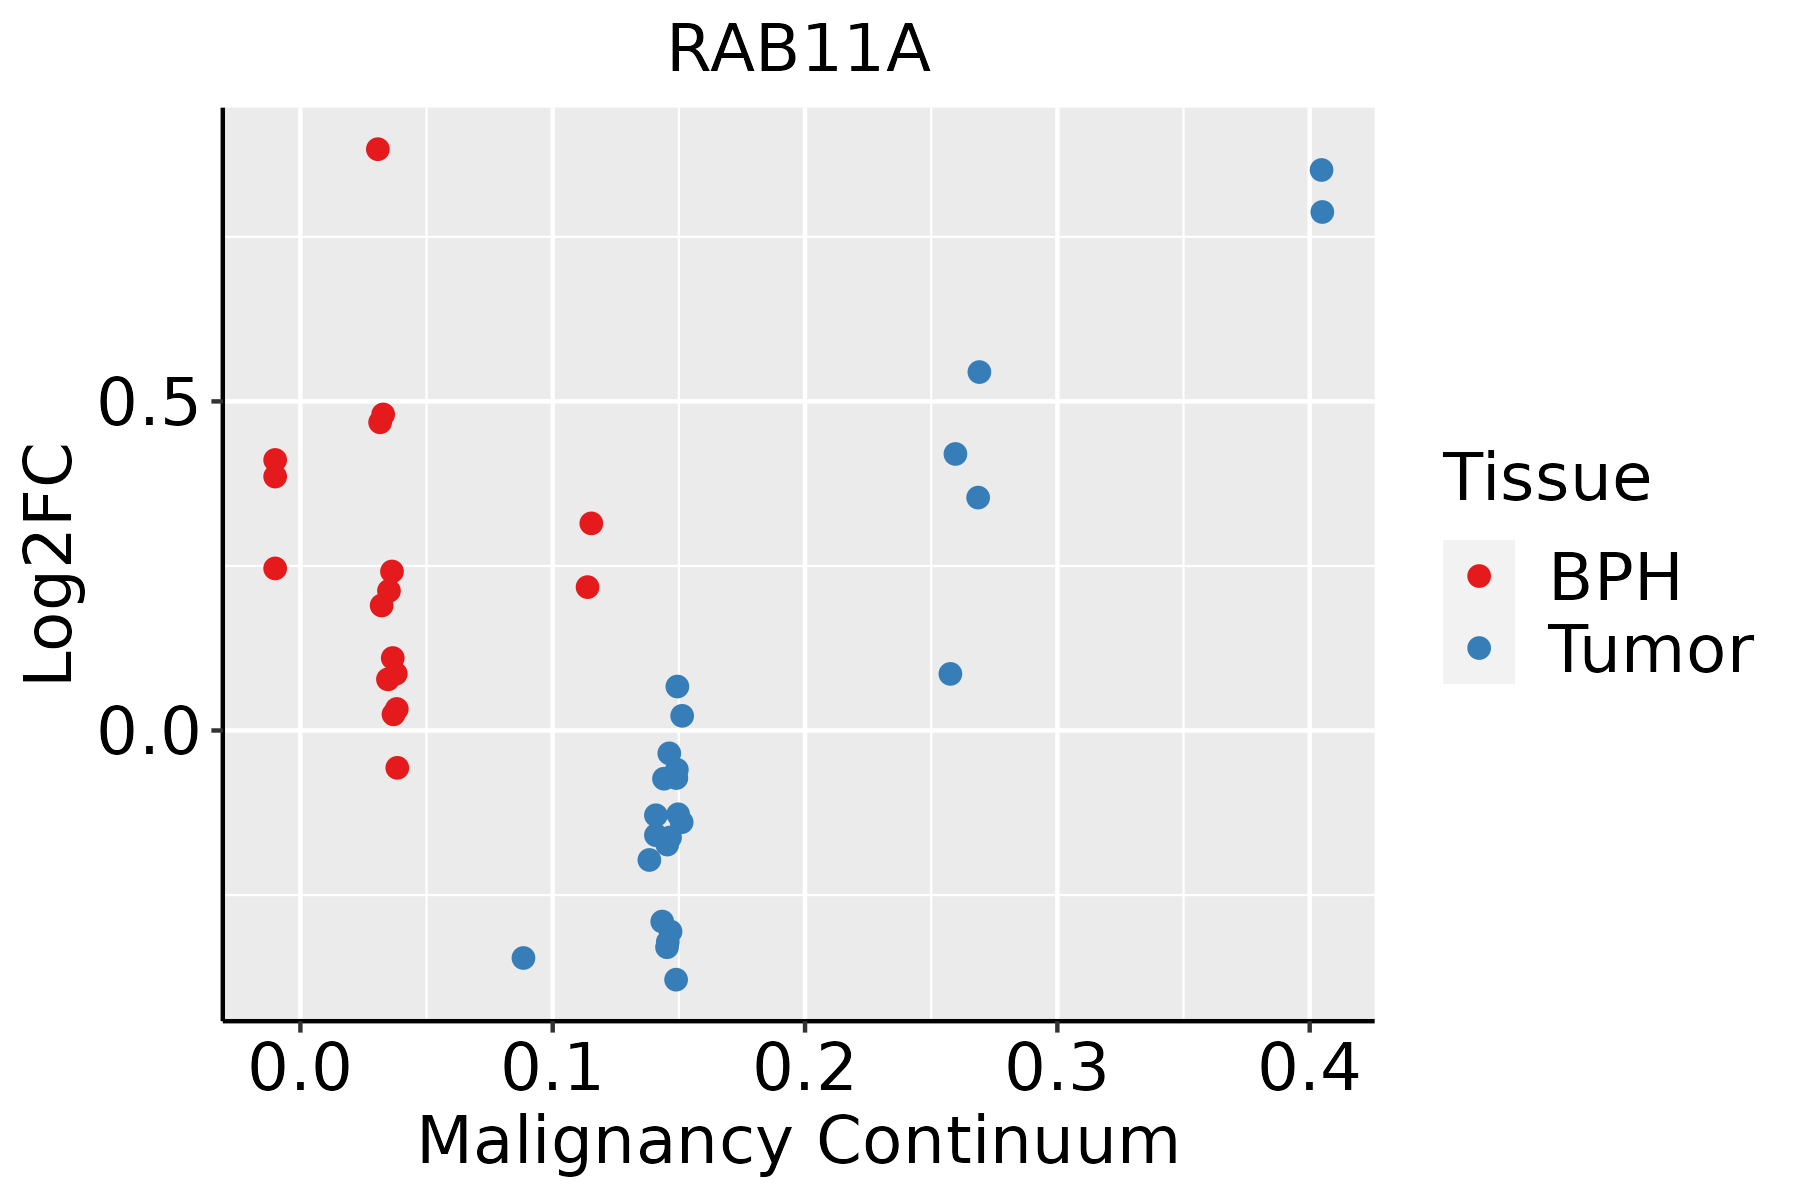 | BPH: Benign Prostatic Hyperplasia |
| Skin | 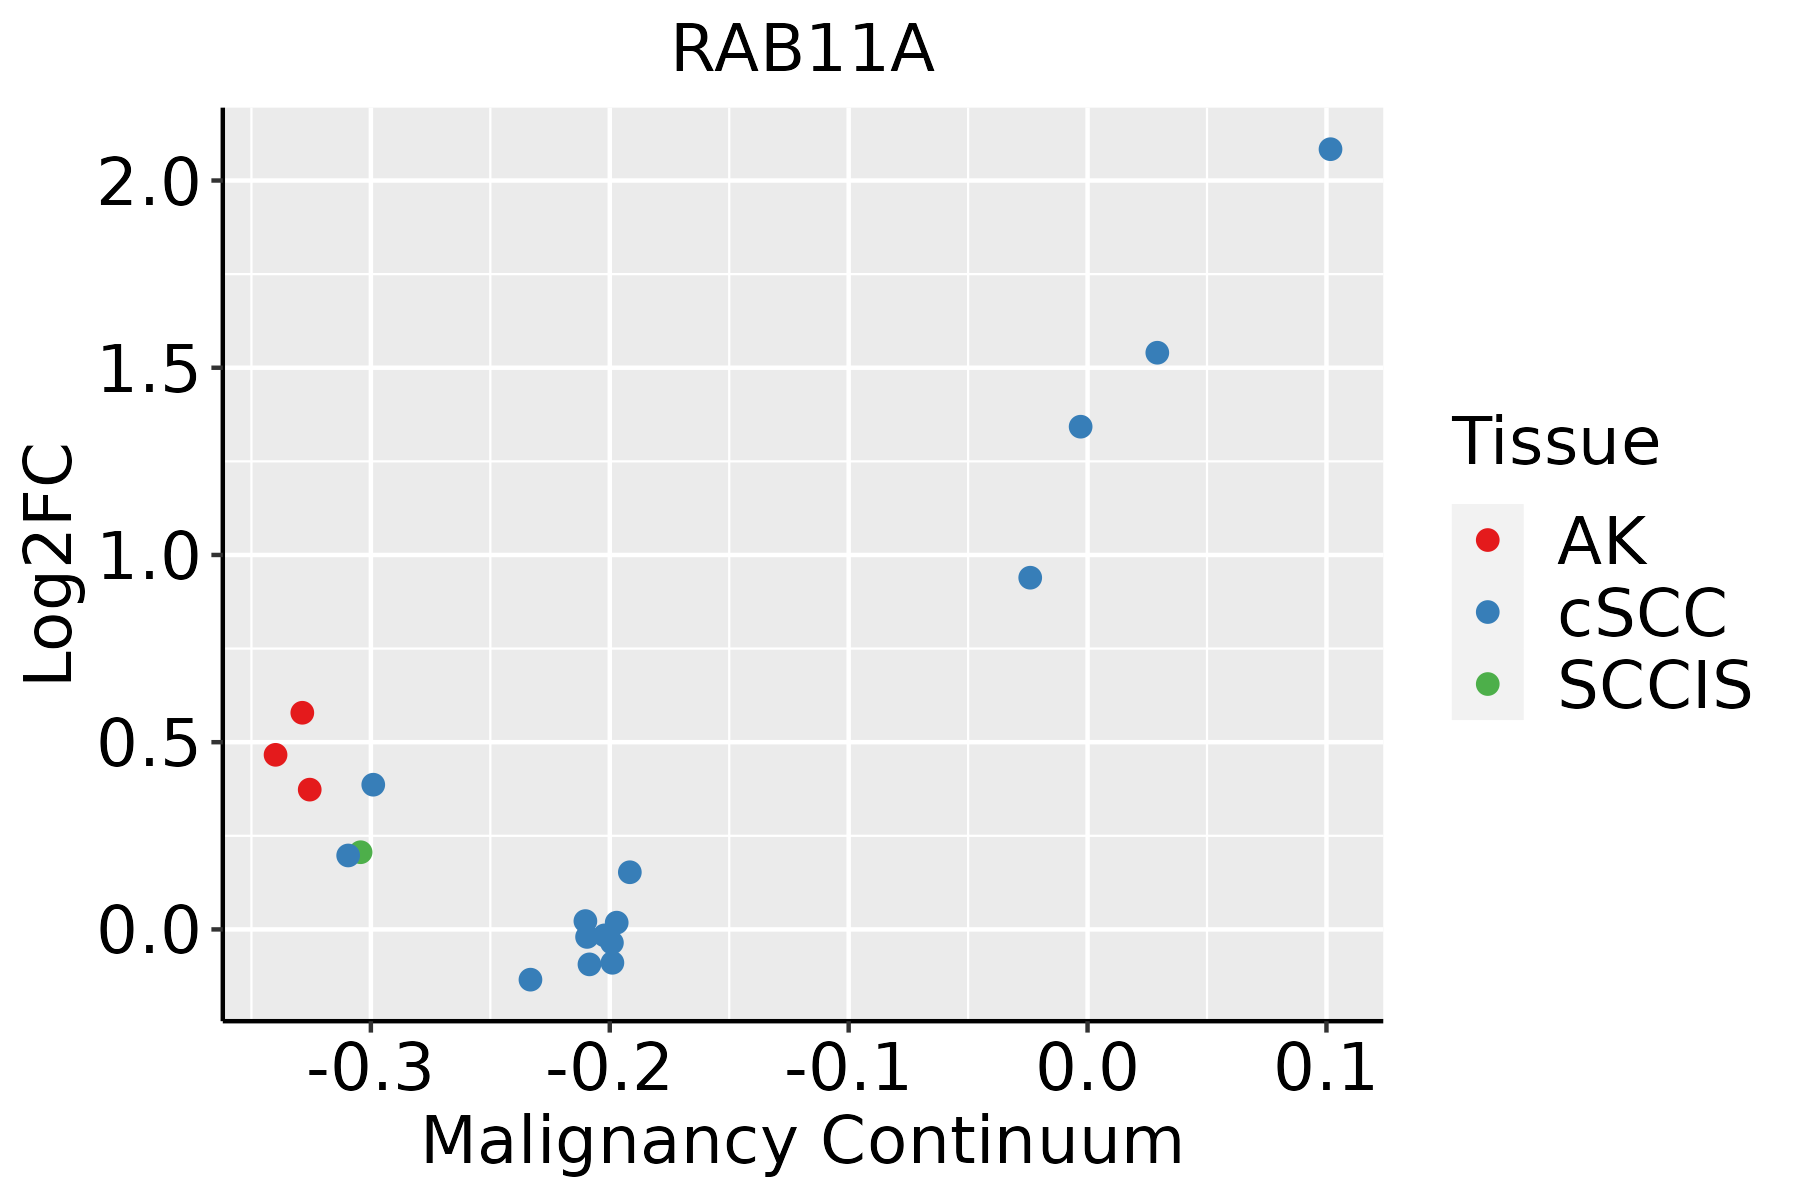 | AK: Actinic keratosis |
| cSCC: Cutaneous squamous cell carcinoma | ||
| SCCIS:squamous cell carcinoma in situ | ||
| Thyroid |  | ATC: Anaplastic thyroid cancer |
| HT: Hashimoto's thyroiditis | ||
| PTC: Papillary thyroid cancer |
| ∗log2FC in expression of this searched gene in stem-like cells from each diseased tissue sample relative to stem-like cells in normal samples in each tissue plotted against the malignancy continuum. Samples are colored based on if they are from different disease stage. |
Top |
Malignant transformation related pathway analysis |
| Find out the enriched GO biological processes and KEGG pathways involved in transition from healthy to precancer to cancer |
| Tissue | Disease Stage | Enriched GO biological Processes |
| Colorectum | AD |  |
| Colorectum | SER |  |
| Colorectum | MSS |  |
| Colorectum | MSI-H |  |
| Colorectum | FAP |  |
| ∗Top 15 enriched GO BP terms are showed in the bar plot of each disease state in each tissue. Each row represents a significant GO biological process which is colored according to the -log10(p.adjust). |
| Page: 1 2 3 4 5 6 7 8 9 |
| GO ID | Tissue | Disease Stage | Description | Gene Ratio | Bg Ratio | pvalue | p.adjust | Count |
| GO:19028507 | Esophagus | HGIN | microtubule cytoskeleton organization involved in mitosis | 36/2587 | 147/18723 | 3.61e-04 | 5.68e-03 | 36 |
| GO:00513033 | Esophagus | HGIN | establishment of chromosome localization | 23/2587 | 80/18723 | 3.71e-04 | 5.77e-03 | 23 |
| GO:001604919 | Esophagus | HGIN | cell growth | 93/2587 | 482/18723 | 4.49e-04 | 6.62e-03 | 93 |
| GO:00070518 | Esophagus | HGIN | spindle organization | 42/2587 | 184/18723 | 6.07e-04 | 8.49e-03 | 42 |
| GO:190547718 | Esophagus | HGIN | positive regulation of protein localization to membrane | 26/2587 | 106/18723 | 2.17e-03 | 2.25e-02 | 26 |
| GO:00070803 | Esophagus | HGIN | mitotic metaphase plate congression | 15/2587 | 50/18723 | 2.35e-03 | 2.39e-02 | 15 |
| GO:00619519 | Esophagus | HGIN | establishment of protein localization to plasma membrane | 17/2587 | 60/18723 | 2.46e-03 | 2.45e-02 | 17 |
| GO:00513103 | Esophagus | HGIN | metaphase plate congression | 18/2587 | 65/18723 | 2.46e-03 | 2.45e-02 | 18 |
| GO:00903077 | Esophagus | HGIN | mitotic spindle assembly | 18/2587 | 65/18723 | 2.46e-03 | 2.45e-02 | 18 |
| GO:004593110 | Esophagus | HGIN | positive regulation of mitotic cell cycle | 28/2587 | 121/18723 | 3.72e-03 | 3.39e-02 | 28 |
| GO:005165010 | Esophagus | HGIN | establishment of vesicle localization | 35/2587 | 161/18723 | 3.89e-03 | 3.54e-02 | 35 |
| GO:00000703 | Esophagus | HGIN | mitotic sister chromatid segregation | 36/2587 | 168/18723 | 4.42e-03 | 3.87e-02 | 36 |
| GO:190437718 | Esophagus | HGIN | positive regulation of protein localization to cell periphery | 18/2587 | 69/18723 | 4.94e-03 | 4.18e-02 | 18 |
| GO:000155818 | Esophagus | HGIN | regulation of cell growth | 76/2587 | 414/18723 | 5.40e-03 | 4.42e-02 | 76 |
| GO:19019876 | Esophagus | HGIN | regulation of cell cycle phase transition | 72/2587 | 390/18723 | 5.78e-03 | 4.70e-02 | 72 |
| GO:005164810 | Esophagus | HGIN | vesicle localization | 37/2587 | 177/18723 | 6.03e-03 | 4.87e-02 | 37 |
| GO:0072594110 | Esophagus | ESCC | establishment of protein localization to organelle | 311/8552 | 422/18723 | 3.02e-32 | 2.13e-29 | 311 |
| GO:014001414 | Esophagus | ESCC | mitotic nuclear division | 218/8552 | 287/18723 | 6.17e-26 | 1.78e-23 | 218 |
| GO:005165617 | Esophagus | ESCC | establishment of organelle localization | 273/8552 | 390/18723 | 9.13e-23 | 1.81e-20 | 273 |
| GO:000007011 | Esophagus | ESCC | mitotic sister chromatid segregation | 138/8552 | 168/18723 | 1.37e-22 | 2.63e-20 | 138 |
| Page: 1 2 3 4 5 6 7 8 9 10 11 12 13 14 15 16 17 18 19 20 21 22 23 24 25 26 27 28 29 30 31 32 33 34 35 36 37 38 39 40 41 42 43 44 45 46 47 48 49 50 51 52 53 54 55 56 57 58 59 60 61 62 63 64 65 66 67 68 69 70 |
| Pathway ID | Tissue | Disease Stage | Description | Gene Ratio | Bg Ratio | pvalue | p.adjust | qvalue | Count |
| hsa0414418 | Cervix | CC | Endocytosis | 64/1267 | 251/8465 | 6.97e-06 | 6.10e-05 | 3.61e-05 | 64 |
| hsa0516414 | Cervix | CC | Influenza A | 43/1267 | 171/8465 | 3.03e-04 | 1.64e-03 | 9.68e-04 | 43 |
| hsa0414419 | Cervix | CC | Endocytosis | 64/1267 | 251/8465 | 6.97e-06 | 6.10e-05 | 3.61e-05 | 64 |
| hsa0516415 | Cervix | CC | Influenza A | 43/1267 | 171/8465 | 3.03e-04 | 1.64e-03 | 9.68e-04 | 43 |
| hsa0516441 | Cervix | N_HPV | Influenza A | 16/349 | 171/8465 | 1.81e-03 | 1.12e-02 | 8.75e-03 | 16 |
| hsa0516451 | Cervix | N_HPV | Influenza A | 16/349 | 171/8465 | 1.81e-03 | 1.12e-02 | 8.75e-03 | 16 |
| hsa04144 | Colorectum | AD | Endocytosis | 111/2092 | 251/8465 | 5.95e-12 | 1.42e-10 | 9.08e-11 | 111 |
| hsa04961 | Colorectum | AD | Endocrine and other factor-regulated calcium reabsorption | 24/2092 | 53/8465 | 8.49e-04 | 5.93e-03 | 3.78e-03 | 24 |
| hsa04972 | Colorectum | AD | Pancreatic secretion | 36/2092 | 102/8465 | 1.06e-02 | 3.98e-02 | 2.54e-02 | 36 |
| hsa041441 | Colorectum | AD | Endocytosis | 111/2092 | 251/8465 | 5.95e-12 | 1.42e-10 | 9.08e-11 | 111 |
| hsa049611 | Colorectum | AD | Endocrine and other factor-regulated calcium reabsorption | 24/2092 | 53/8465 | 8.49e-04 | 5.93e-03 | 3.78e-03 | 24 |
| hsa049721 | Colorectum | AD | Pancreatic secretion | 36/2092 | 102/8465 | 1.06e-02 | 3.98e-02 | 2.54e-02 | 36 |
| hsa049724 | Colorectum | MSS | Pancreatic secretion | 33/1875 | 102/8465 | 1.09e-02 | 3.75e-02 | 2.30e-02 | 33 |
| hsa049725 | Colorectum | MSS | Pancreatic secretion | 33/1875 | 102/8465 | 1.09e-02 | 3.75e-02 | 2.30e-02 | 33 |
| hsa041446 | Colorectum | FAP | Endocytosis | 78/1404 | 251/8465 | 6.20e-09 | 2.96e-07 | 1.80e-07 | 78 |
| hsa049726 | Colorectum | FAP | Pancreatic secretion | 34/1404 | 102/8465 | 2.43e-05 | 2.78e-04 | 1.69e-04 | 34 |
| hsa049616 | Colorectum | FAP | Endocrine and other factor-regulated calcium reabsorption | 18/1404 | 53/8465 | 1.52e-03 | 7.94e-03 | 4.83e-03 | 18 |
| hsa041447 | Colorectum | FAP | Endocytosis | 78/1404 | 251/8465 | 6.20e-09 | 2.96e-07 | 1.80e-07 | 78 |
| hsa049727 | Colorectum | FAP | Pancreatic secretion | 34/1404 | 102/8465 | 2.43e-05 | 2.78e-04 | 1.69e-04 | 34 |
| hsa049617 | Colorectum | FAP | Endocrine and other factor-regulated calcium reabsorption | 18/1404 | 53/8465 | 1.52e-03 | 7.94e-03 | 4.83e-03 | 18 |
| Page: 1 2 3 4 5 |
Top |
Cell-cell communication analysis |
| Identification of potential cell-cell interactions between two cell types and their ligand-receptor pairs for different disease states |
| Ligand | Receptor | LRpair | Pathway | Tissue | Disease Stage |
| Page: 1 |
Top |
Single-cell gene regulatory network inference analysis |
| Find out the significant the regulons (TFs) and the target genes of each regulon across cell types for different disease states |
| TF | Cell Type | Tissue | Disease Stage | Target Gene | RSS | Regulon Activity |
| ∗The dot plots of a searched regulon are shown for all cell subpopulations in each disease state of each tissue based on the regulon specific score inferred using pySCENIC and by calculating the average expression. |
| Page: 1 |
Top |
Somatic mutation of malignant transformation related genes |
| Annotation of somatic variants for genes involved in malignant transformation |
| Hugo Symbol | Variant Class | Variant Classification | dbSNP RS | HGVSc | HGVSp | HGVSp Short | SWISSPROT | BIOTYPE | SIFT | PolyPhen | Tumor Sample Barcode | Tissue | Histology | Sex | Age | Stage | Therapy Types | Drugs | Outcome |
| RAB11A | SNV | Missense_Mutation | novel | c.189G>C | p.Gln63His | p.Q63H | P62491 | protein_coding | deleterious_low_confidence(0) | probably_damaging(0.999) | TCGA-AO-A0J4-01 | Breast | breast invasive carcinoma | Female | <65 | I/II | Chemotherapy | doxorubicin | SD |
| RAB11A | SNV | Missense_Mutation | c.31C>T | p.Leu11Phe | p.L11F | P62491 | protein_coding | deleterious_low_confidence(0.01) | benign(0.105) | TCGA-AQ-A0Y5-01 | Breast | breast invasive carcinoma | Female | >=65 | III/IV | Chemotherapy | cytoxan | SD | |
| RAB11A | SNV | Missense_Mutation | rs759435629 | c.521N>A | p.Arg174His | p.R174H | P62491 | protein_coding | tolerated_low_confidence(0.31) | benign(0.001) | TCGA-A6-6141-01 | Colorectum | colon adenocarcinoma | Male | <65 | I/II | Chemotherapy | 5-fu | SD |
| RAB11A | SNV | Missense_Mutation | novel | c.158N>C | p.Ile53Thr | p.I53T | P62491 | protein_coding | deleterious_low_confidence(0.02) | possibly_damaging(0.519) | TCGA-CA-6717-01 | Colorectum | colon adenocarcinoma | Male | <65 | I/II | Chemotherapy | oxaliplatin | CR |
| RAB11A | SNV | Missense_Mutation | novel | c.382N>G | p.Leu128Val | p.L128V | P62491 | protein_coding | deleterious_low_confidence(0) | possibly_damaging(0.822) | TCGA-AG-3887-01 | Colorectum | rectum adenocarcinoma | Male | >=65 | I/II | Chemotherapy | irinotecan | SD |
| RAB11A | SNV | Missense_Mutation | novel | c.86C>A | p.Ser29Tyr | p.S29Y | P62491 | protein_coding | deleterious_low_confidence(0) | possibly_damaging(0.711) | TCGA-A5-A2K5-01 | Endometrium | uterine corpus endometrioid carcinoma | Female | >=65 | I/II | Unknown | Unknown | SD |
| RAB11A | SNV | Missense_Mutation | novel | c.461N>T | p.Ser154Leu | p.S154L | P62491 | protein_coding | deleterious_low_confidence(0.01) | probably_damaging(0.994) | TCGA-AJ-A3EL-01 | Endometrium | uterine corpus endometrioid carcinoma | Female | <65 | I/II | Unknown | Unknown | SD |
| RAB11A | SNV | Missense_Mutation | novel | c.221G>A | p.Arg74Gln | p.R74Q | P62491 | protein_coding | deleterious_low_confidence(0) | possibly_damaging(0.827) | TCGA-AP-A0LM-01 | Endometrium | uterine corpus endometrioid carcinoma | Female | <65 | III/IV | Chemotherapy | cisplatin | SD |
| RAB11A | SNV | Missense_Mutation | c.386G>A | p.Arg129His | p.R129H | P62491 | protein_coding | deleterious_low_confidence(0.02) | benign(0.025) | TCGA-AP-A0LM-01 | Endometrium | uterine corpus endometrioid carcinoma | Female | <65 | III/IV | Chemotherapy | cisplatin | SD | |
| RAB11A | SNV | Missense_Mutation | novel | c.70N>C | p.Lys24Gln | p.K24Q | P62491 | protein_coding | deleterious_low_confidence(0) | probably_damaging(0.998) | TCGA-AP-A1DV-01 | Endometrium | uterine corpus endometrioid carcinoma | Female | <65 | I/II | Unknown | Unknown | SD |
| Page: 1 2 3 |
Top |
Related drugs of malignant transformation related genes |
| Identification of chemicals and drugs interact with genes involved in malignant transfromation |
| (DGIdb 4.0) |
| Entrez ID | Symbol | Category | Interaction Types | Drug Claim Name | Drug Name | PMIDs |
| Page: 1 |

Copyright 2023-Present -The University of Texas Health Science Center at Houston |