| Tissue | Expression Dynamics | Abbreviation |
| Colorectum (GSE201348) |  | FAP: Familial adenomatous polyposis |
| CRC: Colorectal cancer |
| Colorectum (HTA11) |  | AD: Adenomas |
| SER: Sessile serrated lesions |
| MSI-H: Microsatellite-high colorectal cancer |
| MSS: Microsatellite stable colorectal cancer |
| Endometrium | 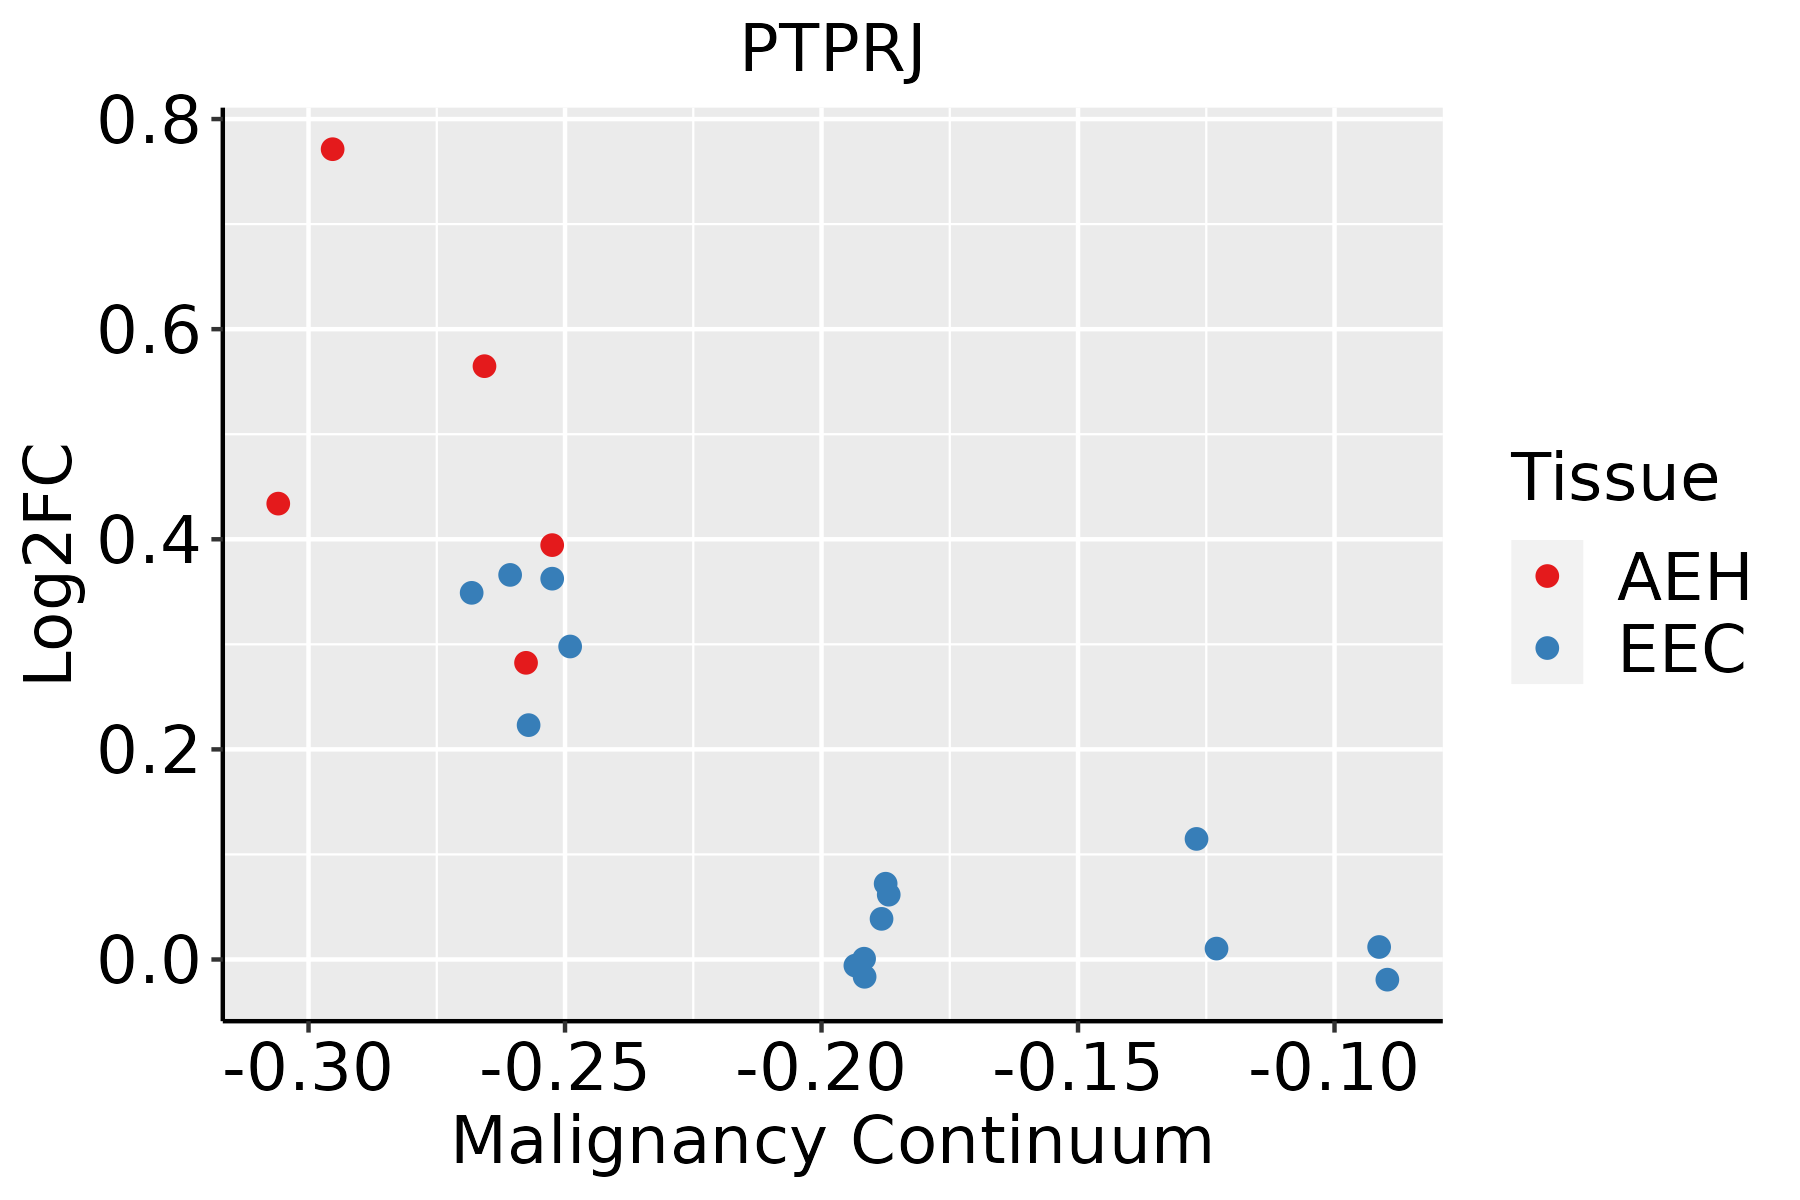 | AEH: Atypical endometrial hyperplasia |
| EEC: Endometrioid Cancer |
| GC |  | CAG: Chronic atrophic gastritis |
| CAG with IM: Chronic atrophic gastritis with intestinal metaplasia |
| CSG: Chronic superficial gastritis |
| GC: Gastric cancer |
| SIM: Severe intestinal metaplasia |
| WIM: Wild intestinal metaplasia |
| Liver |  | HCC: Hepatocellular carcinoma |
| NAFLD: Non-alcoholic fatty liver disease |
| Lung | 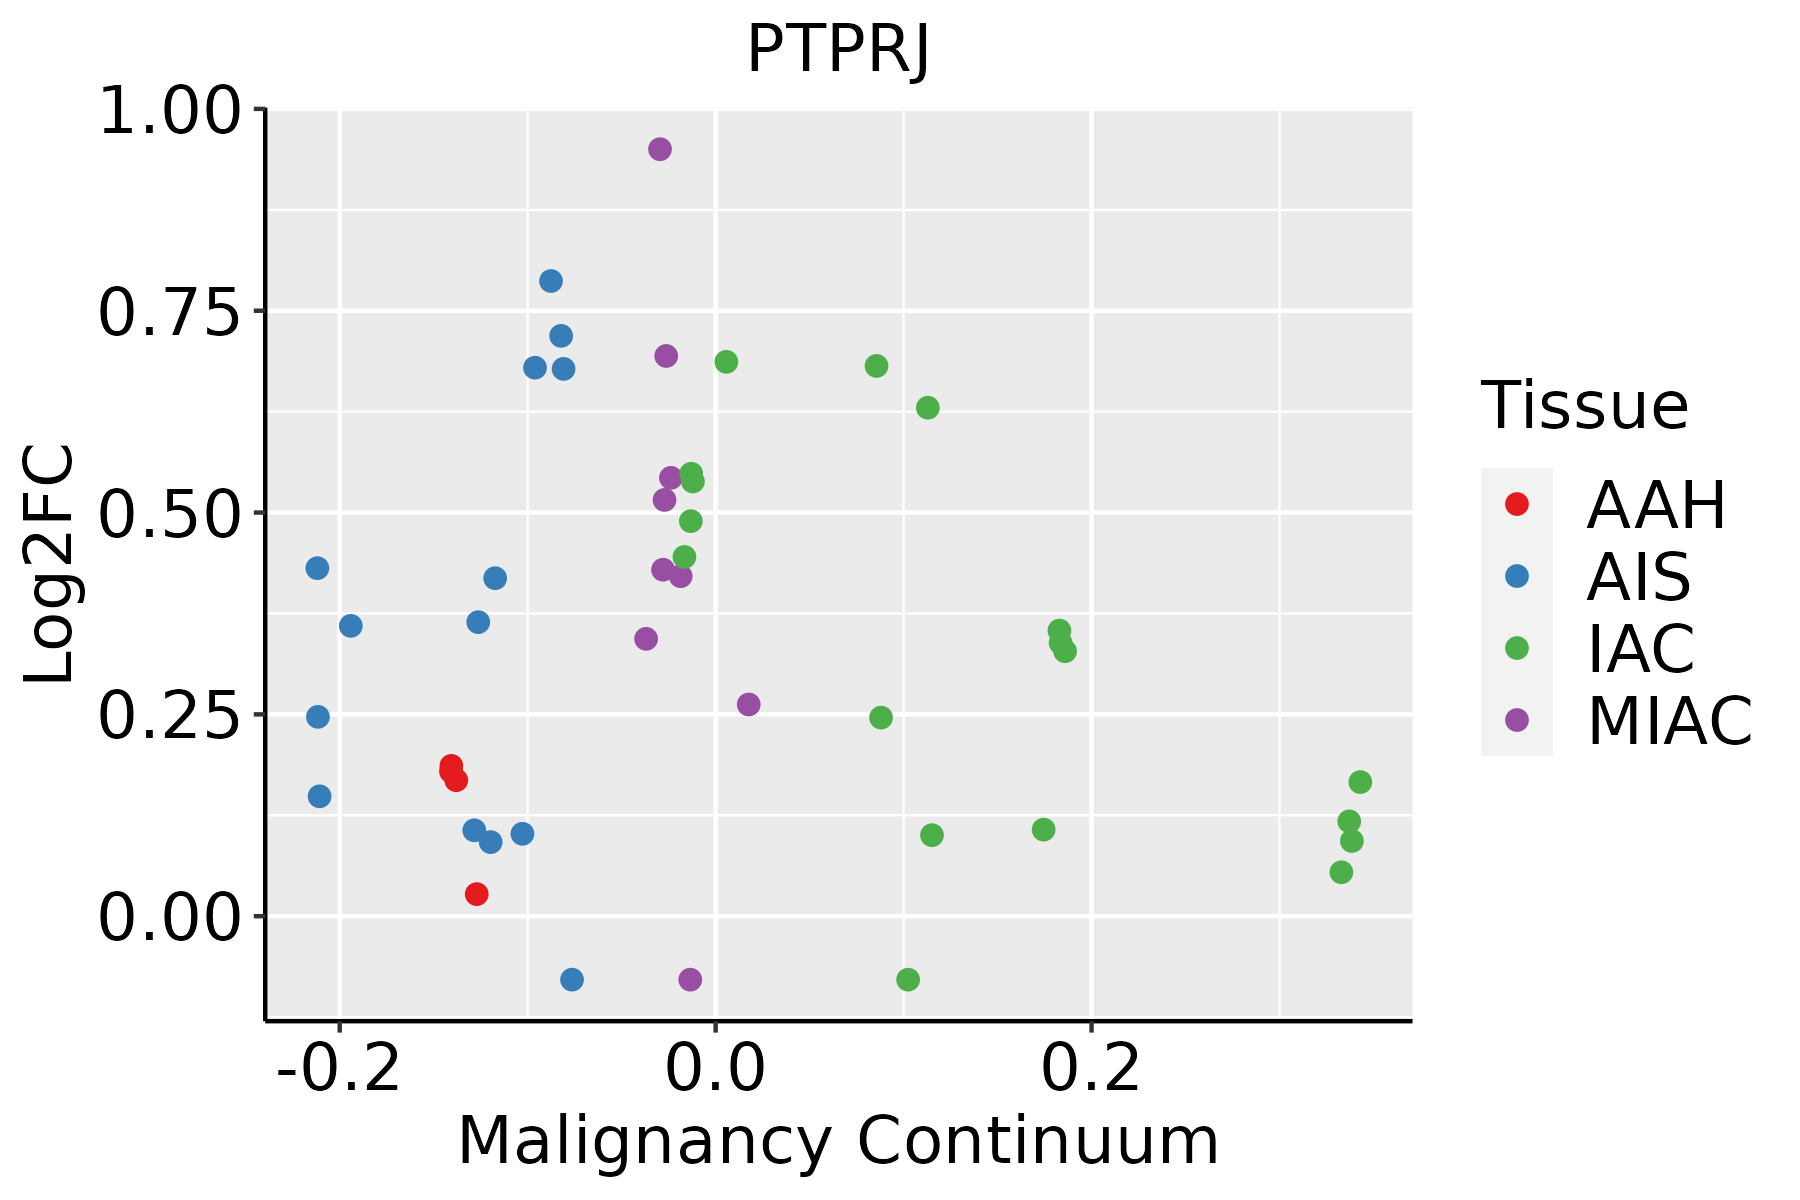 | AAH: Atypical adenomatous hyperplasia |
| AIS: Adenocarcinoma in situ |
| IAC: Invasive lung adenocarcinoma |
| MIA: Minimally invasive adenocarcinoma |
| Prostate | 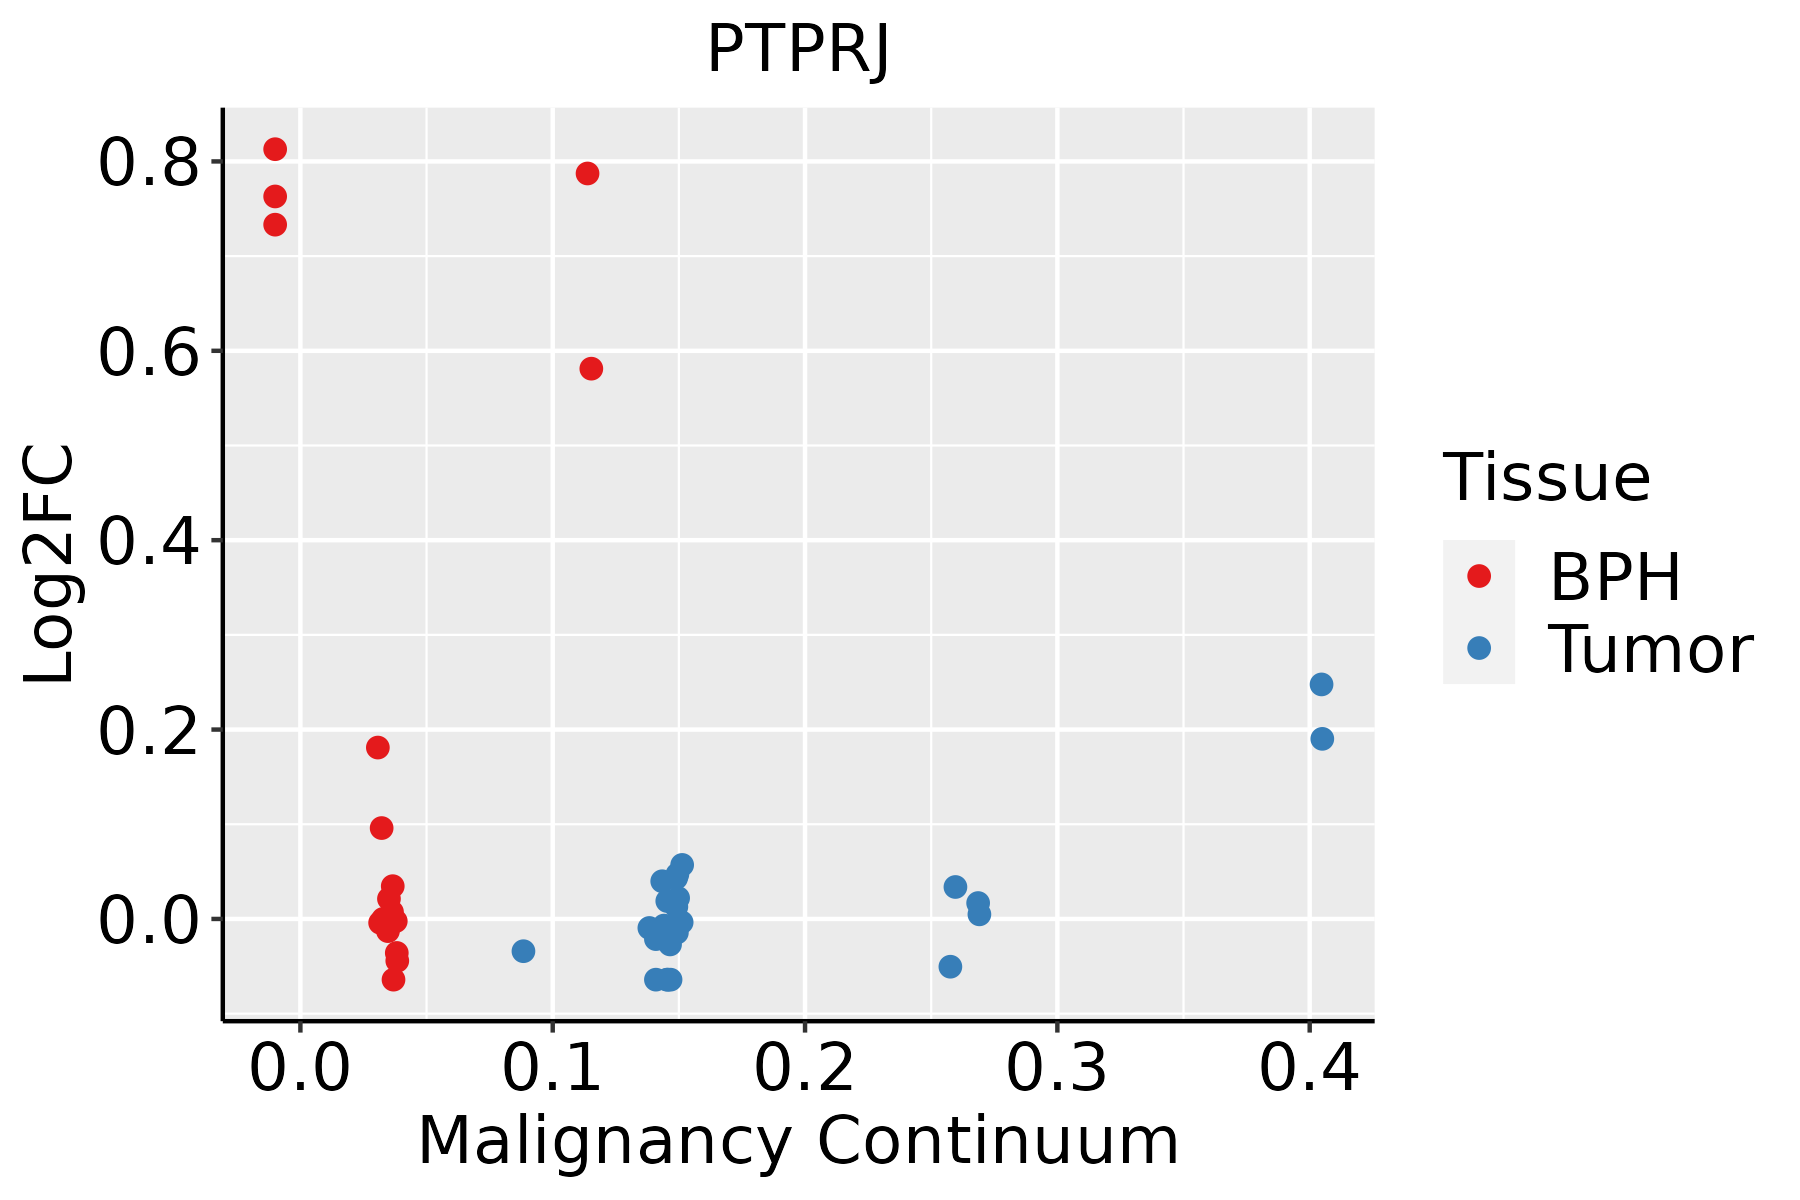 | BPH: Benign Prostatic Hyperplasia |
| GO ID | Tissue | Disease Stage | Description | Gene Ratio | Bg Ratio | pvalue | p.adjust | Count |
| GO:004593613 | Lung | AIS | negative regulation of phosphate metabolic process | 75/1849 | 441/18723 | 1.93e-06 | 1.12e-04 | 75 |
| GO:001056313 | Lung | AIS | negative regulation of phosphorus metabolic process | 75/1849 | 442/18723 | 2.11e-06 | 1.20e-04 | 75 |
| GO:001081113 | Lung | AIS | positive regulation of cell-substrate adhesion | 29/1849 | 123/18723 | 6.93e-06 | 3.03e-04 | 29 |
| GO:190188811 | Lung | AIS | regulation of cell junction assembly | 41/1849 | 204/18723 | 7.76e-06 | 3.35e-04 | 41 |
| GO:004232613 | Lung | AIS | negative regulation of phosphorylation | 65/1849 | 385/18723 | 1.17e-05 | 4.69e-04 | 65 |
| GO:001631112 | Lung | AIS | dephosphorylation | 69/1849 | 417/18723 | 1.27e-05 | 4.78e-04 | 69 |
| GO:007190012 | Lung | AIS | regulation of protein serine/threonine kinase activity | 61/1849 | 359/18723 | 1.76e-05 | 6.17e-04 | 61 |
| GO:004205811 | Lung | AIS | regulation of epidermal growth factor receptor signaling pathway | 20/1849 | 73/18723 | 1.77e-05 | 6.17e-04 | 20 |
| GO:000193313 | Lung | AIS | negative regulation of protein phosphorylation | 57/1849 | 342/18723 | 5.71e-05 | 1.60e-03 | 57 |
| GO:190118411 | Lung | AIS | regulation of ERBB signaling pathway | 20/1849 | 79/18723 | 6.12e-05 | 1.67e-03 | 20 |
| GO:004800811 | Lung | AIS | platelet-derived growth factor receptor signaling pathway | 16/1849 | 56/18723 | 6.89e-05 | 1.84e-03 | 16 |
| GO:000195412 | Lung | AIS | positive regulation of cell-matrix adhesion | 16/1849 | 58/18723 | 1.09e-04 | 2.57e-03 | 16 |
| GO:190118512 | Lung | AIS | negative regulation of ERBB signaling pathway | 11/1849 | 32/18723 | 1.53e-04 | 3.26e-03 | 11 |
| GO:00434101 | Lung | AIS | positive regulation of MAPK cascade | 72/1849 | 480/18723 | 2.11e-04 | 4.32e-03 | 72 |
| GO:004205913 | Lung | AIS | negative regulation of epidermal growth factor receptor signaling pathway | 10/1849 | 28/18723 | 2.13e-04 | 4.35e-03 | 10 |
| GO:00353351 | Lung | AIS | peptidyl-tyrosine dephosphorylation | 21/1849 | 97/18723 | 4.32e-04 | 7.38e-03 | 21 |
| GO:005134813 | Lung | AIS | negative regulation of transferase activity | 44/1849 | 268/18723 | 5.28e-04 | 8.43e-03 | 44 |
| GO:004340511 | Lung | AIS | regulation of MAP kinase activity | 32/1849 | 177/18723 | 5.53e-04 | 8.71e-03 | 32 |
| GO:000155812 | Lung | AIS | regulation of cell growth | 62/1849 | 414/18723 | 5.85e-04 | 9.03e-03 | 62 |
| GO:005189411 | Lung | AIS | positive regulation of focal adhesion assembly | 9/1849 | 28/18723 | 1.06e-03 | 1.38e-02 | 9 |
| Pathway ID | Tissue | Disease Stage | Description | Gene Ratio | Bg Ratio | pvalue | p.adjust | qvalue | Count |
| hsa05208 | Colorectum | AD | Chemical carcinogenesis - reactive oxygen species | 126/2092 | 223/8465 | 1.01e-24 | 1.68e-22 | 1.07e-22 | 126 |
| hsa04520 | Colorectum | AD | Adherens junction | 50/2092 | 93/8465 | 1.52e-09 | 2.83e-08 | 1.81e-08 | 50 |
| hsa052081 | Colorectum | AD | Chemical carcinogenesis - reactive oxygen species | 126/2092 | 223/8465 | 1.01e-24 | 1.68e-22 | 1.07e-22 | 126 |
| hsa045201 | Colorectum | AD | Adherens junction | 50/2092 | 93/8465 | 1.52e-09 | 2.83e-08 | 1.81e-08 | 50 |
| hsa045208 | Colorectum | FAP | Adherens junction | 45/1404 | 93/8465 | 8.66e-13 | 2.89e-10 | 1.76e-10 | 45 |
| hsa052088 | Colorectum | FAP | Chemical carcinogenesis - reactive oxygen species | 78/1404 | 223/8465 | 1.08e-11 | 1.80e-09 | 1.09e-09 | 78 |
| hsa045209 | Colorectum | FAP | Adherens junction | 45/1404 | 93/8465 | 8.66e-13 | 2.89e-10 | 1.76e-10 | 45 |
| hsa052089 | Colorectum | FAP | Chemical carcinogenesis - reactive oxygen species | 78/1404 | 223/8465 | 1.08e-11 | 1.80e-09 | 1.09e-09 | 78 |
| hsa0452010 | Colorectum | CRC | Adherens junction | 37/1091 | 93/8465 | 5.72e-11 | 6.37e-09 | 4.32e-09 | 37 |
| hsa0520810 | Colorectum | CRC | Chemical carcinogenesis - reactive oxygen species | 43/1091 | 223/8465 | 3.96e-03 | 2.36e-02 | 1.60e-02 | 43 |
| hsa0452011 | Colorectum | CRC | Adherens junction | 37/1091 | 93/8465 | 5.72e-11 | 6.37e-09 | 4.32e-09 | 37 |
| hsa0520811 | Colorectum | CRC | Chemical carcinogenesis - reactive oxygen species | 43/1091 | 223/8465 | 3.96e-03 | 2.36e-02 | 1.60e-02 | 43 |
| hsa0520826 | Endometrium | AEH | Chemical carcinogenesis - reactive oxygen species | 91/1197 | 223/8465 | 3.28e-23 | 1.33e-21 | 9.76e-22 | 91 |
| hsa0452025 | Endometrium | AEH | Adherens junction | 36/1197 | 93/8465 | 3.49e-09 | 5.98e-08 | 4.37e-08 | 36 |
| hsa05208112 | Endometrium | AEH | Chemical carcinogenesis - reactive oxygen species | 91/1197 | 223/8465 | 3.28e-23 | 1.33e-21 | 9.76e-22 | 91 |
| hsa04520111 | Endometrium | AEH | Adherens junction | 36/1197 | 93/8465 | 3.49e-09 | 5.98e-08 | 4.37e-08 | 36 |
| hsa0520827 | Endometrium | EEC | Chemical carcinogenesis - reactive oxygen species | 94/1237 | 223/8465 | 4.11e-24 | 1.93e-22 | 1.44e-22 | 94 |
| hsa0452026 | Endometrium | EEC | Adherens junction | 36/1237 | 93/8465 | 8.57e-09 | 1.48e-07 | 1.11e-07 | 36 |
| hsa0520836 | Endometrium | EEC | Chemical carcinogenesis - reactive oxygen species | 94/1237 | 223/8465 | 4.11e-24 | 1.93e-22 | 1.44e-22 | 94 |
| hsa0452035 | Endometrium | EEC | Adherens junction | 36/1237 | 93/8465 | 8.57e-09 | 1.48e-07 | 1.11e-07 | 36 |
| Hugo Symbol | Variant Class | Variant Classification | dbSNP RS | HGVSc | HGVSp | HGVSp Short | SWISSPROT | BIOTYPE | SIFT | PolyPhen | Tumor Sample Barcode | Tissue | Histology | Sex | Age | Stage | Therapy Types | Drugs | Outcome |
| PTPRJ | SNV | Missense_Mutation | | c.3227N>T | p.Pro1076Leu | p.P1076L | Q12913 | protein_coding | deleterious(0) | probably_damaging(0.999) | TCGA-AQ-A04J-01 | Breast | breast invasive carcinoma | Female | <65 | I/II | Chemotherapy | cytoxan | SD |
| PTPRJ | SNV | Missense_Mutation | novel | c.959C>T | p.Ser320Phe | p.S320F | Q12913 | protein_coding | deleterious(0.02) | benign(0.156) | TCGA-BH-A42V-01 | Breast | breast invasive carcinoma | Female | <65 | I/II | Unknown | Unknown | SD |
| PTPRJ | SNV | Missense_Mutation | | c.2453N>G | p.Pro818Arg | p.P818R | Q12913 | protein_coding | tolerated(0.08) | benign(0.011) | TCGA-C8-A12M-01 | Breast | breast invasive carcinoma | Female | >=65 | I/II | Unknown | Unknown | SD |
| PTPRJ | SNV | Missense_Mutation | | c.2854N>A | p.Glu952Lys | p.E952K | Q12913 | protein_coding | tolerated(0.14) | benign(0.015) | TCGA-C8-A26Y-01 | Breast | breast invasive carcinoma | Female | >=65 | I/II | Unknown | Unknown | SD |
| PTPRJ | SNV | Missense_Mutation | novel | c.1204N>T | p.His402Tyr | p.H402Y | Q12913 | protein_coding | tolerated(0.16) | benign(0.013) | TCGA-D8-A1XW-01 | Breast | breast invasive carcinoma | Female | <65 | I/II | Chemotherapy | adriamycin+cyclophosphamide | SD |
| PTPRJ | SNV | Missense_Mutation | | c.3209G>A | p.Arg1070His | p.R1070H | Q12913 | protein_coding | deleterious(0) | probably_damaging(0.998) | TCGA-E9-A295-01 | Breast | breast invasive carcinoma | Female | >=65 | I/II | Hormone Therapy | tamoxiphen | SD |
| PTPRJ | insertion | In_Frame_Ins | novel | c.2397_2398insCCTGGCCGG | p.Gly799_Lys800insProGlyArg | p.G799_K800insPGR | Q12913 | protein_coding | | | TCGA-A2-A04Y-01 | Breast | breast invasive carcinoma | Female | <65 | I/II | Chemotherapy | cytoxan | SD |
| PTPRJ | insertion | Frame_Shift_Ins | novel | c.2398_2399insAGTCATTCTGTACAGGTGAGTGT | p.Met801SerfsTer41 | p.M801Sfs*41 | Q12913 | protein_coding | | | TCGA-A2-A04Y-01 | Breast | breast invasive carcinoma | Female | <65 | I/II | Chemotherapy | cytoxan | SD |
| PTPRJ | insertion | In_Frame_Ins | novel | c.461_462insCTCTTC | p.Lys154delinsAsnSerSer | p.K154delinsNSS | Q12913 | protein_coding | | | TCGA-AN-A0FN-01 | Breast | breast invasive carcinoma | Female | <65 | I/II | Unknown | Unknown | SD |
| PTPRJ | insertion | Frame_Shift_Ins | novel | c.462_463insGTTTCTGGTTGTTACTCCTCAGTCTT | p.His155ValfsTer45 | p.H155Vfs*45 | Q12913 | protein_coding | | | TCGA-AN-A0FN-01 | Breast | breast invasive carcinoma | Female | <65 | I/II | Unknown | Unknown | SD |


