
|
|||||
|
 | |
| |
| |
| |
| |
| |
|
Gene: PTPN2 |
Gene summary for PTPN2 |
| Gene information | Species | Human | Gene symbol | PTPN2 | Gene ID | 5771 |
| Gene name | protein tyrosine phosphatase non-receptor type 2 | |
| Gene Alias | PTN2 | |
| Cytomap | 18p11.21 | |
| Gene Type | protein-coding | GO ID | GO:0000122 | UniProtAcc | P17706 |
Top |
Malignant transformation analysis |
| Identification of the aberrant gene expression in precancerous and cancerous lesions by comparing the gene expression of stem-like cells in diseased tissues with normal stem cells |
| Entrez ID | Symbol | Replicates | Species | Organ | Tissue | Adj P-value | Log2FC | Malignancy |
| 5771 | PTPN2 | CA_HPV_1 | Human | Cervix | CC | 3.73e-02 | 1.63e-01 | 0.0264 |
| 5771 | PTPN2 | CCI_1 | Human | Cervix | CC | 9.44e-03 | 6.25e-01 | 0.528 |
| 5771 | PTPN2 | CCI_3 | Human | Cervix | CC | 1.55e-02 | 5.66e-01 | 0.516 |
| 5771 | PTPN2 | LZE2D | Human | Esophagus | HGIN | 1.02e-02 | 2.93e-01 | 0.0642 |
| 5771 | PTPN2 | LZE3D | Human | Esophagus | HGIN | 1.23e-02 | 8.78e-01 | 0.0668 |
| 5771 | PTPN2 | LZE4T | Human | Esophagus | ESCC | 1.79e-11 | 3.85e-01 | 0.0811 |
| 5771 | PTPN2 | LZE5T | Human | Esophagus | ESCC | 2.36e-02 | 4.60e-01 | 0.0514 |
| 5771 | PTPN2 | LZE7T | Human | Esophagus | ESCC | 1.70e-08 | 7.10e-01 | 0.0667 |
| 5771 | PTPN2 | LZE8T | Human | Esophagus | ESCC | 1.57e-08 | 3.58e-01 | 0.067 |
| 5771 | PTPN2 | LZE20T | Human | Esophagus | ESCC | 9.63e-08 | 2.16e-01 | 0.0662 |
| 5771 | PTPN2 | LZE22D1 | Human | Esophagus | HGIN | 1.37e-02 | 1.68e-01 | 0.0595 |
| 5771 | PTPN2 | LZE22T | Human | Esophagus | ESCC | 1.76e-03 | 7.01e-01 | 0.068 |
| 5771 | PTPN2 | LZE24T | Human | Esophagus | ESCC | 3.56e-24 | 8.39e-01 | 0.0596 |
| 5771 | PTPN2 | LZE21T | Human | Esophagus | ESCC | 1.18e-09 | 7.07e-01 | 0.0655 |
| 5771 | PTPN2 | P1T-E | Human | Esophagus | ESCC | 8.38e-08 | 7.06e-01 | 0.0875 |
| 5771 | PTPN2 | P2T-E | Human | Esophagus | ESCC | 7.05e-45 | 1.06e+00 | 0.1177 |
| 5771 | PTPN2 | P4T-E | Human | Esophagus | ESCC | 1.01e-35 | 9.74e-01 | 0.1323 |
| 5771 | PTPN2 | P5T-E | Human | Esophagus | ESCC | 3.79e-53 | 1.19e+00 | 0.1327 |
| 5771 | PTPN2 | P8T-E | Human | Esophagus | ESCC | 7.97e-36 | 7.79e-01 | 0.0889 |
| 5771 | PTPN2 | P9T-E | Human | Esophagus | ESCC | 5.37e-25 | 8.11e-01 | 0.1131 |
| Page: 1 2 3 4 5 6 7 8 |
| Tissue | Expression Dynamics | Abbreviation |
| Cervix | 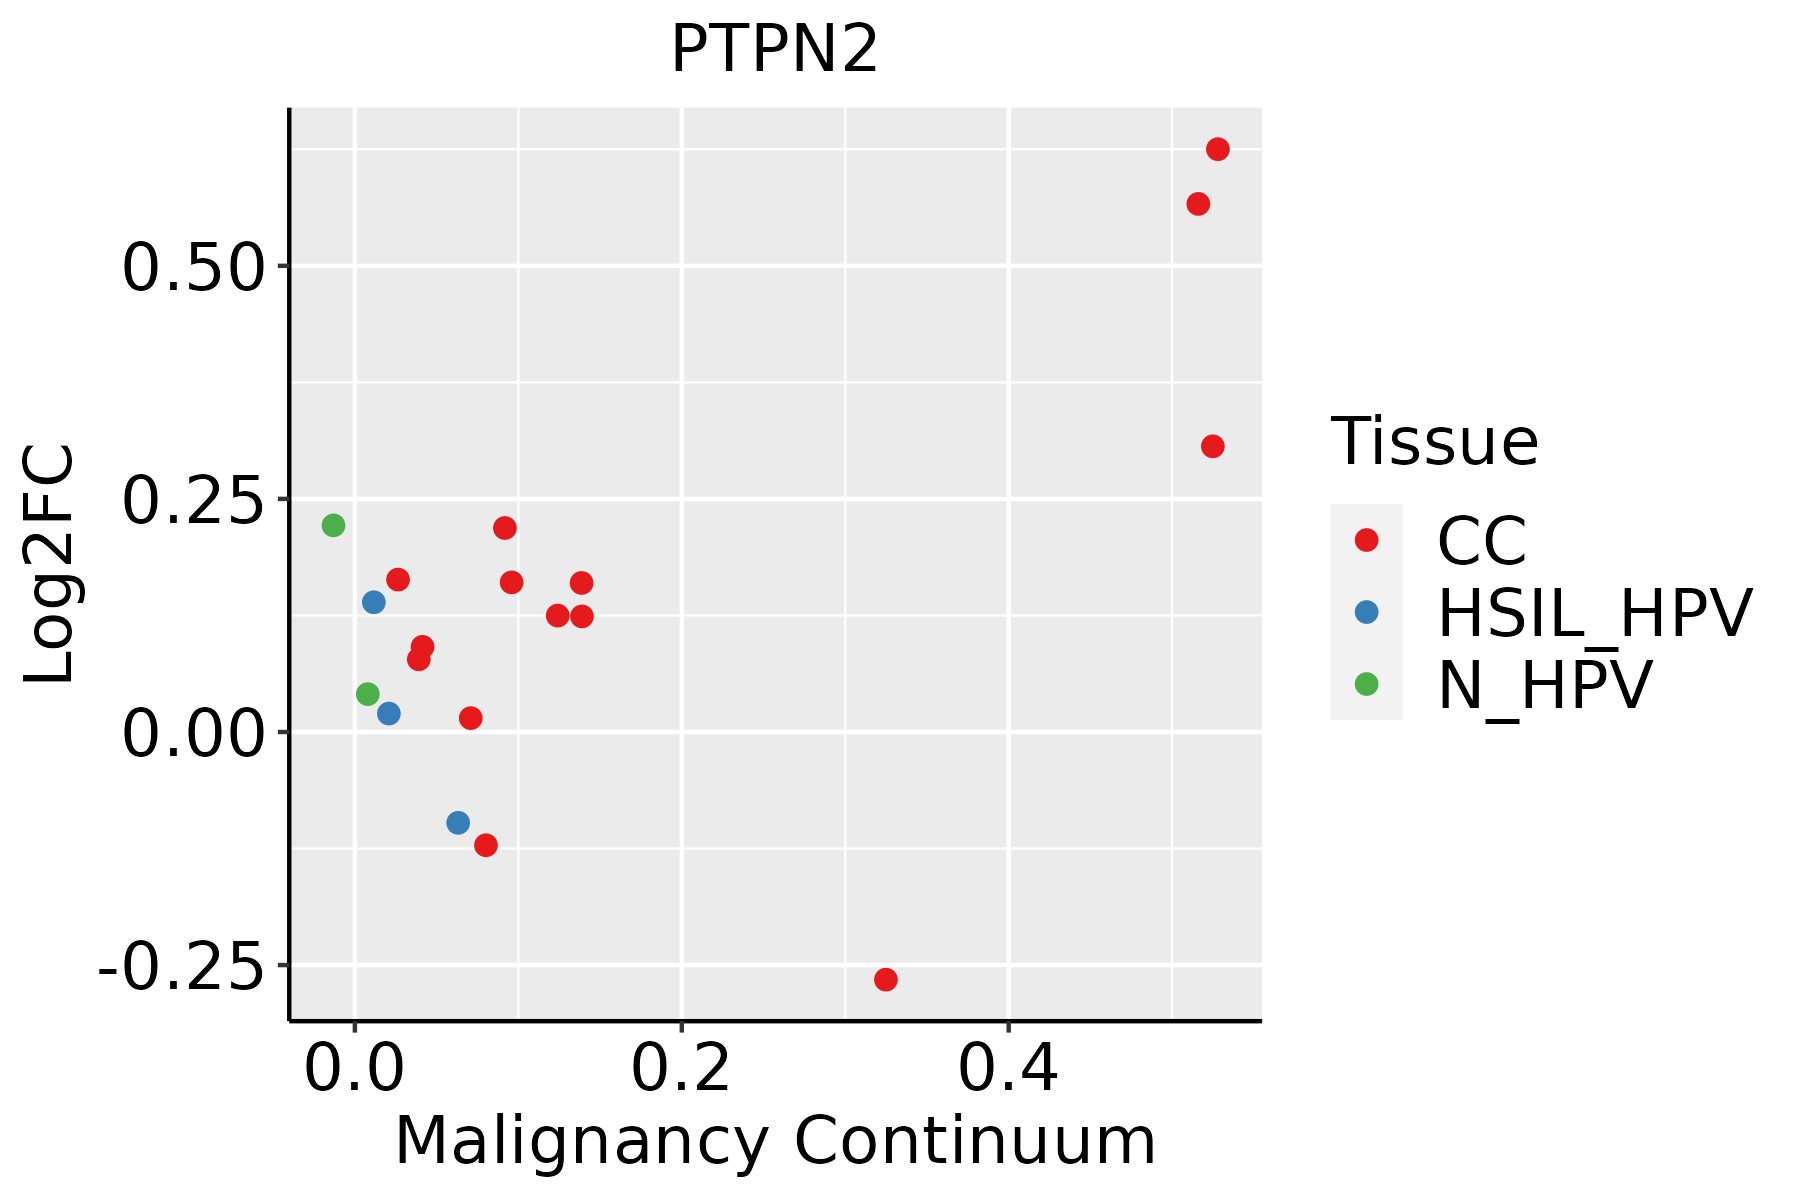 | CC: Cervix cancer |
| HSIL_HPV: HPV-infected high-grade squamous intraepithelial lesions | ||
| N_HPV: HPV-infected normal cervix | ||
| Esophagus | 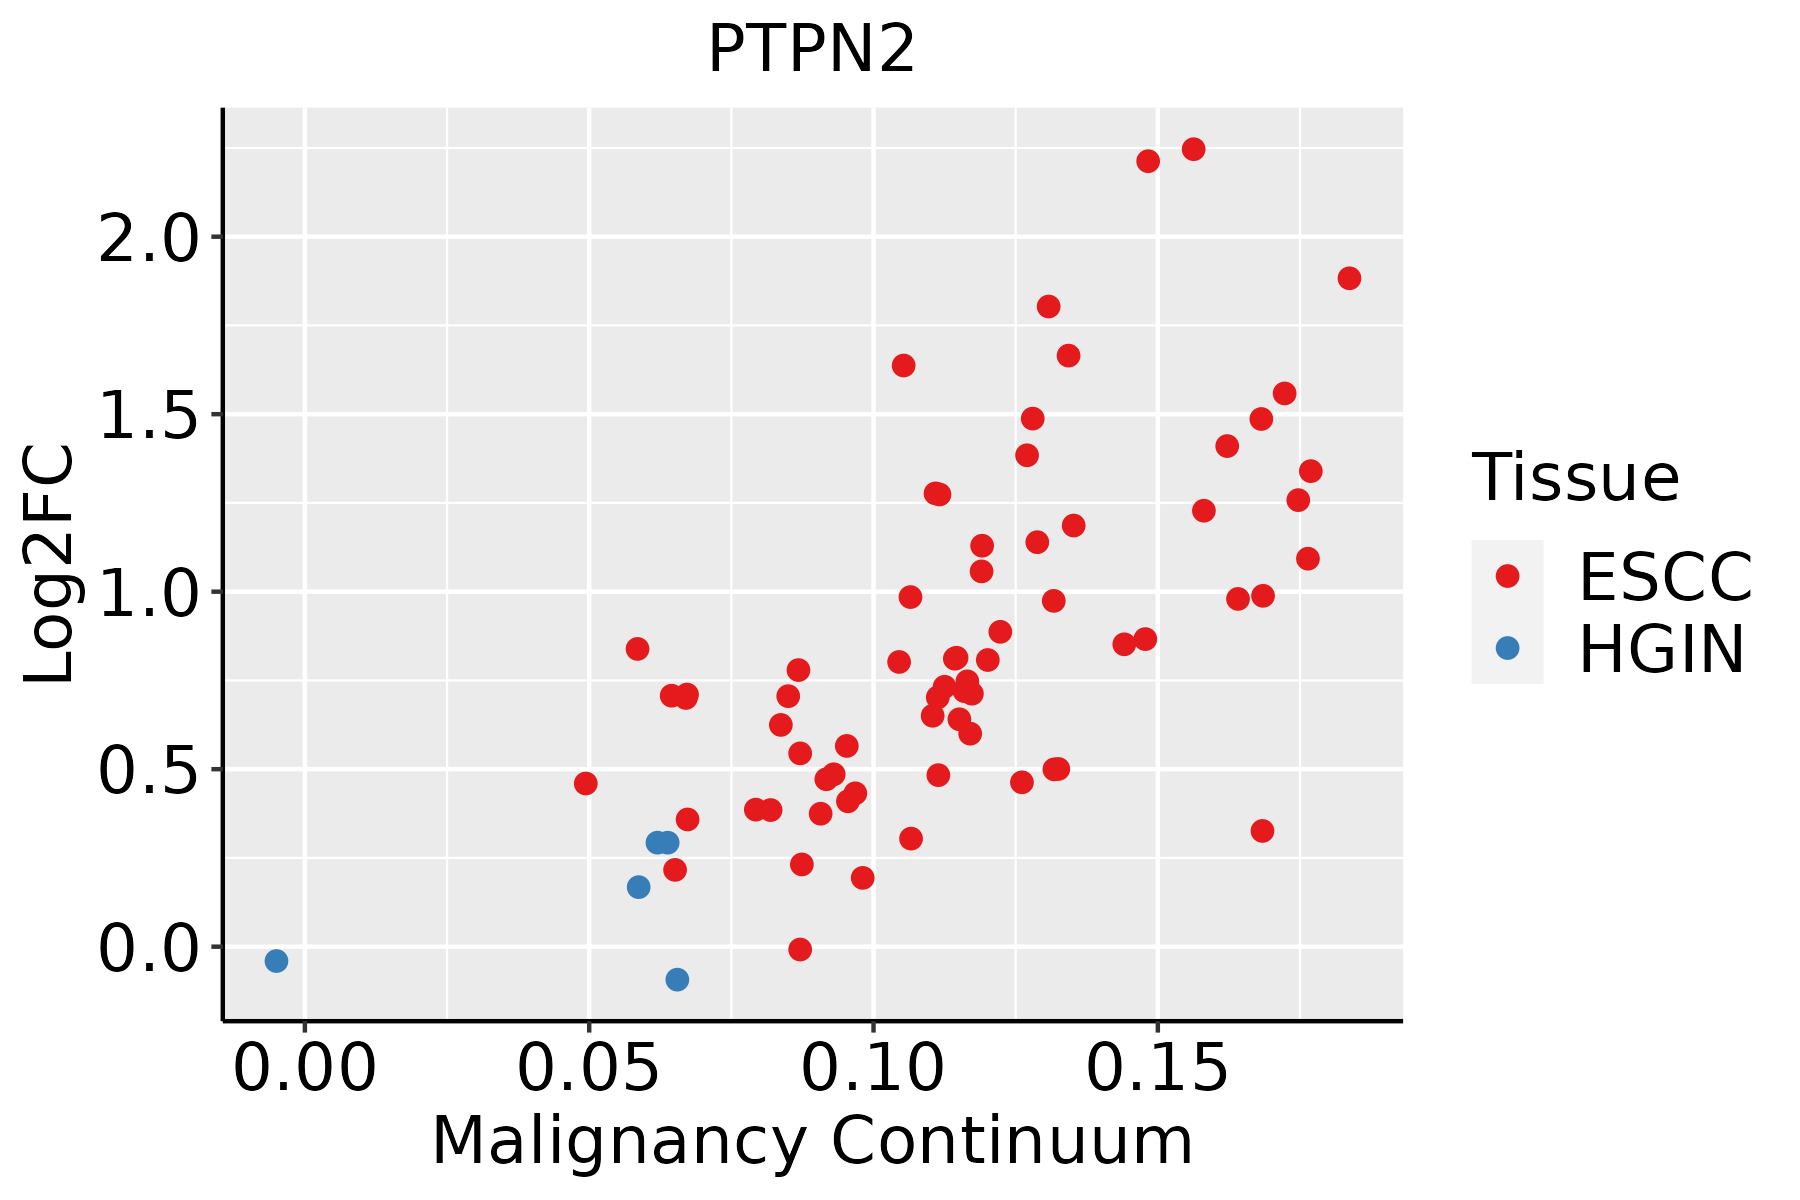 | ESCC: Esophageal squamous cell carcinoma |
| HGIN: High-grade intraepithelial neoplasias | ||
| LGIN: Low-grade intraepithelial neoplasias | ||
| Liver | 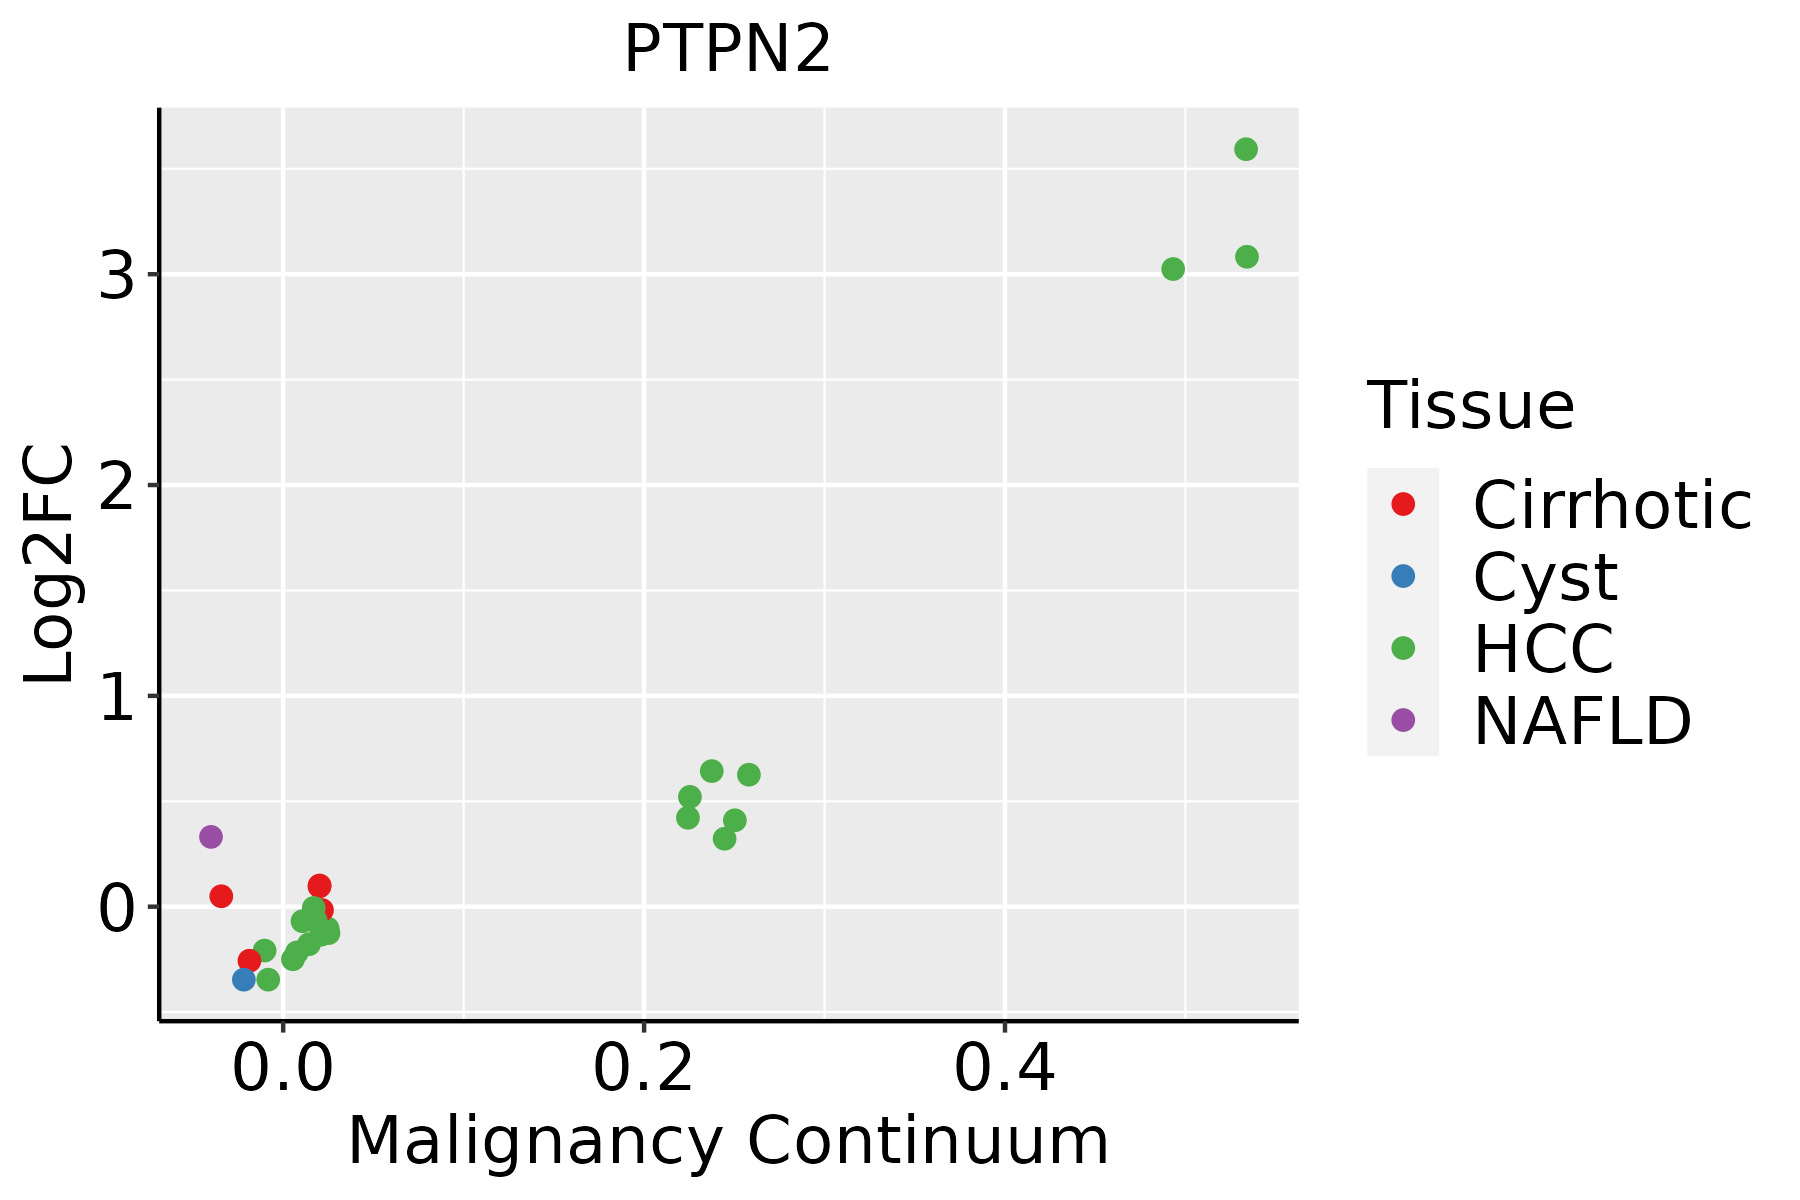 | HCC: Hepatocellular carcinoma |
| NAFLD: Non-alcoholic fatty liver disease | ||
| Lung |  | AAH: Atypical adenomatous hyperplasia |
| AIS: Adenocarcinoma in situ | ||
| IAC: Invasive lung adenocarcinoma | ||
| MIA: Minimally invasive adenocarcinoma | ||
| Oral Cavity | 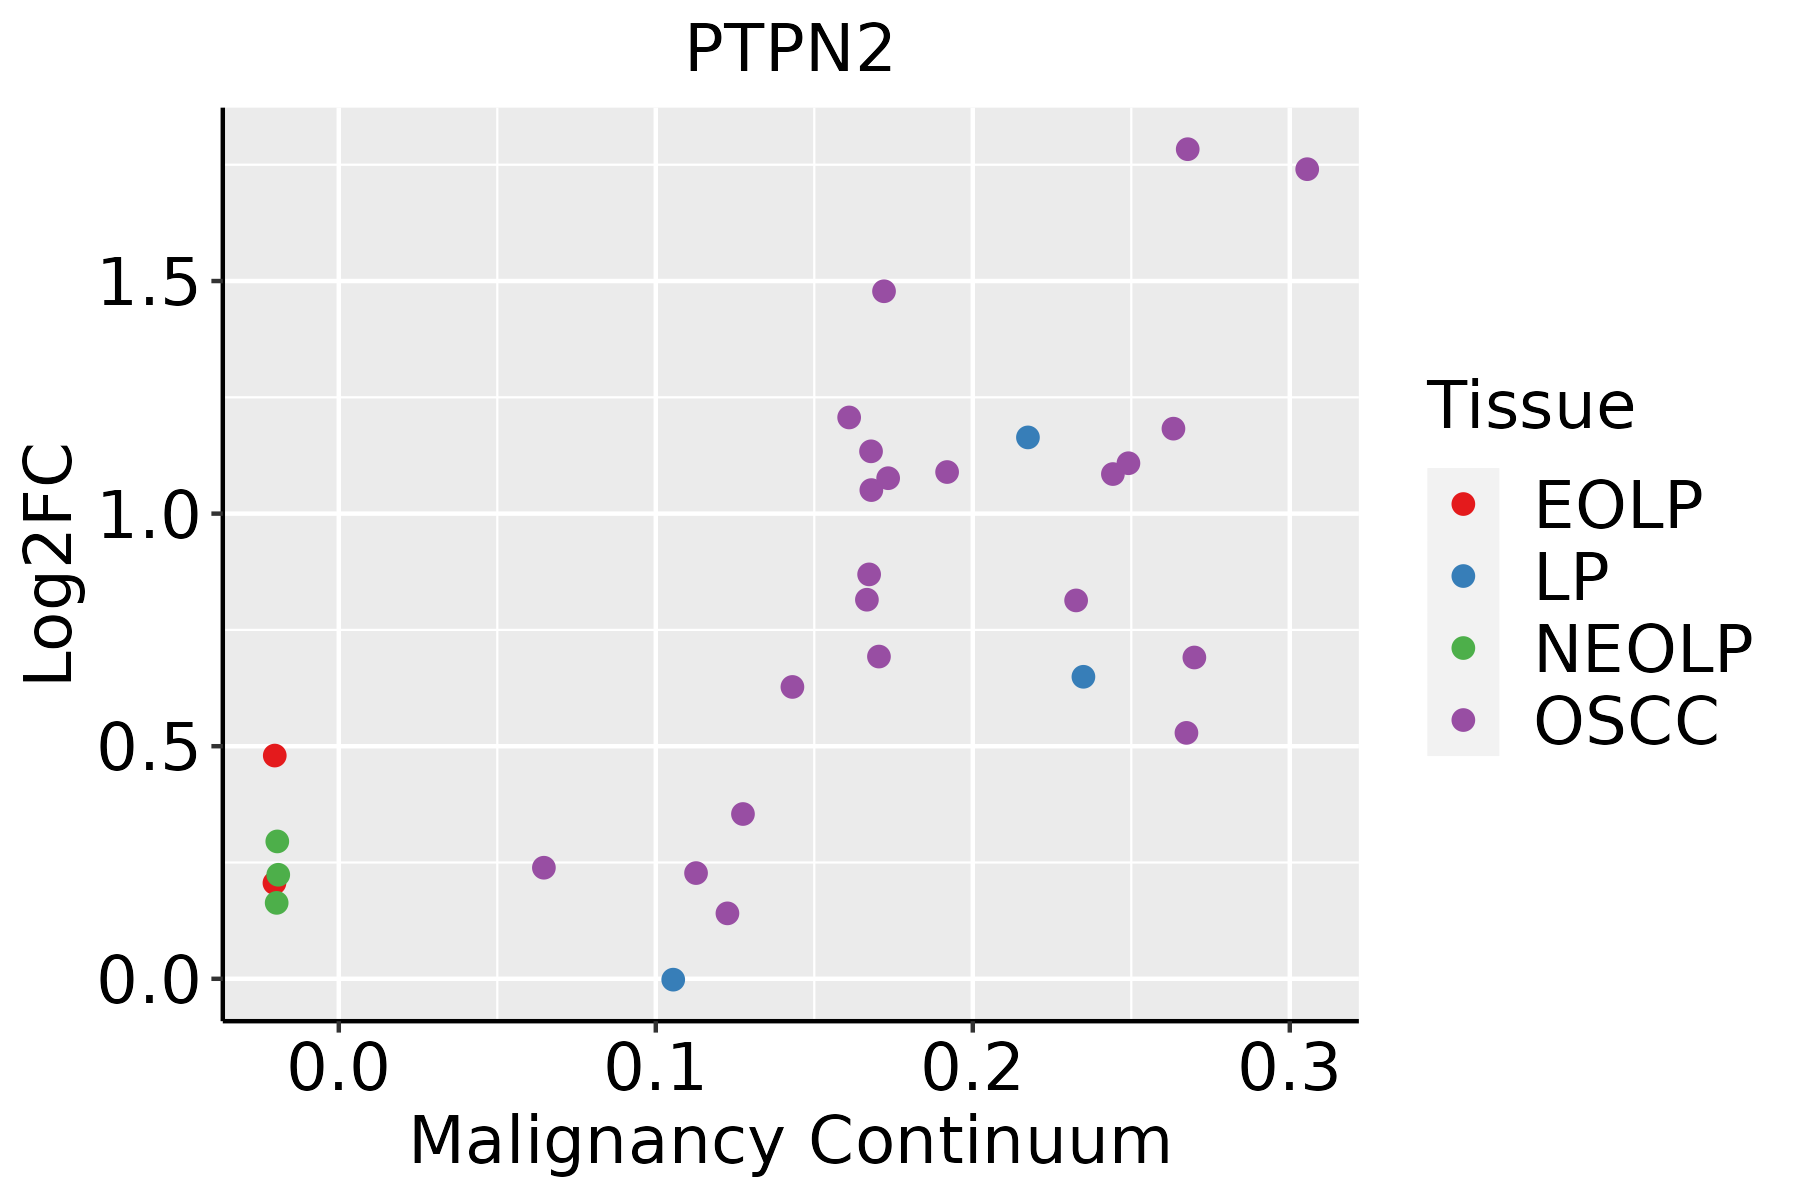 | EOLP: Erosive Oral lichen planus |
| LP: leukoplakia | ||
| NEOLP: Non-erosive oral lichen planus | ||
| OSCC: Oral squamous cell carcinoma | ||
| Skin | 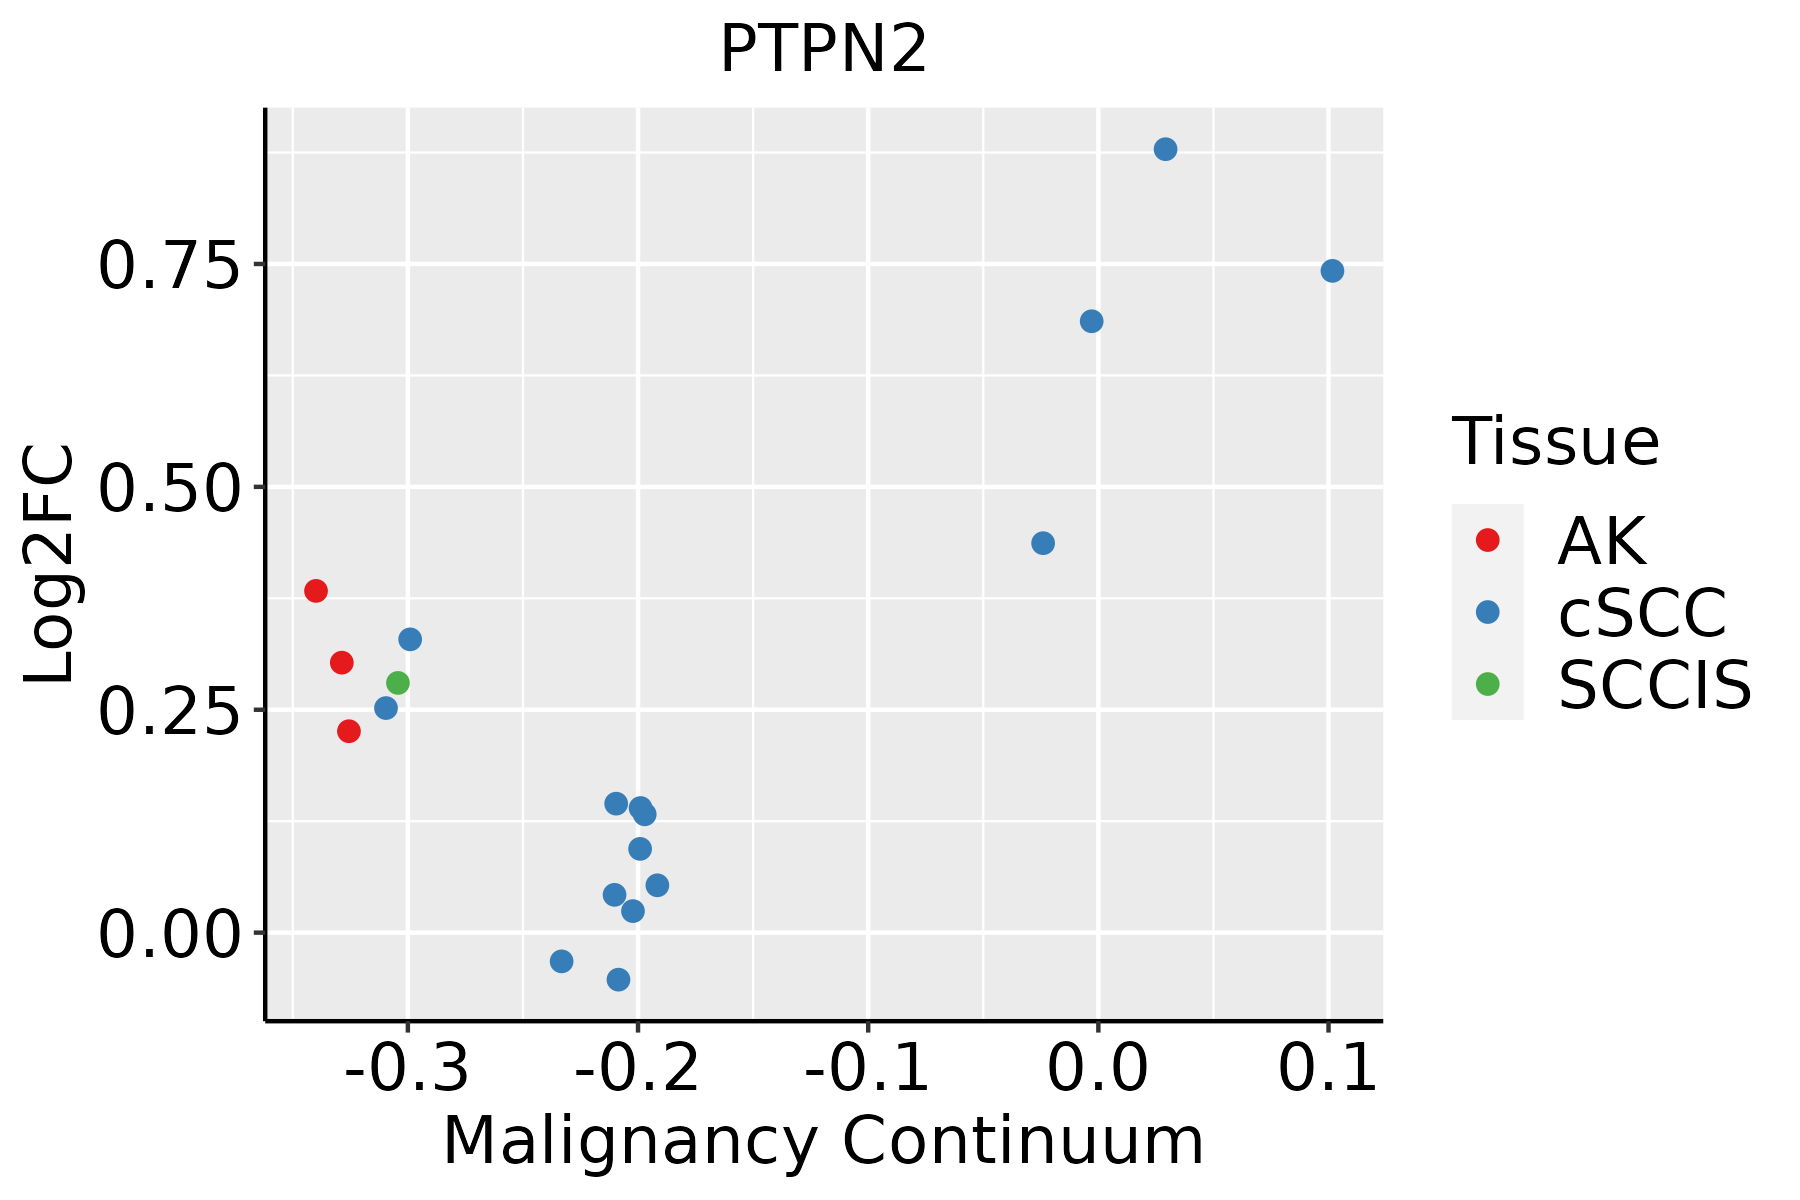 | AK: Actinic keratosis |
| cSCC: Cutaneous squamous cell carcinoma | ||
| SCCIS:squamous cell carcinoma in situ | ||
| Thyroid | 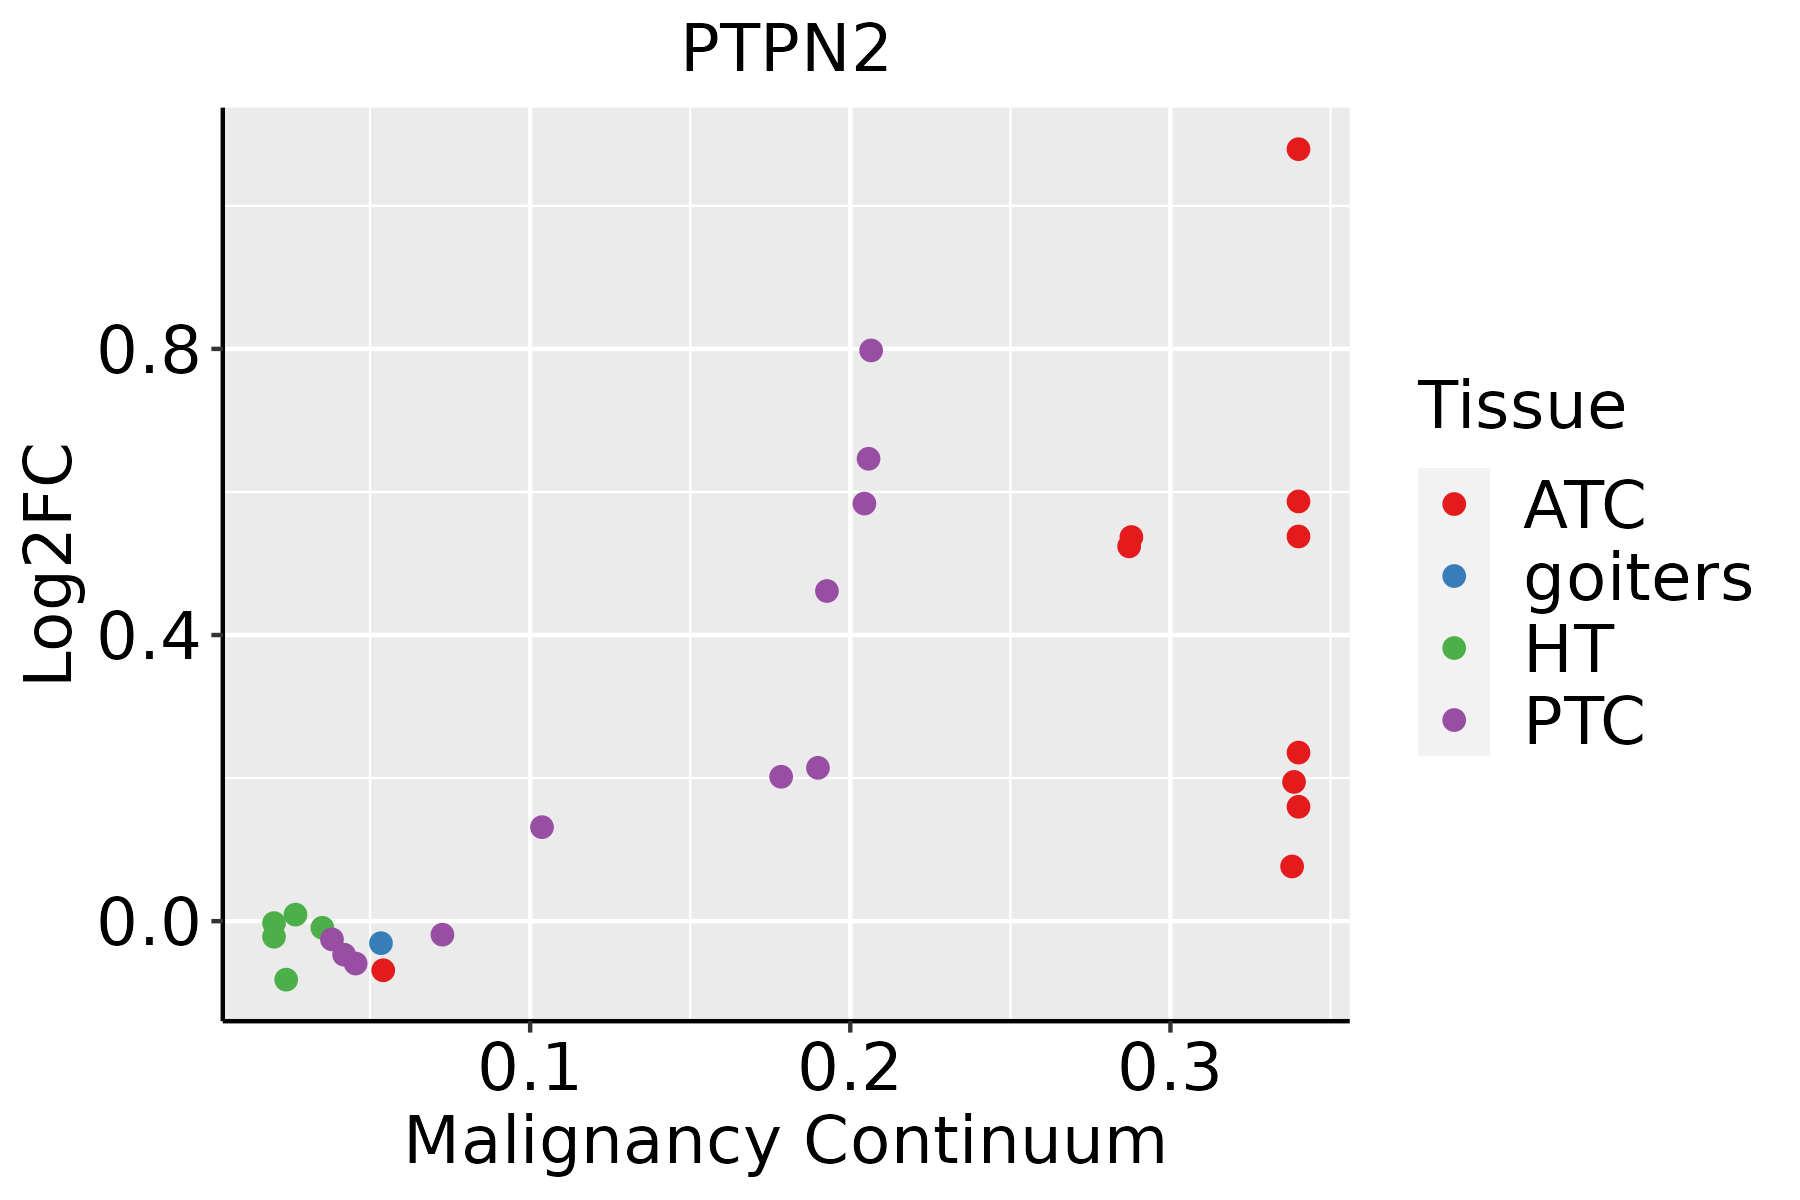 | ATC: Anaplastic thyroid cancer |
| HT: Hashimoto's thyroiditis | ||
| PTC: Papillary thyroid cancer |
| ∗log2FC in expression of this searched gene in stem-like cells from each diseased tissue sample relative to stem-like cells in normal samples in each tissue plotted against the malignancy continuum. Samples are colored based on if they are from different disease stage. |
Top |
Malignant transformation related pathway analysis |
| Find out the enriched GO biological processes and KEGG pathways involved in transition from healthy to precancer to cancer |
| Tissue | Disease Stage | Enriched GO biological Processes |
| Colorectum | AD |  |
| Colorectum | SER |  |
| Colorectum | MSS |  |
| Colorectum | MSI-H |  |
| Colorectum | FAP |  |
| ∗Top 15 enriched GO BP terms are showed in the bar plot of each disease state in each tissue. Each row represents a significant GO biological process which is colored according to the -log10(p.adjust). |
| Page: 1 2 3 4 5 6 7 8 9 |
| GO ID | Tissue | Disease Stage | Description | Gene Ratio | Bg Ratio | pvalue | p.adjust | Count |
| GO:00346126 | Liver | Cirrhotic | response to tumor necrosis factor | 89/4634 | 253/18723 | 1.24e-04 | 1.22e-03 | 89 |
| GO:00603332 | Liver | Cirrhotic | interferon-gamma-mediated signaling pathway | 16/4634 | 27/18723 | 1.41e-04 | 1.36e-03 | 16 |
| GO:005134812 | Liver | Cirrhotic | negative regulation of transferase activity | 93/4634 | 268/18723 | 1.55e-04 | 1.47e-03 | 93 |
| GO:004426211 | Liver | Cirrhotic | cellular carbohydrate metabolic process | 97/4634 | 283/18723 | 1.89e-04 | 1.76e-03 | 97 |
| GO:00700596 | Liver | Cirrhotic | intrinsic apoptotic signaling pathway in response to endoplasmic reticulum stress | 29/4634 | 63/18723 | 1.90e-04 | 1.76e-03 | 29 |
| GO:00160511 | Liver | Cirrhotic | carbohydrate biosynthetic process | 73/4634 | 202/18723 | 1.91e-04 | 1.77e-03 | 73 |
| GO:000647011 | Liver | Cirrhotic | protein dephosphorylation | 96/4634 | 281/18723 | 2.32e-04 | 2.11e-03 | 96 |
| GO:000226212 | Liver | Cirrhotic | myeloid cell homeostasis | 59/4634 | 157/18723 | 2.33e-04 | 2.11e-03 | 59 |
| GO:004205912 | Liver | Cirrhotic | negative regulation of epidermal growth factor receptor signaling pathway | 16/4634 | 28/18723 | 2.53e-04 | 2.27e-03 | 16 |
| GO:00109061 | Liver | Cirrhotic | regulation of glucose metabolic process | 47/4634 | 119/18723 | 2.61e-04 | 2.33e-03 | 47 |
| GO:00108831 | Liver | Cirrhotic | regulation of lipid storage | 26/4634 | 57/18723 | 4.79e-04 | 3.85e-03 | 26 |
| GO:00193191 | Liver | Cirrhotic | hexose biosynthetic process | 33/4634 | 78/18723 | 4.94e-04 | 3.96e-03 | 33 |
| GO:00060941 | Liver | Cirrhotic | gluconeogenesis | 32/4634 | 75/18723 | 5.00e-04 | 3.98e-03 | 32 |
| GO:190118511 | Liver | Cirrhotic | negative regulation of ERBB signaling pathway | 17/4634 | 32/18723 | 5.24e-04 | 4.14e-03 | 17 |
| GO:19022353 | Liver | Cirrhotic | regulation of endoplasmic reticulum stress-induced intrinsic apoptotic signaling pathway | 17/4634 | 32/18723 | 5.24e-04 | 4.14e-03 | 17 |
| GO:00713566 | Liver | Cirrhotic | cellular response to tumor necrosis factor | 79/4634 | 229/18723 | 5.68e-04 | 4.45e-03 | 79 |
| GO:1905898 | Liver | Cirrhotic | positive regulation of response to endoplasmic reticulum stress | 18/4634 | 35/18723 | 6.04e-04 | 4.67e-03 | 18 |
| GO:00713572 | Liver | Cirrhotic | cellular response to type I interferon | 24/4634 | 52/18723 | 6.32e-04 | 4.83e-03 | 24 |
| GO:00106751 | Liver | Cirrhotic | regulation of cellular carbohydrate metabolic process | 54/4634 | 146/18723 | 6.53e-04 | 4.96e-03 | 54 |
| GO:003812711 | Liver | Cirrhotic | ERBB signaling pathway | 46/4634 | 121/18723 | 8.08e-04 | 5.93e-03 | 46 |
| Page: 1 2 3 4 5 6 7 8 9 10 11 12 13 14 15 16 17 18 19 20 21 22 23 24 25 26 27 28 29 30 31 32 33 34 35 36 37 38 39 40 41 42 43 44 45 46 47 48 49 50 51 52 53 54 55 56 57 58 59 60 61 62 63 64 65 66 67 68 69 70 71 |
| Pathway ID | Tissue | Disease Stage | Description | Gene Ratio | Bg Ratio | pvalue | p.adjust | qvalue | Count |
| hsa04630 | Oral cavity | EOLP | JAK-STAT signaling pathway | 35/1218 | 166/8465 | 1.15e-02 | 3.07e-02 | 1.81e-02 | 35 |
| hsa046301 | Oral cavity | EOLP | JAK-STAT signaling pathway | 35/1218 | 166/8465 | 1.15e-02 | 3.07e-02 | 1.81e-02 | 35 |
| Page: 1 |
Top |
Cell-cell communication analysis |
| Identification of potential cell-cell interactions between two cell types and their ligand-receptor pairs for different disease states |
| Ligand | Receptor | LRpair | Pathway | Tissue | Disease Stage |
| Page: 1 |
Top |
Single-cell gene regulatory network inference analysis |
| Find out the significant the regulons (TFs) and the target genes of each regulon across cell types for different disease states |
| TF | Cell Type | Tissue | Disease Stage | Target Gene | RSS | Regulon Activity |
| ∗The dot plots of a searched regulon are shown for all cell subpopulations in each disease state of each tissue based on the regulon specific score inferred using pySCENIC and by calculating the average expression. |
| Page: 1 |
Top |
Somatic mutation of malignant transformation related genes |
| Annotation of somatic variants for genes involved in malignant transformation |
| Hugo Symbol | Variant Class | Variant Classification | dbSNP RS | HGVSc | HGVSp | HGVSp Short | SWISSPROT | BIOTYPE | SIFT | PolyPhen | Tumor Sample Barcode | Tissue | Histology | Sex | Age | Stage | Therapy Types | Drugs | Outcome |
| PTPN2 | SNV | Missense_Mutation | c.193G>C | p.Glu65Gln | p.E65Q | P17706 | protein_coding | tolerated(0.11) | benign(0.153) | TCGA-AN-A0XW-01 | Breast | breast invasive carcinoma | Female | <65 | III/IV | Unknown | Unknown | SD | |
| PTPN2 | SNV | Missense_Mutation | c.491T>G | p.Ile164Ser | p.I164S | P17706 | protein_coding | deleterious(0.03) | benign(0.143) | TCGA-C8-A12L-01 | Breast | breast invasive carcinoma | Female | >=65 | I/II | Unknown | Unknown | SD | |
| PTPN2 | SNV | Missense_Mutation | rs779158537 | c.1054N>T | p.Arg352Cys | p.R352C | P17706 | protein_coding | deleterious(0) | probably_damaging(0.999) | TCGA-2W-A8YY-01 | Cervix | cervical & endocervical cancer | Female | <65 | I/II | Chemotherapy | cisplatin | CR |
| PTPN2 | SNV | Missense_Mutation | c.312N>C | p.Gln104His | p.Q104H | P17706 | protein_coding | deleterious(0) | probably_damaging(0.973) | TCGA-C5-A1MH-01 | Cervix | cervical & endocervical cancer | Female | >=65 | III/IV | Chemotherapy | cisplatin | PD | |
| PTPN2 | SNV | Missense_Mutation | novel | c.890N>C | p.Leu297Ser | p.L297S | P17706 | protein_coding | tolerated(0.25) | benign(0.137) | TCGA-DS-A1OD-01 | Cervix | cervical & endocervical cancer | Female | <65 | I/II | Chemotherapy | cisplatin | SD |
| PTPN2 | SNV | Missense_Mutation | c.49C>T | p.Arg17Cys | p.R17C | P17706 | protein_coding | tolerated(0.05) | benign(0.003) | TCGA-JW-A5VL-01 | Cervix | cervical & endocervical cancer | Female | <65 | I/II | Unknown | Unknown | SD | |
| PTPN2 | insertion | Frame_Shift_Ins | novel | c.891_892insCTGT | p.Ser298LeufsTer6 | p.S298Lfs*6 | P17706 | protein_coding | TCGA-DS-A1OD-01 | Cervix | cervical & endocervical cancer | Female | <65 | I/II | Chemotherapy | cisplatin | SD | ||
| PTPN2 | deletion | Frame_Shift_Del | novel | c.922_925delATAA | p.Ile308Ter | p.I308* | P17706 | protein_coding | TCGA-EA-A410-01 | Cervix | cervical & endocervical cancer | Female | <65 | I/II | Unknown | Unknown | SD | ||
| PTPN2 | SNV | Missense_Mutation | novel | c.139N>G | p.Arg47Gly | p.R47G | P17706 | protein_coding | deleterious(0) | probably_damaging(1) | TCGA-5M-AAT6-01 | Colorectum | colon adenocarcinoma | Female | <65 | III/IV | Unknown | Unknown | PD |
| PTPN2 | SNV | Missense_Mutation | c.242N>C | p.Arg81Thr | p.R81T | P17706 | protein_coding | deleterious(0) | probably_damaging(0.997) | TCGA-AA-3930-01 | Colorectum | colon adenocarcinoma | Male | >=65 | III/IV | Chemotherapy | capecitabine | PD |
| Page: 1 2 3 4 5 |
Top |
Related drugs of malignant transformation related genes |
| Identification of chemicals and drugs interact with genes involved in malignant transfromation |
| (DGIdb 4.0) |
| Entrez ID | Symbol | Category | Interaction Types | Drug Claim Name | Drug Name | PMIDs |
| Page: 1 |

Copyright 2023-Present -The University of Texas Health Science Center at Houston |