
|
|||||
|
 | |
| |
| |
| |
| |
| |
|
Gene: PRKCI |
Gene summary for PRKCI |
| Gene information | Species | Human | Gene symbol | PRKCI | Gene ID | 5584 |
| Gene name | protein kinase C iota | |
| Gene Alias | DXS1179E | |
| Cytomap | 3q26.2 | |
| Gene Type | protein-coding | GO ID | GO:0001654 | UniProtAcc | P41743 |
Top |
Malignant transformation analysis |
| Identification of the aberrant gene expression in precancerous and cancerous lesions by comparing the gene expression of stem-like cells in diseased tissues with normal stem cells |
| Entrez ID | Symbol | Replicates | Species | Organ | Tissue | Adj P-value | Log2FC | Malignancy |
| 5584 | PRKCI | CA_HPV_1 | Human | Cervix | CC | 2.35e-03 | -1.80e-01 | 0.0264 |
| 5584 | PRKCI | CA_HPV_2 | Human | Cervix | CC | 1.04e-05 | 3.26e-01 | 0.0391 |
| 5584 | PRKCI | CCI_1 | Human | Cervix | CC | 1.99e-05 | 1.07e+00 | 0.528 |
| 5584 | PRKCI | CCI_2 | Human | Cervix | CC | 1.00e-06 | 1.08e+00 | 0.5249 |
| 5584 | PRKCI | CCI_3 | Human | Cervix | CC | 3.39e-10 | 1.06e+00 | 0.516 |
| 5584 | PRKCI | Tumor | Human | Cervix | CC | 1.04e-06 | 2.55e-01 | 0.1241 |
| 5584 | PRKCI | sample3 | Human | Cervix | CC | 5.34e-14 | 3.53e-01 | 0.1387 |
| 5584 | PRKCI | T3 | Human | Cervix | CC | 3.78e-13 | 3.37e-01 | 0.1389 |
| 5584 | PRKCI | LZE2T | Human | Esophagus | ESCC | 2.33e-05 | 8.51e-01 | 0.082 |
| 5584 | PRKCI | LZE4T | Human | Esophagus | ESCC | 6.04e-26 | 8.23e-01 | 0.0811 |
| 5584 | PRKCI | LZE5T | Human | Esophagus | ESCC | 3.28e-02 | 2.06e-01 | 0.0514 |
| 5584 | PRKCI | LZE7T | Human | Esophagus | ESCC | 1.73e-02 | 1.35e-01 | 0.0667 |
| 5584 | PRKCI | LZE8T | Human | Esophagus | ESCC | 4.89e-05 | 9.25e-02 | 0.067 |
| 5584 | PRKCI | LZE20T | Human | Esophagus | ESCC | 2.98e-04 | 2.72e-01 | 0.0662 |
| 5584 | PRKCI | LZE22D1 | Human | Esophagus | HGIN | 6.54e-04 | 1.08e-01 | 0.0595 |
| 5584 | PRKCI | LZE22T | Human | Esophagus | ESCC | 5.70e-07 | 3.79e-01 | 0.068 |
| 5584 | PRKCI | LZE24T | Human | Esophagus | ESCC | 5.84e-32 | 9.74e-01 | 0.0596 |
| 5584 | PRKCI | LZE21T | Human | Esophagus | ESCC | 1.00e-15 | 8.03e-01 | 0.0655 |
| 5584 | PRKCI | P1T-E | Human | Esophagus | ESCC | 7.76e-06 | 6.05e-01 | 0.0875 |
| 5584 | PRKCI | P2T-E | Human | Esophagus | ESCC | 1.38e-75 | 1.25e+00 | 0.1177 |
| Page: 1 2 3 4 5 6 7 8 |
| Tissue | Expression Dynamics | Abbreviation |
| Cervix |  | CC: Cervix cancer |
| HSIL_HPV: HPV-infected high-grade squamous intraepithelial lesions | ||
| N_HPV: HPV-infected normal cervix | ||
| Esophagus |  | ESCC: Esophageal squamous cell carcinoma |
| HGIN: High-grade intraepithelial neoplasias | ||
| LGIN: Low-grade intraepithelial neoplasias | ||
| Liver | 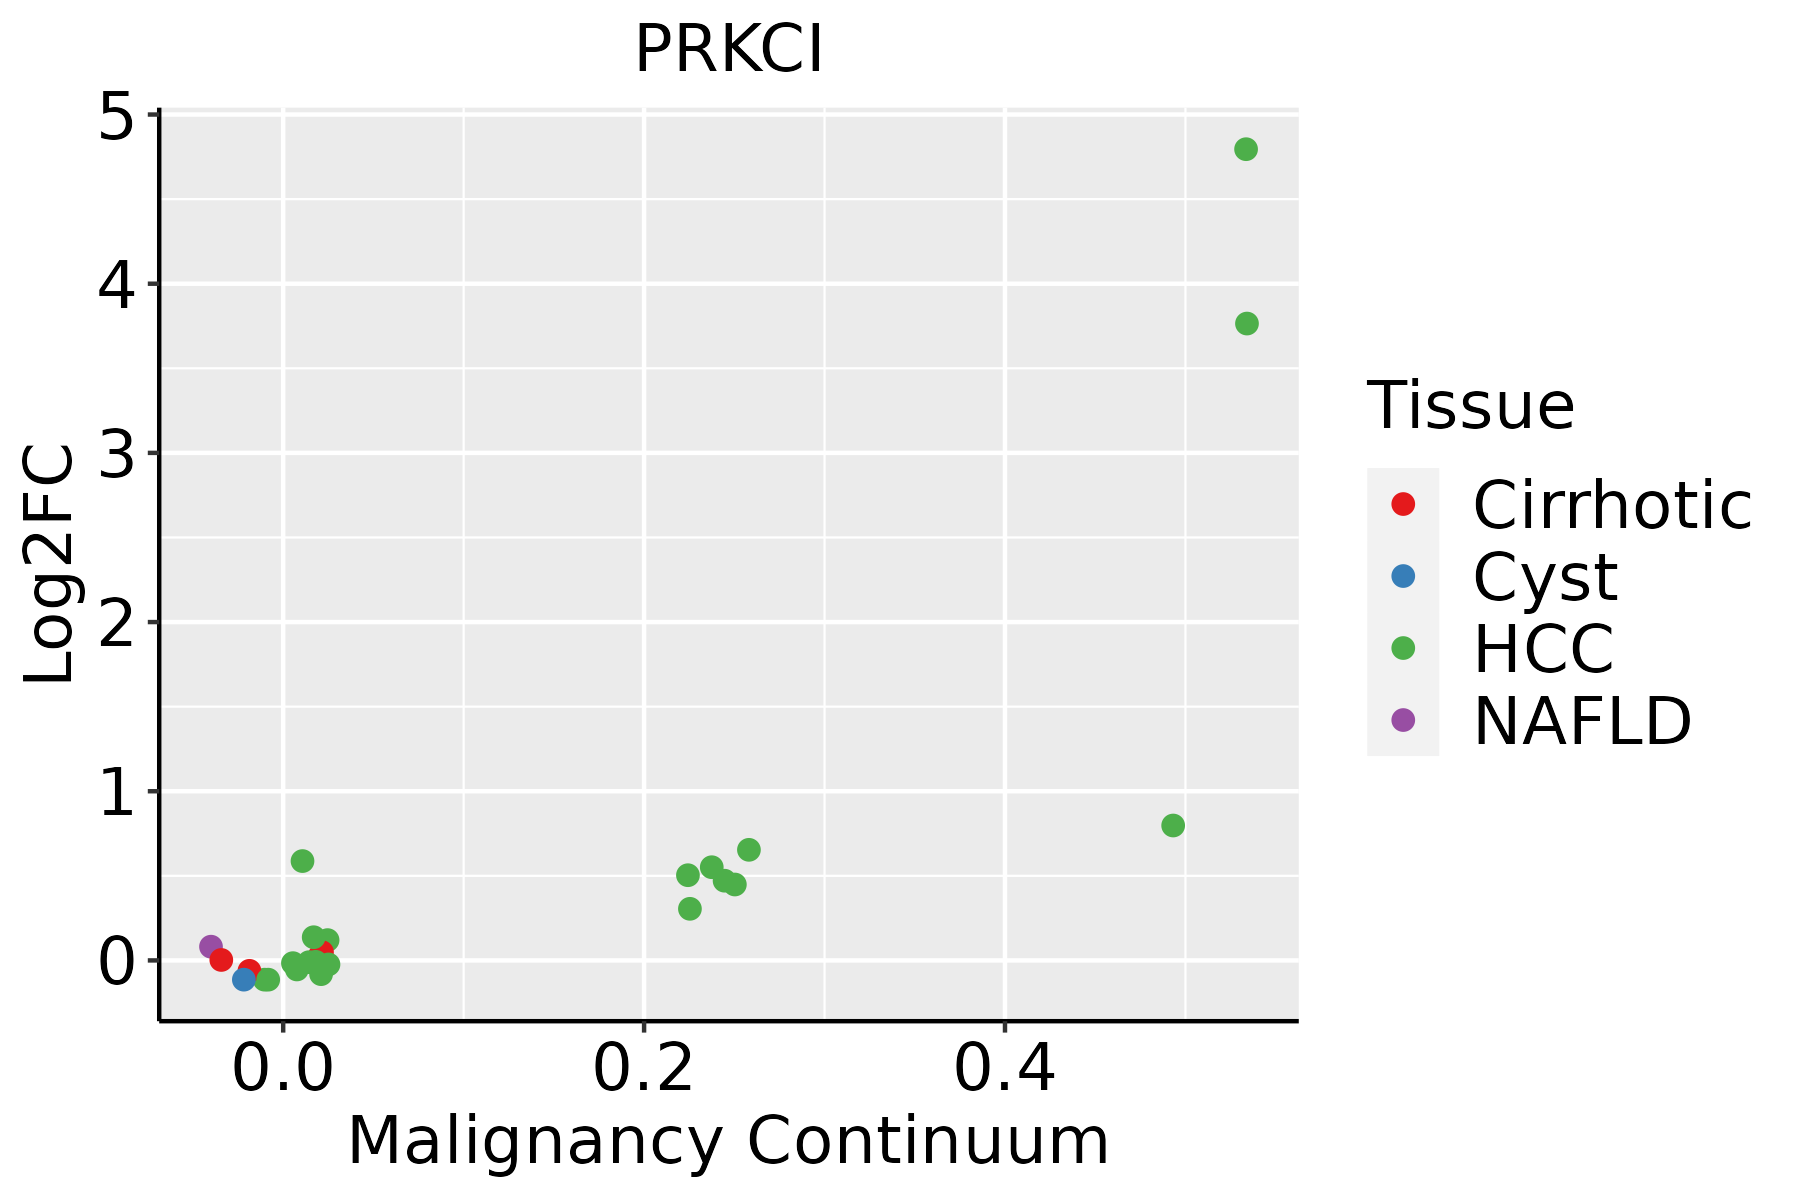 | HCC: Hepatocellular carcinoma |
| NAFLD: Non-alcoholic fatty liver disease | ||
| Lung |  | AAH: Atypical adenomatous hyperplasia |
| AIS: Adenocarcinoma in situ | ||
| IAC: Invasive lung adenocarcinoma | ||
| MIA: Minimally invasive adenocarcinoma | ||
| Oral Cavity |  | EOLP: Erosive Oral lichen planus |
| LP: leukoplakia | ||
| NEOLP: Non-erosive oral lichen planus | ||
| OSCC: Oral squamous cell carcinoma | ||
| Prostate | 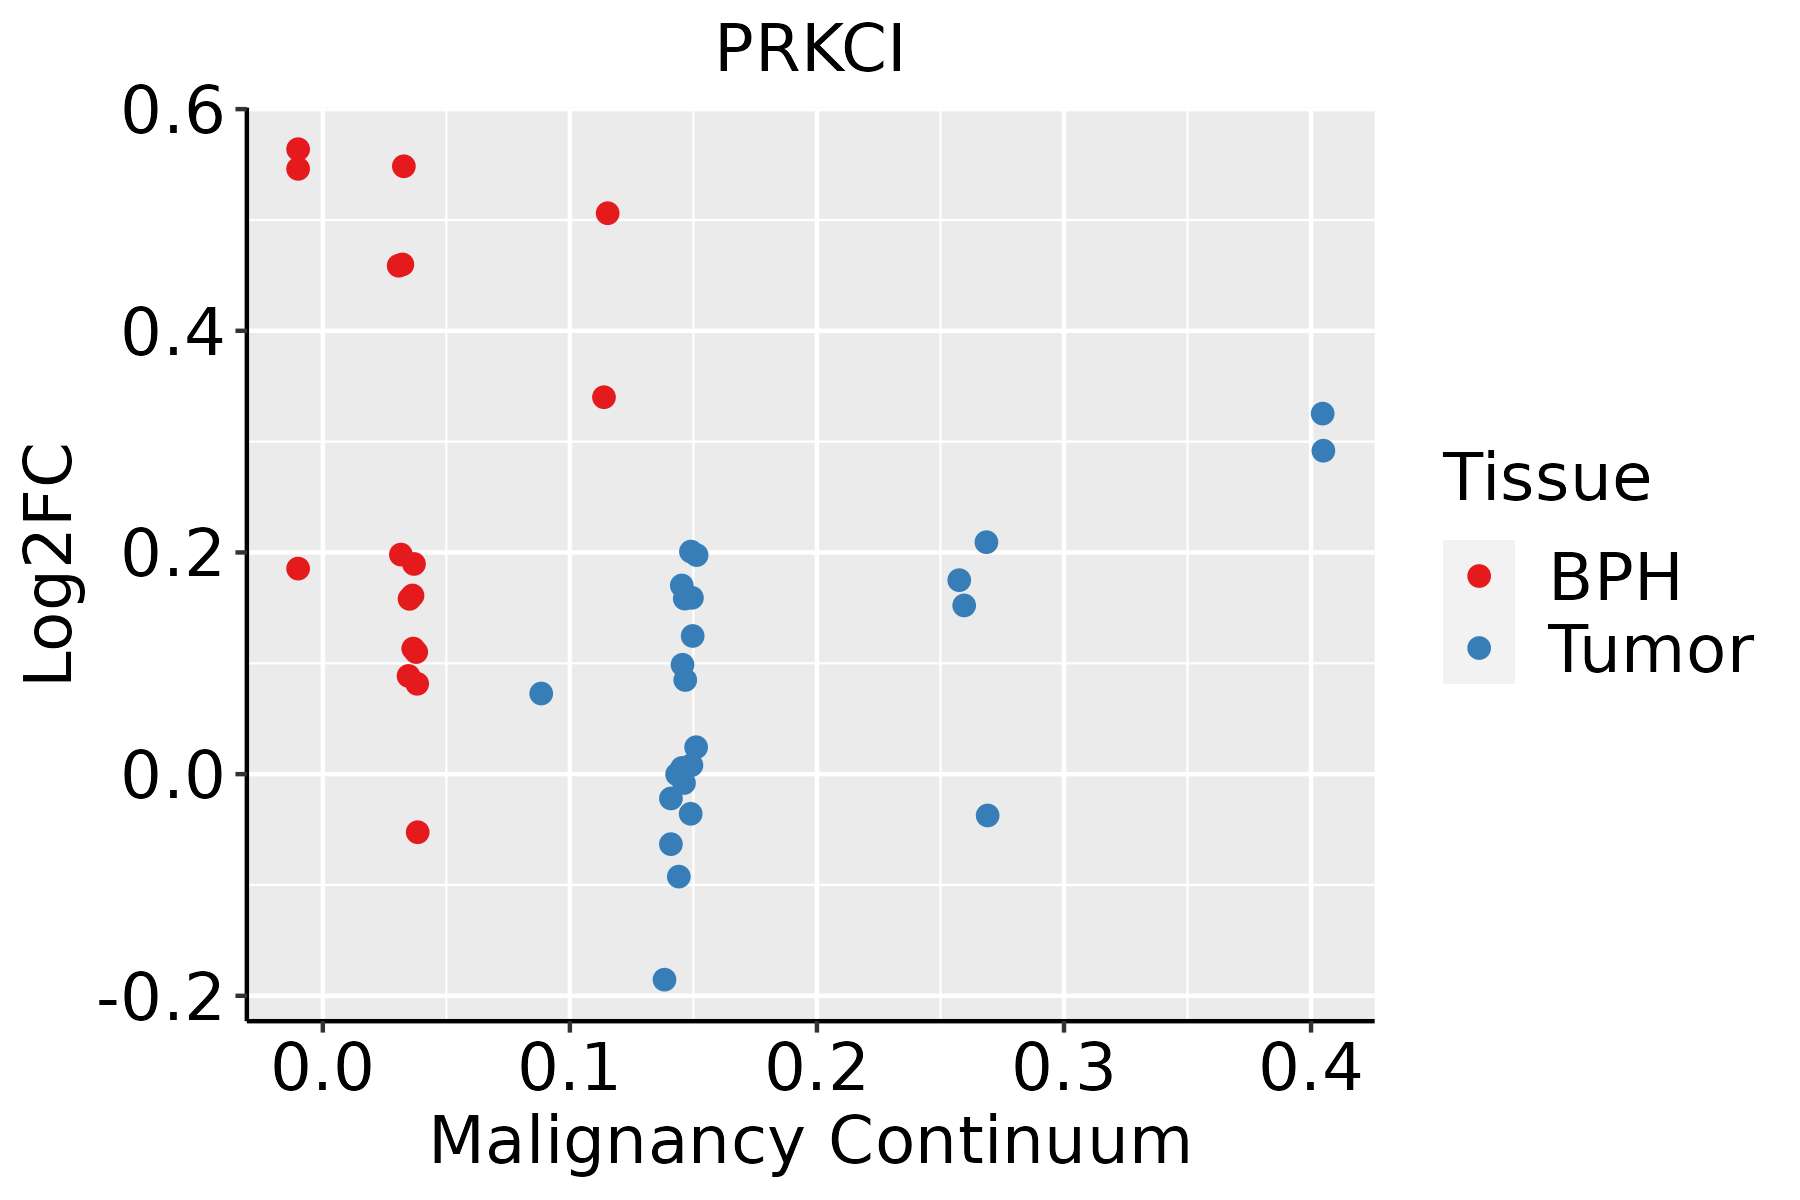 | BPH: Benign Prostatic Hyperplasia |
| Skin |  | AK: Actinic keratosis |
| cSCC: Cutaneous squamous cell carcinoma | ||
| SCCIS:squamous cell carcinoma in situ | ||
| Thyroid | 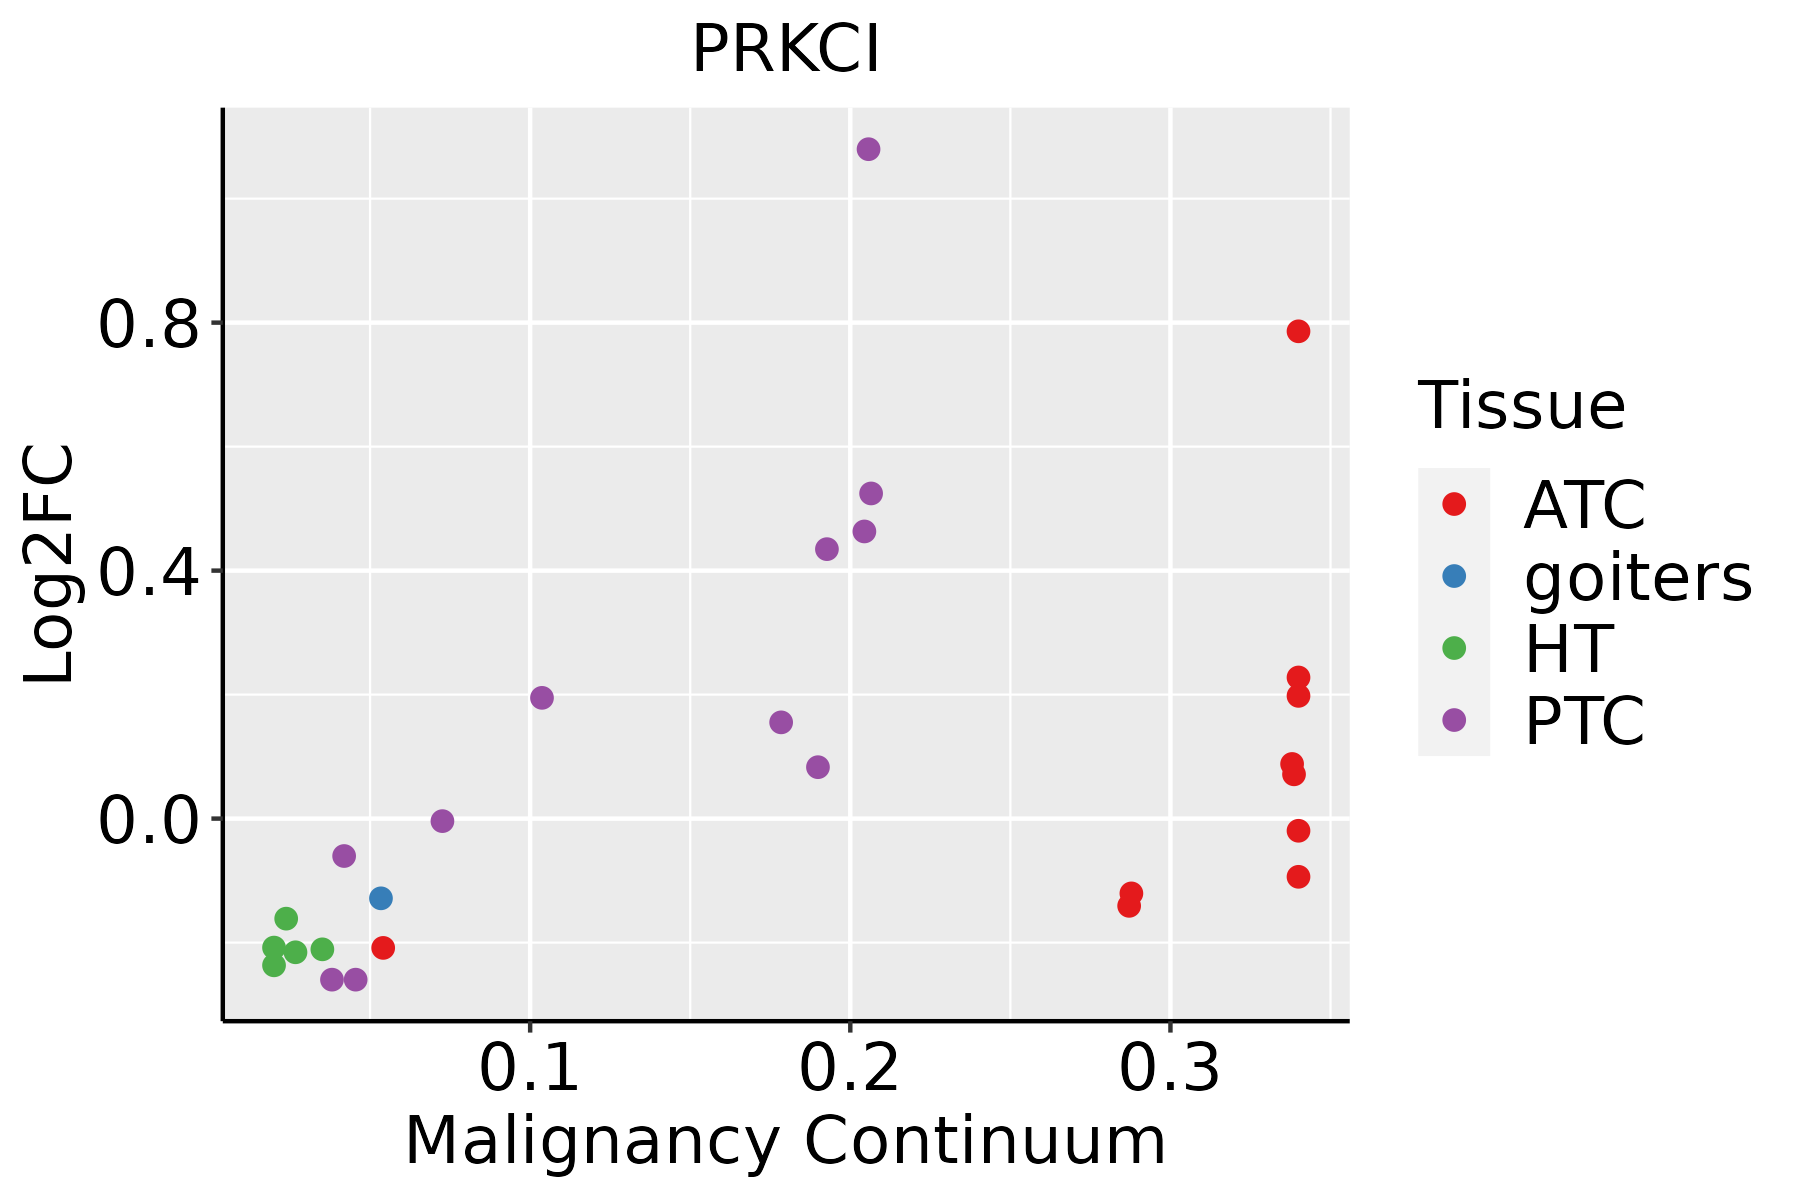 | ATC: Anaplastic thyroid cancer |
| HT: Hashimoto's thyroiditis | ||
| PTC: Papillary thyroid cancer |
| ∗log2FC in expression of this searched gene in stem-like cells from each diseased tissue sample relative to stem-like cells in normal samples in each tissue plotted against the malignancy continuum. Samples are colored based on if they are from different disease stage. |
Top |
Malignant transformation related pathway analysis |
| Find out the enriched GO biological processes and KEGG pathways involved in transition from healthy to precancer to cancer |
| Tissue | Disease Stage | Enriched GO biological Processes |
| Colorectum | AD |  |
| Colorectum | SER |  |
| Colorectum | MSS |  |
| Colorectum | MSI-H |  |
| Colorectum | FAP |  |
| ∗Top 15 enriched GO BP terms are showed in the bar plot of each disease state in each tissue. Each row represents a significant GO biological process which is colored according to the -log10(p.adjust). |
| Page: 1 2 3 4 5 6 7 8 9 |
| GO ID | Tissue | Disease Stage | Description | Gene Ratio | Bg Ratio | pvalue | p.adjust | Count |
| GO:19012158 | Prostate | BPH | negative regulation of neuron death | 53/3107 | 208/18723 | 6.87e-04 | 4.58e-03 | 53 |
| GO:19040353 | Prostate | BPH | regulation of epithelial cell apoptotic process | 28/3107 | 96/18723 | 1.46e-03 | 8.69e-03 | 28 |
| GO:00510924 | Prostate | BPH | positive regulation of NF-kappaB transcription factor activity | 40/3107 | 152/18723 | 1.54e-03 | 9.08e-03 | 40 |
| GO:00510916 | Prostate | BPH | positive regulation of DNA-binding transcription factor activity | 62/3107 | 260/18723 | 1.58e-03 | 9.23e-03 | 62 |
| GO:00350887 | Prostate | BPH | establishment or maintenance of apical/basal cell polarity | 17/3107 | 49/18723 | 1.60e-03 | 9.32e-03 | 17 |
| GO:00612457 | Prostate | BPH | establishment or maintenance of bipolar cell polarity | 17/3107 | 49/18723 | 1.60e-03 | 9.32e-03 | 17 |
| GO:00990726 | Prostate | BPH | regulation of postsynaptic membrane neurotransmitter receptor levels | 20/3107 | 62/18723 | 1.80e-03 | 1.03e-02 | 20 |
| GO:00481945 | Prostate | BPH | Golgi vesicle budding | 6/3107 | 10/18723 | 2.38e-03 | 1.29e-02 | 6 |
| GO:00611624 | Prostate | BPH | establishment of monopolar cell polarity | 10/3107 | 24/18723 | 3.21e-03 | 1.67e-02 | 10 |
| GO:00451977 | Prostate | BPH | establishment or maintenance of epithelial cell apical/basal polarity | 15/3107 | 44/18723 | 3.59e-03 | 1.83e-02 | 15 |
| GO:00420634 | Prostate | BPH | gliogenesis | 68/3107 | 301/18723 | 4.06e-03 | 2.02e-02 | 68 |
| GO:00613393 | Prostate | BPH | establishment or maintenance of monopolar cell polarity | 10/3107 | 25/18723 | 4.57e-03 | 2.19e-02 | 10 |
| GO:00350892 | Prostate | BPH | establishment of apical/basal cell polarity | 9/3107 | 22/18723 | 5.92e-03 | 2.73e-02 | 9 |
| GO:00072195 | Prostate | BPH | Notch signaling pathway | 41/3107 | 172/18723 | 8.95e-03 | 3.83e-02 | 41 |
| GO:00435244 | Prostate | BPH | negative regulation of neuron apoptotic process | 35/3107 | 145/18723 | 1.23e-02 | 4.94e-02 | 35 |
| GO:000701519 | Prostate | Tumor | actin filament organization | 142/3246 | 442/18723 | 1.40e-14 | 1.89e-12 | 142 |
| GO:004819314 | Prostate | Tumor | Golgi vesicle transport | 105/3246 | 296/18723 | 3.55e-14 | 4.33e-12 | 105 |
| GO:000660519 | Prostate | Tumor | protein targeting | 109/3246 | 314/18723 | 6.11e-14 | 7.30e-12 | 109 |
| GO:190382919 | Prostate | Tumor | positive regulation of cellular protein localization | 97/3246 | 276/18723 | 6.35e-13 | 6.58e-11 | 97 |
| GO:000716317 | Prostate | Tumor | establishment or maintenance of cell polarity | 74/3246 | 218/18723 | 2.00e-09 | 8.86e-08 | 74 |
| Page: 1 2 3 4 5 6 7 8 9 10 11 12 13 14 15 16 17 18 19 20 21 22 23 24 25 26 27 28 29 30 31 32 33 |
| Pathway ID | Tissue | Disease Stage | Description | Gene Ratio | Bg Ratio | pvalue | p.adjust | qvalue | Count |
| hsa0453020 | Cervix | CC | Tight junction | 49/1267 | 169/8465 | 1.87e-06 | 1.78e-05 | 1.05e-05 | 49 |
| hsa0401512 | Cervix | CC | Rap1 signaling pathway | 56/1267 | 210/8465 | 6.23e-06 | 5.61e-05 | 3.32e-05 | 56 |
| hsa0414418 | Cervix | CC | Endocytosis | 64/1267 | 251/8465 | 6.97e-06 | 6.10e-05 | 3.61e-05 | 64 |
| hsa051657 | Cervix | CC | Human papillomavirus infection | 74/1267 | 331/8465 | 1.70e-04 | 1.02e-03 | 6.03e-04 | 74 |
| hsa043908 | Cervix | CC | Hippo signaling pathway | 40/1267 | 157/8465 | 3.64e-04 | 1.82e-03 | 1.07e-03 | 40 |
| hsa046115 | Cervix | CC | Platelet activation | 28/1267 | 124/8465 | 1.50e-02 | 4.45e-02 | 2.63e-02 | 28 |
| hsa04530110 | Cervix | CC | Tight junction | 49/1267 | 169/8465 | 1.87e-06 | 1.78e-05 | 1.05e-05 | 49 |
| hsa0401513 | Cervix | CC | Rap1 signaling pathway | 56/1267 | 210/8465 | 6.23e-06 | 5.61e-05 | 3.32e-05 | 56 |
| hsa0414419 | Cervix | CC | Endocytosis | 64/1267 | 251/8465 | 6.97e-06 | 6.10e-05 | 3.61e-05 | 64 |
| hsa0516512 | Cervix | CC | Human papillomavirus infection | 74/1267 | 331/8465 | 1.70e-04 | 1.02e-03 | 6.03e-04 | 74 |
| hsa0439013 | Cervix | CC | Hippo signaling pathway | 40/1267 | 157/8465 | 3.64e-04 | 1.82e-03 | 1.07e-03 | 40 |
| hsa0461113 | Cervix | CC | Platelet activation | 28/1267 | 124/8465 | 1.50e-02 | 4.45e-02 | 2.63e-02 | 28 |
| hsa0414429 | Esophagus | HGIN | Endocytosis | 76/1383 | 251/8465 | 1.74e-08 | 3.34e-07 | 2.65e-07 | 76 |
| hsa0453039 | Esophagus | HGIN | Tight junction | 40/1383 | 169/8465 | 8.18e-03 | 4.71e-02 | 3.74e-02 | 40 |
| hsa04144113 | Esophagus | HGIN | Endocytosis | 76/1383 | 251/8465 | 1.74e-08 | 3.34e-07 | 2.65e-07 | 76 |
| hsa04530115 | Esophagus | HGIN | Tight junction | 40/1383 | 169/8465 | 8.18e-03 | 4.71e-02 | 3.74e-02 | 40 |
| hsa04144210 | Esophagus | ESCC | Endocytosis | 186/4205 | 251/8465 | 9.74e-16 | 4.66e-14 | 2.39e-14 | 186 |
| hsa0516510 | Esophagus | ESCC | Human papillomavirus infection | 215/4205 | 331/8465 | 7.86e-09 | 7.12e-08 | 3.65e-08 | 215 |
| hsa049109 | Esophagus | ESCC | Insulin signaling pathway | 89/4205 | 137/8465 | 1.97e-04 | 7.32e-04 | 3.75e-04 | 89 |
| hsa04530211 | Esophagus | ESCC | Tight junction | 105/4205 | 169/8465 | 6.73e-04 | 2.23e-03 | 1.14e-03 | 105 |
| Page: 1 2 3 4 5 |
Top |
Cell-cell communication analysis |
| Identification of potential cell-cell interactions between two cell types and their ligand-receptor pairs for different disease states |
| Ligand | Receptor | LRpair | Pathway | Tissue | Disease Stage |
| Page: 1 |
Top |
Single-cell gene regulatory network inference analysis |
| Find out the significant the regulons (TFs) and the target genes of each regulon across cell types for different disease states |
| TF | Cell Type | Tissue | Disease Stage | Target Gene | RSS | Regulon Activity |
| ∗The dot plots of a searched regulon are shown for all cell subpopulations in each disease state of each tissue based on the regulon specific score inferred using pySCENIC and by calculating the average expression. |
| Page: 1 |
Top |
Somatic mutation of malignant transformation related genes |
| Annotation of somatic variants for genes involved in malignant transformation |
| Hugo Symbol | Variant Class | Variant Classification | dbSNP RS | HGVSc | HGVSp | HGVSp Short | SWISSPROT | BIOTYPE | SIFT | PolyPhen | Tumor Sample Barcode | Tissue | Histology | Sex | Age | Stage | Therapy Types | Drugs | Outcome |
| PRKCI | SNV | Missense_Mutation | c.1540N>C | p.Ala514Pro | p.A514P | P41743 | protein_coding | tolerated(0.21) | benign(0.437) | TCGA-AR-A0TU-01 | Breast | breast invasive carcinoma | Female | <65 | I/II | Unspecific | Doxorubicin | SD | |
| PRKCI | SNV | Missense_Mutation | c.1745N>G | p.Phe582Cys | p.F582C | P41743 | protein_coding | deleterious(0) | probably_damaging(1) | TCGA-D8-A1XK-01 | Breast | breast invasive carcinoma | Female | <65 | I/II | Chemotherapy | doxorubicine+cyclophosphamide | SD | |
| PRKCI | deletion | Frame_Shift_Del | novel | c.1551delN | p.Gly518AspfsTer12 | p.G518Dfs*12 | P41743 | protein_coding | TCGA-EW-A2FV-01 | Breast | breast invasive carcinoma | Female | <65 | III/IV | Chemotherapy | docetaxel | SD | ||
| PRKCI | SNV | Missense_Mutation | novel | c.238G>A | p.Val80Ile | p.V80I | P41743 | protein_coding | tolerated(1) | benign(0.024) | TCGA-2W-A8YY-01 | Cervix | cervical & endocervical cancer | Female | <65 | I/II | Chemotherapy | cisplatin | CR |
| PRKCI | SNV | Missense_Mutation | novel | c.697G>C | p.Glu233Gln | p.E233Q | P41743 | protein_coding | tolerated(0.1) | benign(0.003) | TCGA-DS-A1OB-01 | Cervix | cervical & endocervical cancer | Female | <65 | I/II | Chemotherapy | carboplatin | PD |
| PRKCI | SNV | Missense_Mutation | c.862N>C | p.Glu288Gln | p.E288Q | P41743 | protein_coding | tolerated(0.06) | possibly_damaging(0.837) | TCGA-EK-A2RC-01 | Cervix | cervical & endocervical cancer | Female | <65 | I/II | Unknown | Unknown | SD | |
| PRKCI | SNV | Missense_Mutation | c.318N>G | p.Phe106Leu | p.F106L | P41743 | protein_coding | tolerated(0.09) | probably_damaging(0.999) | TCGA-EK-A3GK-01 | Cervix | cervical & endocervical cancer | Female | <65 | I/II | Unknown | Unknown | SD | |
| PRKCI | SNV | Missense_Mutation | c.157N>C | p.Glu53Gln | p.E53Q | P41743 | protein_coding | tolerated(0.11) | possibly_damaging(0.751) | TCGA-JW-A5VL-01 | Cervix | cervical & endocervical cancer | Female | <65 | I/II | Unknown | Unknown | SD | |
| PRKCI | SNV | Missense_Mutation | c.1376N>T | p.Ser459Phe | p.S459F | P41743 | protein_coding | tolerated(0.06) | possibly_damaging(0.878) | TCGA-JW-A5VL-01 | Cervix | cervical & endocervical cancer | Female | <65 | I/II | Unknown | Unknown | SD | |
| PRKCI | SNV | Missense_Mutation | c.880G>A | p.Glu294Lys | p.E294K | P41743 | protein_coding | deleterious(0) | probably_damaging(0.999) | TCGA-MY-A5BD-01 | Cervix | cervical & endocervical cancer | Female | <65 | I/II | Chemotherapy | cisplatin | CR |
| Page: 1 2 3 4 5 6 7 8 9 |
Top |
Related drugs of malignant transformation related genes |
| Identification of chemicals and drugs interact with genes involved in malignant transfromation |
| (DGIdb 4.0) |
| Entrez ID | Symbol | Category | Interaction Types | Drug Claim Name | Drug Name | PMIDs |
| 5584 | PRKCI | KINASE, CLINICALLY ACTIONABLE, SERINE THREONINE KINASE, DRUGGABLE GENOME, ENZYME | GSK-269962A | GSK-269962A | ||
| 5584 | PRKCI | KINASE, CLINICALLY ACTIONABLE, SERINE THREONINE KINASE, DRUGGABLE GENOME, ENZYME | ILORASERTIB | ILORASERTIB | ||
| 5584 | PRKCI | KINASE, CLINICALLY ACTIONABLE, SERINE THREONINE KINASE, DRUGGABLE GENOME, ENZYME | inhibitor | CHEMBL608533 | MIDOSTAURIN | |
| 5584 | PRKCI | KINASE, CLINICALLY ACTIONABLE, SERINE THREONINE KINASE, DRUGGABLE GENOME, ENZYME | inhibitor | SOPHORETIN | QUERCETIN | |
| 5584 | PRKCI | KINASE, CLINICALLY ACTIONABLE, SERINE THREONINE KINASE, DRUGGABLE GENOME, ENZYME | inhibitor | CHEMBL3545332 | CEP-2563 | |
| 5584 | PRKCI | KINASE, CLINICALLY ACTIONABLE, SERINE THREONINE KINASE, DRUGGABLE GENOME, ENZYME | inhibitor | 135652717 | STAUROSPORINE | |
| 5584 | PRKCI | KINASE, CLINICALLY ACTIONABLE, SERINE THREONINE KINASE, DRUGGABLE GENOME, ENZYME | inhibitor | CHEMBL574737 | UCN-01 | |
| 5584 | PRKCI | KINASE, CLINICALLY ACTIONABLE, SERINE THREONINE KINASE, DRUGGABLE GENOME, ENZYME | SOTRASTAURIN | SOTRASTAURIN | ||
| 5584 | PRKCI | KINASE, CLINICALLY ACTIONABLE, SERINE THREONINE KINASE, DRUGGABLE GENOME, ENZYME | inhibitor | CHEMBL565612 | SOTRASTAURIN | |
| 5584 | PRKCI | KINASE, CLINICALLY ACTIONABLE, SERINE THREONINE KINASE, DRUGGABLE GENOME, ENZYME | INGENOL MEBUTATE |
| Page: 1 2 |

Copyright 2023-Present -The University of Texas Health Science Center at Houston |