
|
|||||
|
 | |
| |
| |
| |
| |
| |
|
Gene: PPP1CA |
Gene summary for PPP1CA |
| Gene information | Species | Human | Gene symbol | PPP1CA | Gene ID | 5499 |
| Gene name | protein phosphatase 1 catalytic subunit alpha | |
| Gene Alias | PP-1A | |
| Cytomap | 11q13.2 | |
| Gene Type | protein-coding | GO ID | GO:0000271 | UniProtAcc | A0A140VJS9 |
Top |
Malignant transformation analysis |
| Identification of the aberrant gene expression in precancerous and cancerous lesions by comparing the gene expression of stem-like cells in diseased tissues with normal stem cells |
| Entrez ID | Symbol | Replicates | Species | Organ | Tissue | Adj P-value | Log2FC | Malignancy |
| 5499 | PPP1CA | GSM4909282 | Human | Breast | IDC | 7.03e-40 | 7.46e-01 | -0.0288 |
| 5499 | PPP1CA | GSM4909285 | Human | Breast | IDC | 3.88e-15 | 4.79e-01 | 0.21 |
| 5499 | PPP1CA | GSM4909287 | Human | Breast | IDC | 1.13e-02 | 2.82e-01 | 0.2057 |
| 5499 | PPP1CA | GSM4909290 | Human | Breast | IDC | 6.01e-09 | 4.85e-01 | 0.2096 |
| 5499 | PPP1CA | GSM4909291 | Human | Breast | IDC | 4.12e-03 | 3.14e-01 | 0.1753 |
| 5499 | PPP1CA | GSM4909296 | Human | Breast | IDC | 3.77e-07 | 2.30e-01 | 0.1524 |
| 5499 | PPP1CA | GSM4909297 | Human | Breast | IDC | 2.42e-08 | -1.48e-01 | 0.1517 |
| 5499 | PPP1CA | GSM4909304 | Human | Breast | IDC | 1.63e-20 | 5.00e-01 | 0.1636 |
| 5499 | PPP1CA | GSM4909308 | Human | Breast | IDC | 2.57e-07 | 4.08e-01 | 0.158 |
| 5499 | PPP1CA | GSM4909309 | Human | Breast | IDC | 2.15e-06 | 2.44e-01 | 0.0483 |
| 5499 | PPP1CA | GSM4909311 | Human | Breast | IDC | 4.45e-19 | -6.46e-02 | 0.1534 |
| 5499 | PPP1CA | GSM4909312 | Human | Breast | IDC | 3.19e-15 | 4.03e-01 | 0.1552 |
| 5499 | PPP1CA | GSM4909313 | Human | Breast | IDC | 5.79e-03 | 7.62e-02 | 0.0391 |
| 5499 | PPP1CA | GSM4909317 | Human | Breast | IDC | 1.19e-11 | 4.81e-01 | 0.1355 |
| 5499 | PPP1CA | GSM4909318 | Human | Breast | IDC | 6.39e-09 | 6.11e-01 | 0.2031 |
| 5499 | PPP1CA | GSM4909319 | Human | Breast | IDC | 2.09e-33 | 6.30e-02 | 0.1563 |
| 5499 | PPP1CA | GSM4909320 | Human | Breast | IDC | 2.38e-10 | 2.28e-01 | 0.1575 |
| 5499 | PPP1CA | GSM4909321 | Human | Breast | IDC | 1.72e-14 | 2.65e-01 | 0.1559 |
| 5499 | PPP1CA | brca1 | Human | Breast | Precancer | 3.83e-26 | 5.92e-01 | -0.0338 |
| 5499 | PPP1CA | brca2 | Human | Breast | Precancer | 3.61e-08 | 3.79e-01 | -0.024 |
| Page: 1 2 3 4 5 6 7 8 9 10 11 |
| Tissue | Expression Dynamics | Abbreviation |
| Breast | 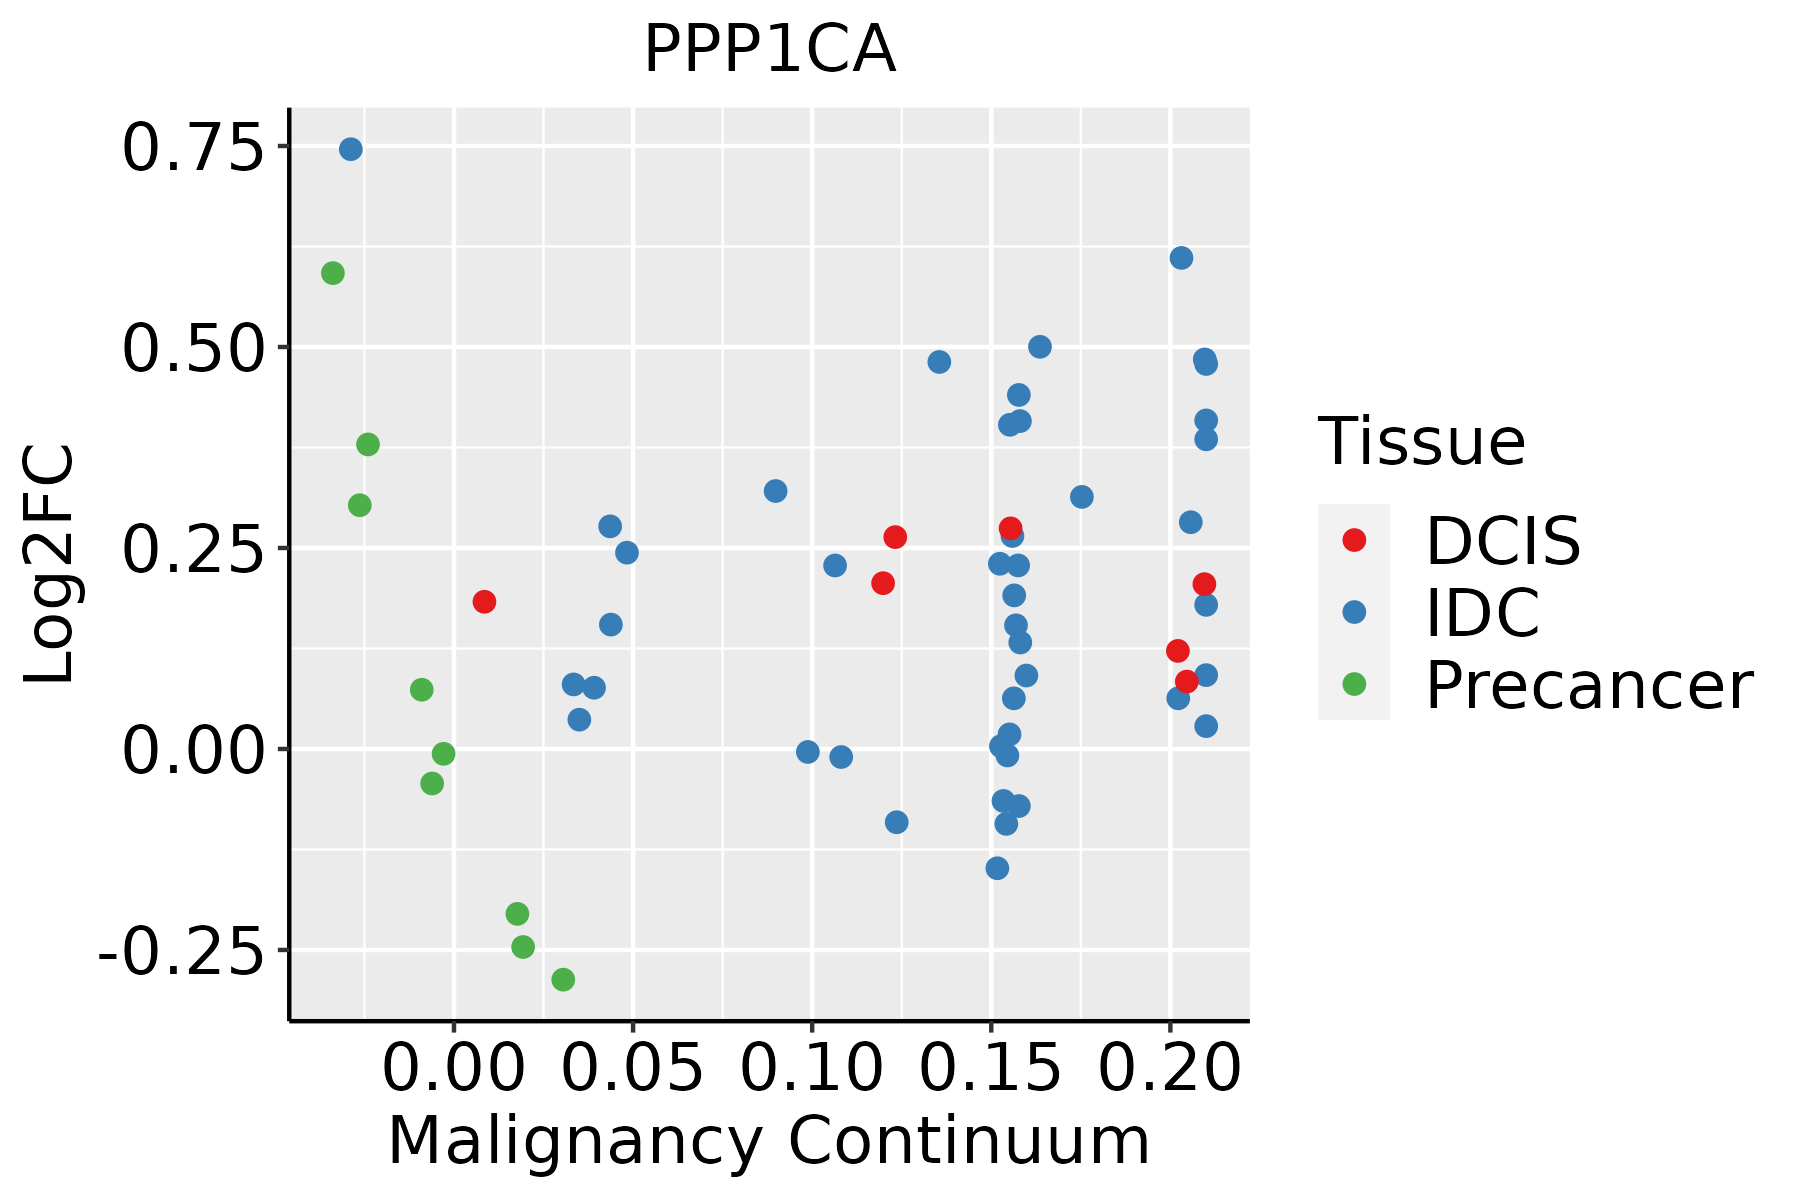 | IDC: Invasive ductal carcinoma |
| DCIS: Ductal carcinoma in situ | ||
| Precancer(BRCA1-mut): Precancerous lesion from BRCA1 mutation carriers | ||
| Endometrium |  | AEH: Atypical endometrial hyperplasia |
| EEC: Endometrioid Cancer | ||
| Esophagus |  | ESCC: Esophageal squamous cell carcinoma |
| HGIN: High-grade intraepithelial neoplasias | ||
| LGIN: Low-grade intraepithelial neoplasias | ||
| GC | 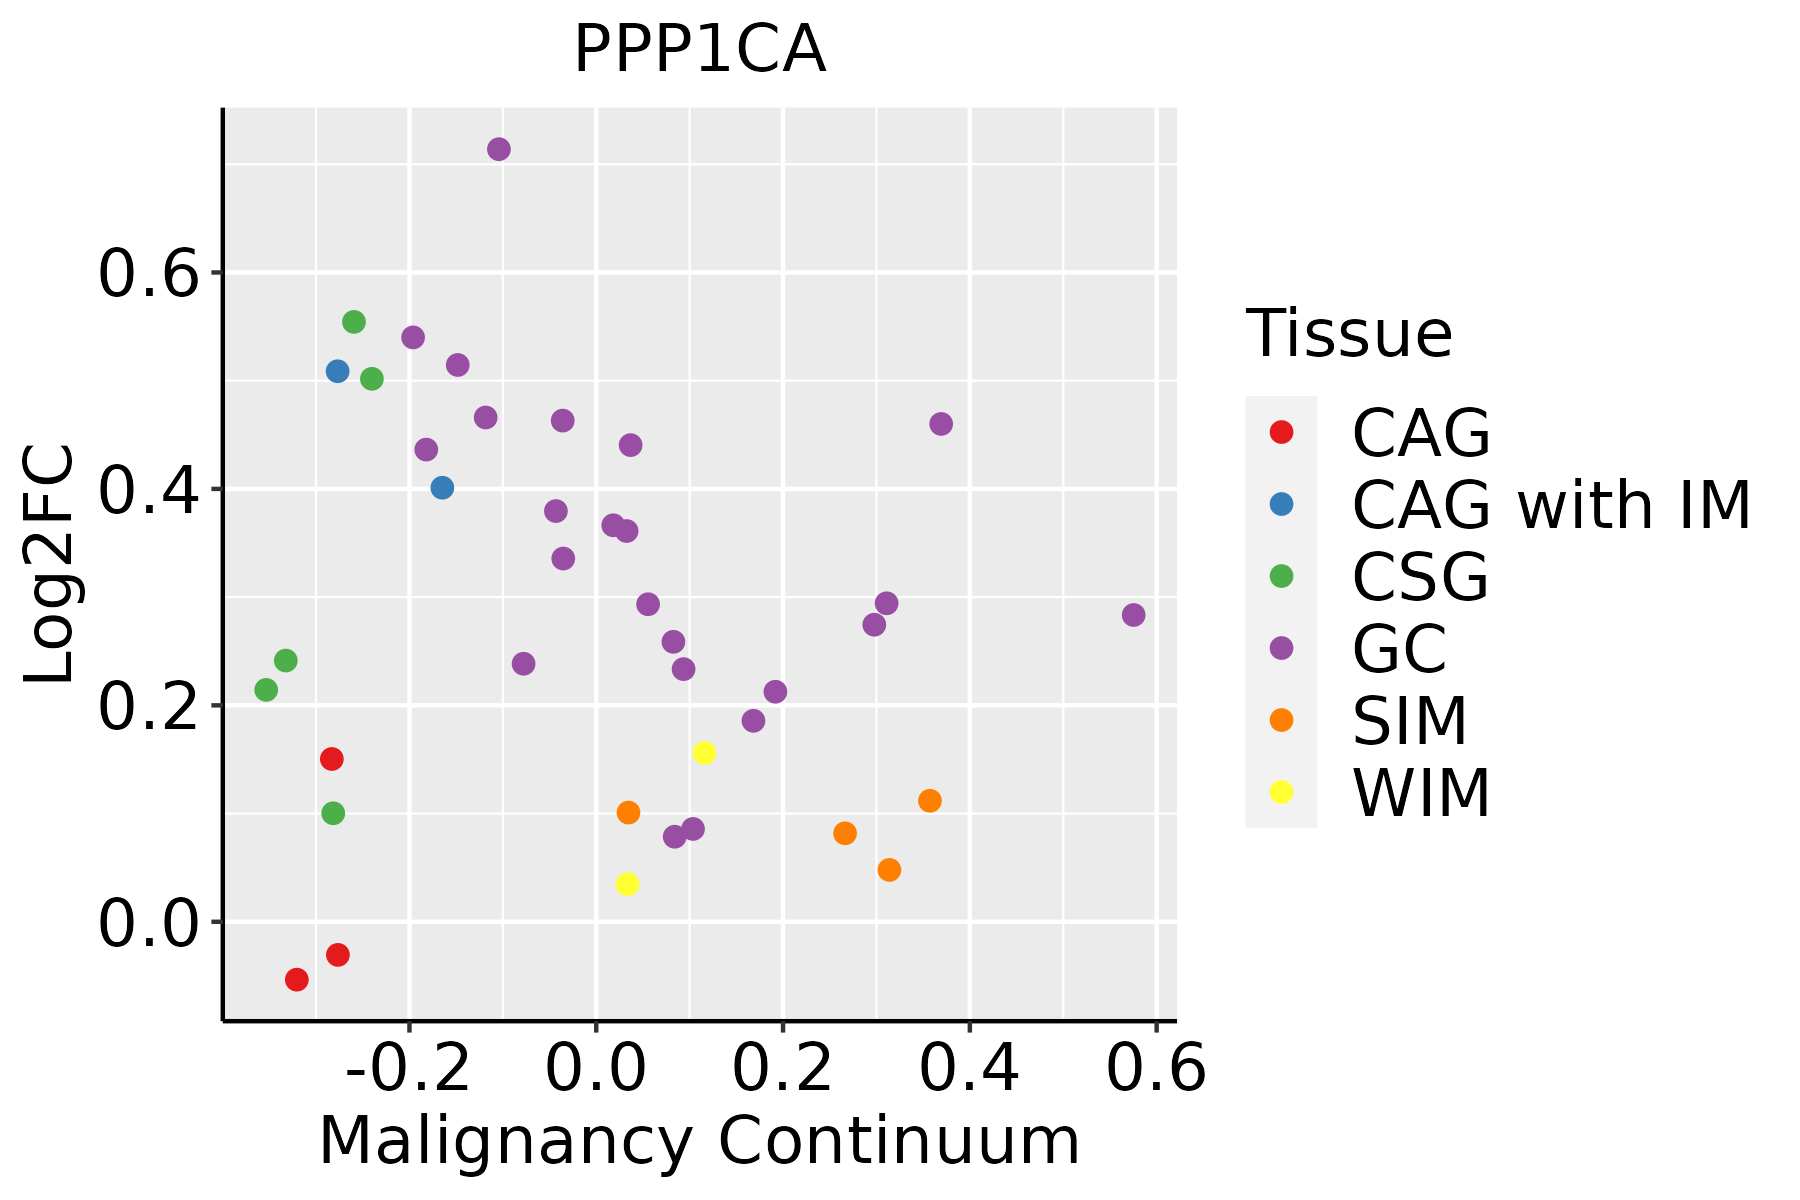 | CAG: Chronic atrophic gastritis |
| CAG with IM: Chronic atrophic gastritis with intestinal metaplasia | ||
| CSG: Chronic superficial gastritis | ||
| GC: Gastric cancer | ||
| SIM: Severe intestinal metaplasia | ||
| WIM: Wild intestinal metaplasia | ||
| Liver |  | HCC: Hepatocellular carcinoma |
| NAFLD: Non-alcoholic fatty liver disease | ||
| Oral Cavity | 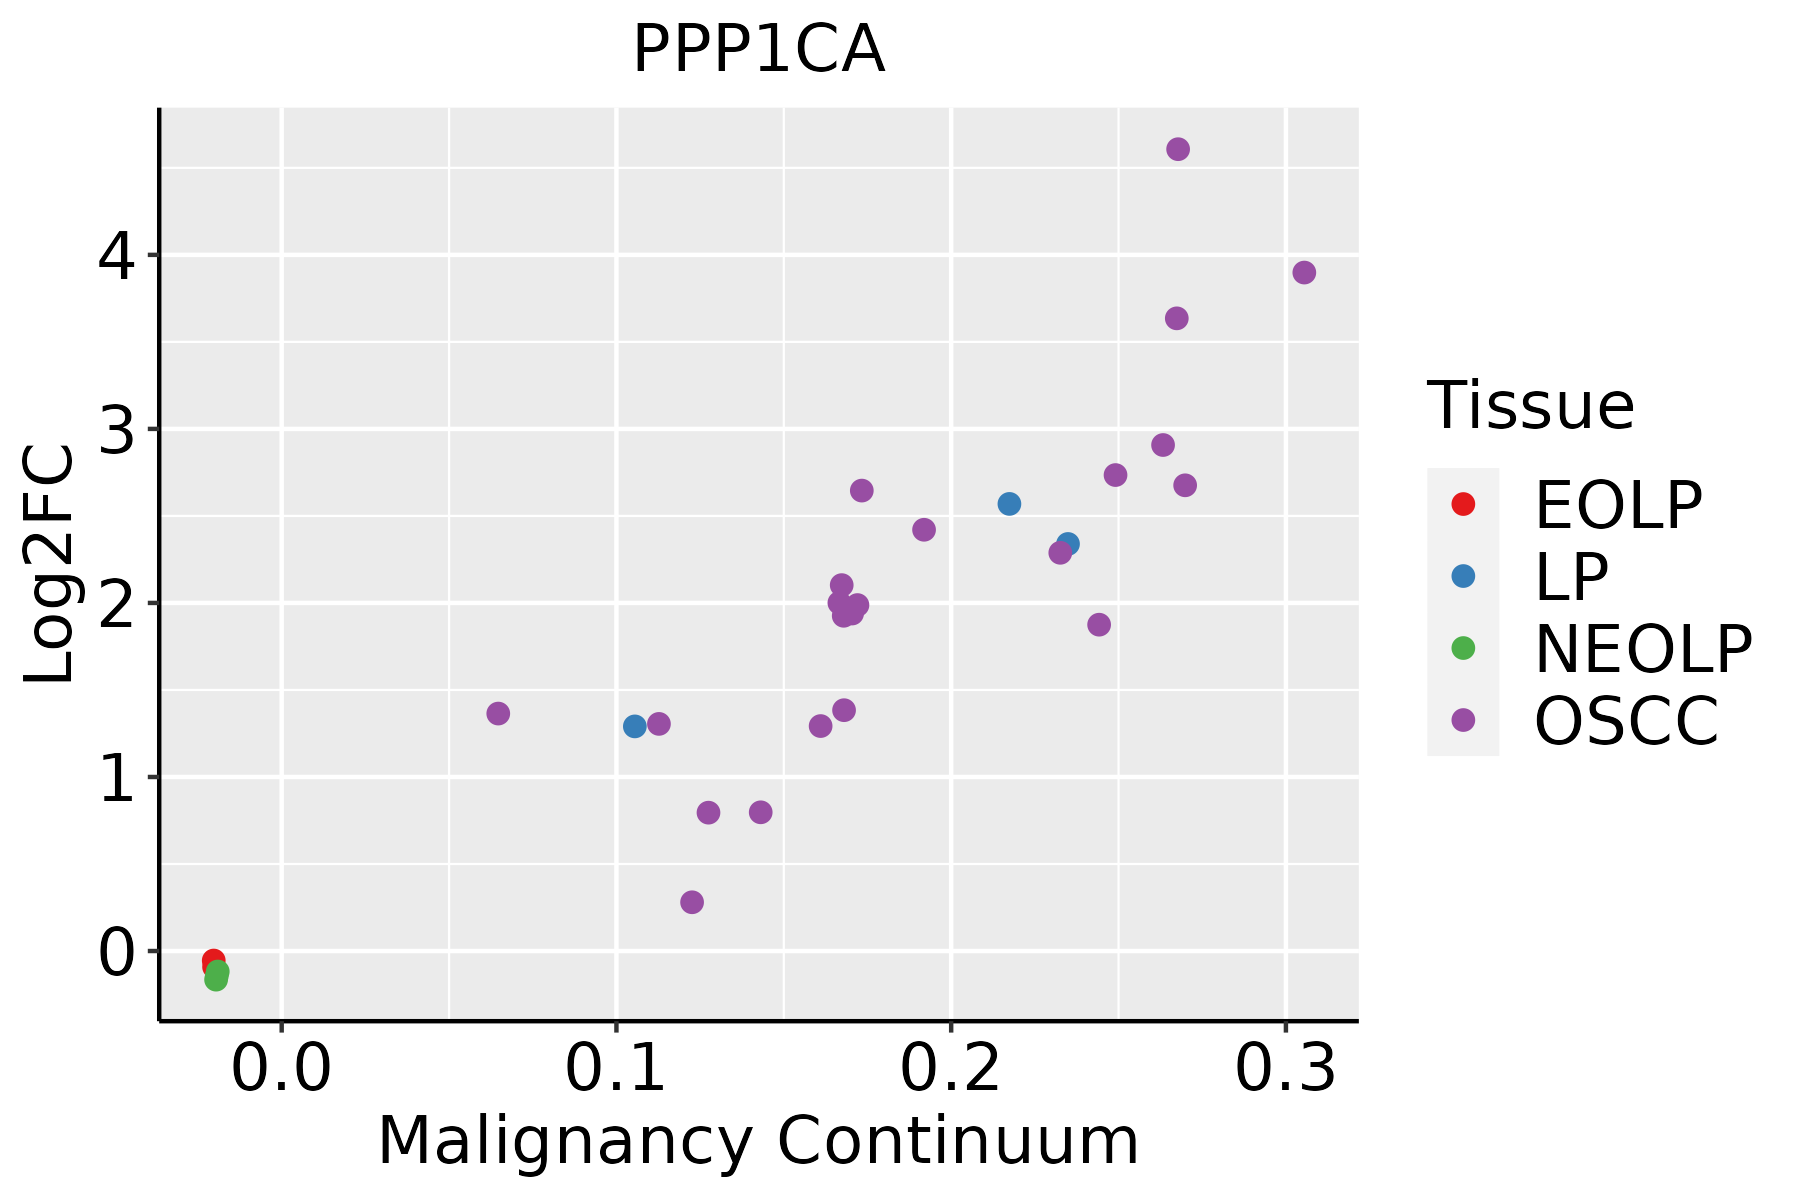 | EOLP: Erosive Oral lichen planus |
| LP: leukoplakia | ||
| NEOLP: Non-erosive oral lichen planus | ||
| OSCC: Oral squamous cell carcinoma | ||
| Prostate | 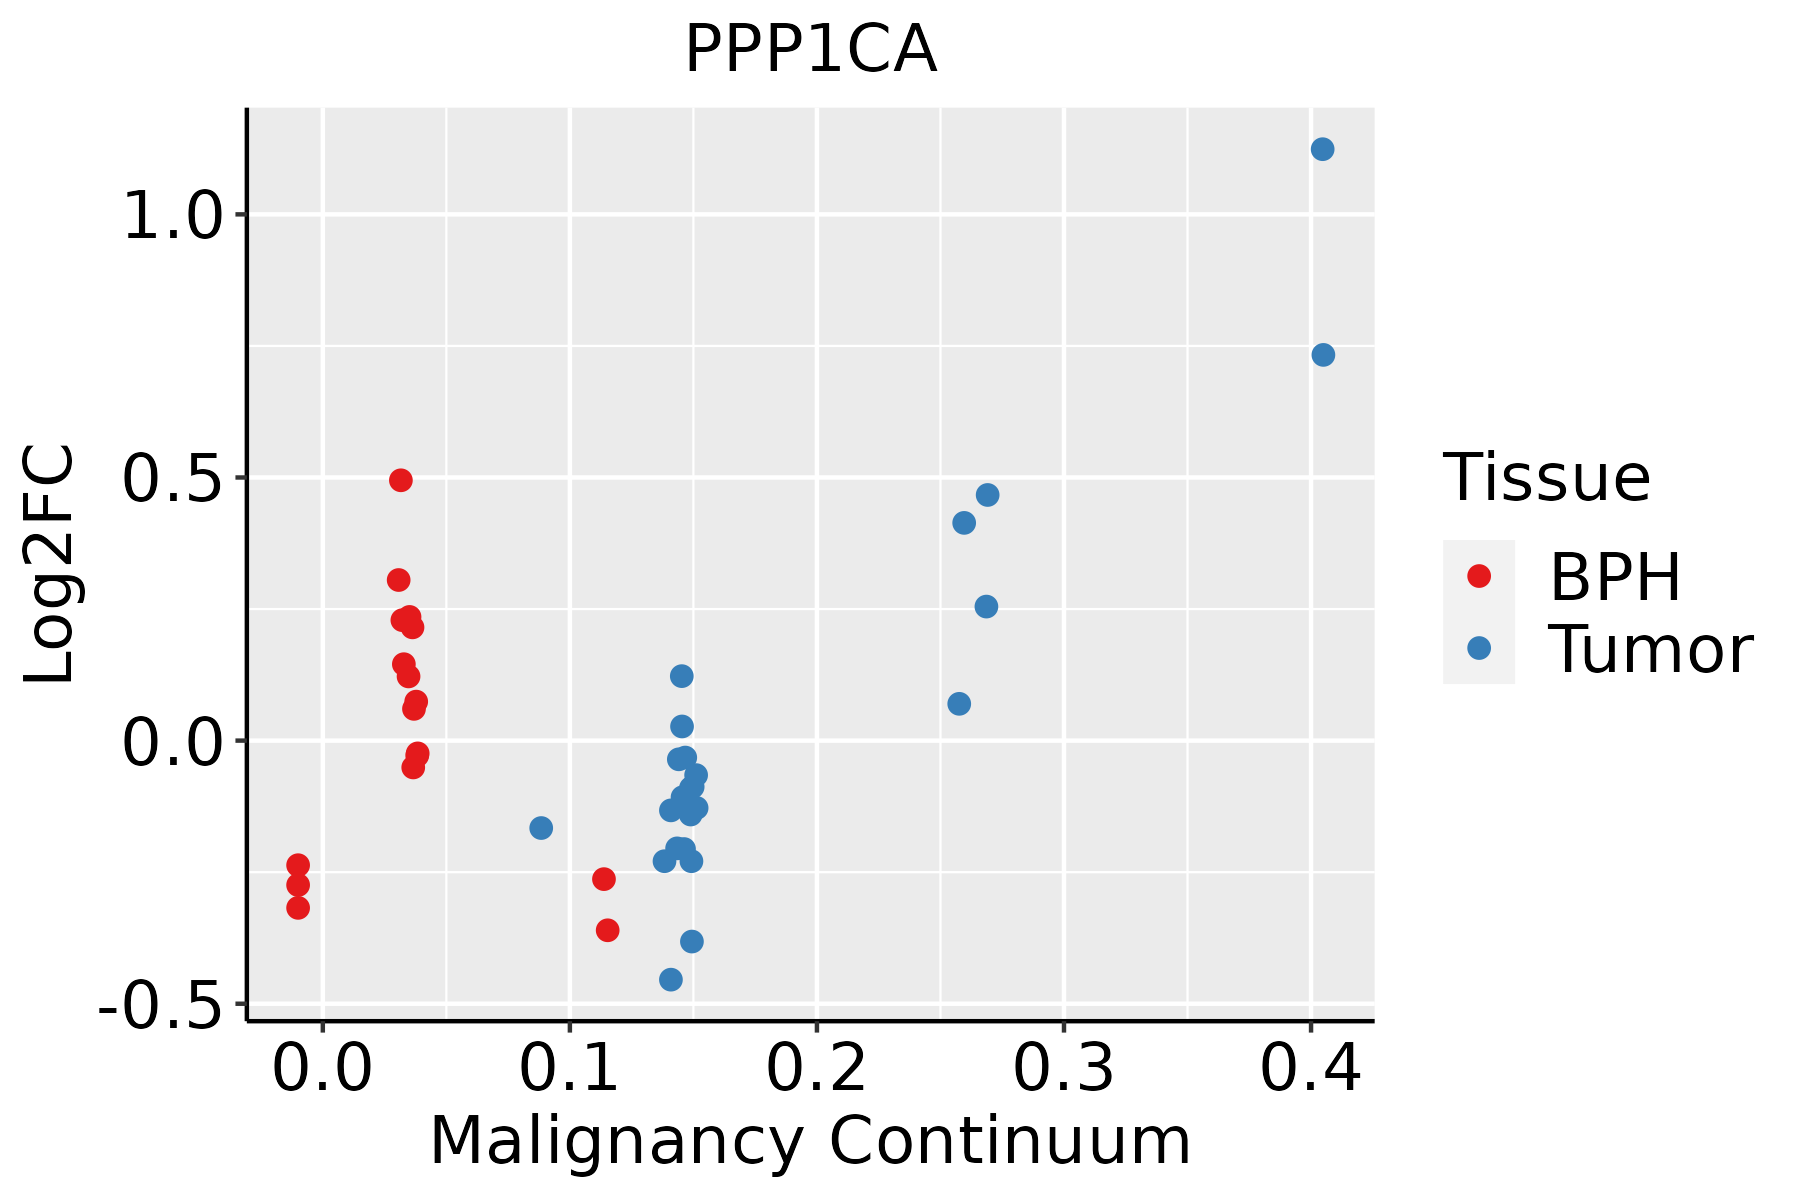 | BPH: Benign Prostatic Hyperplasia |
| Skin | 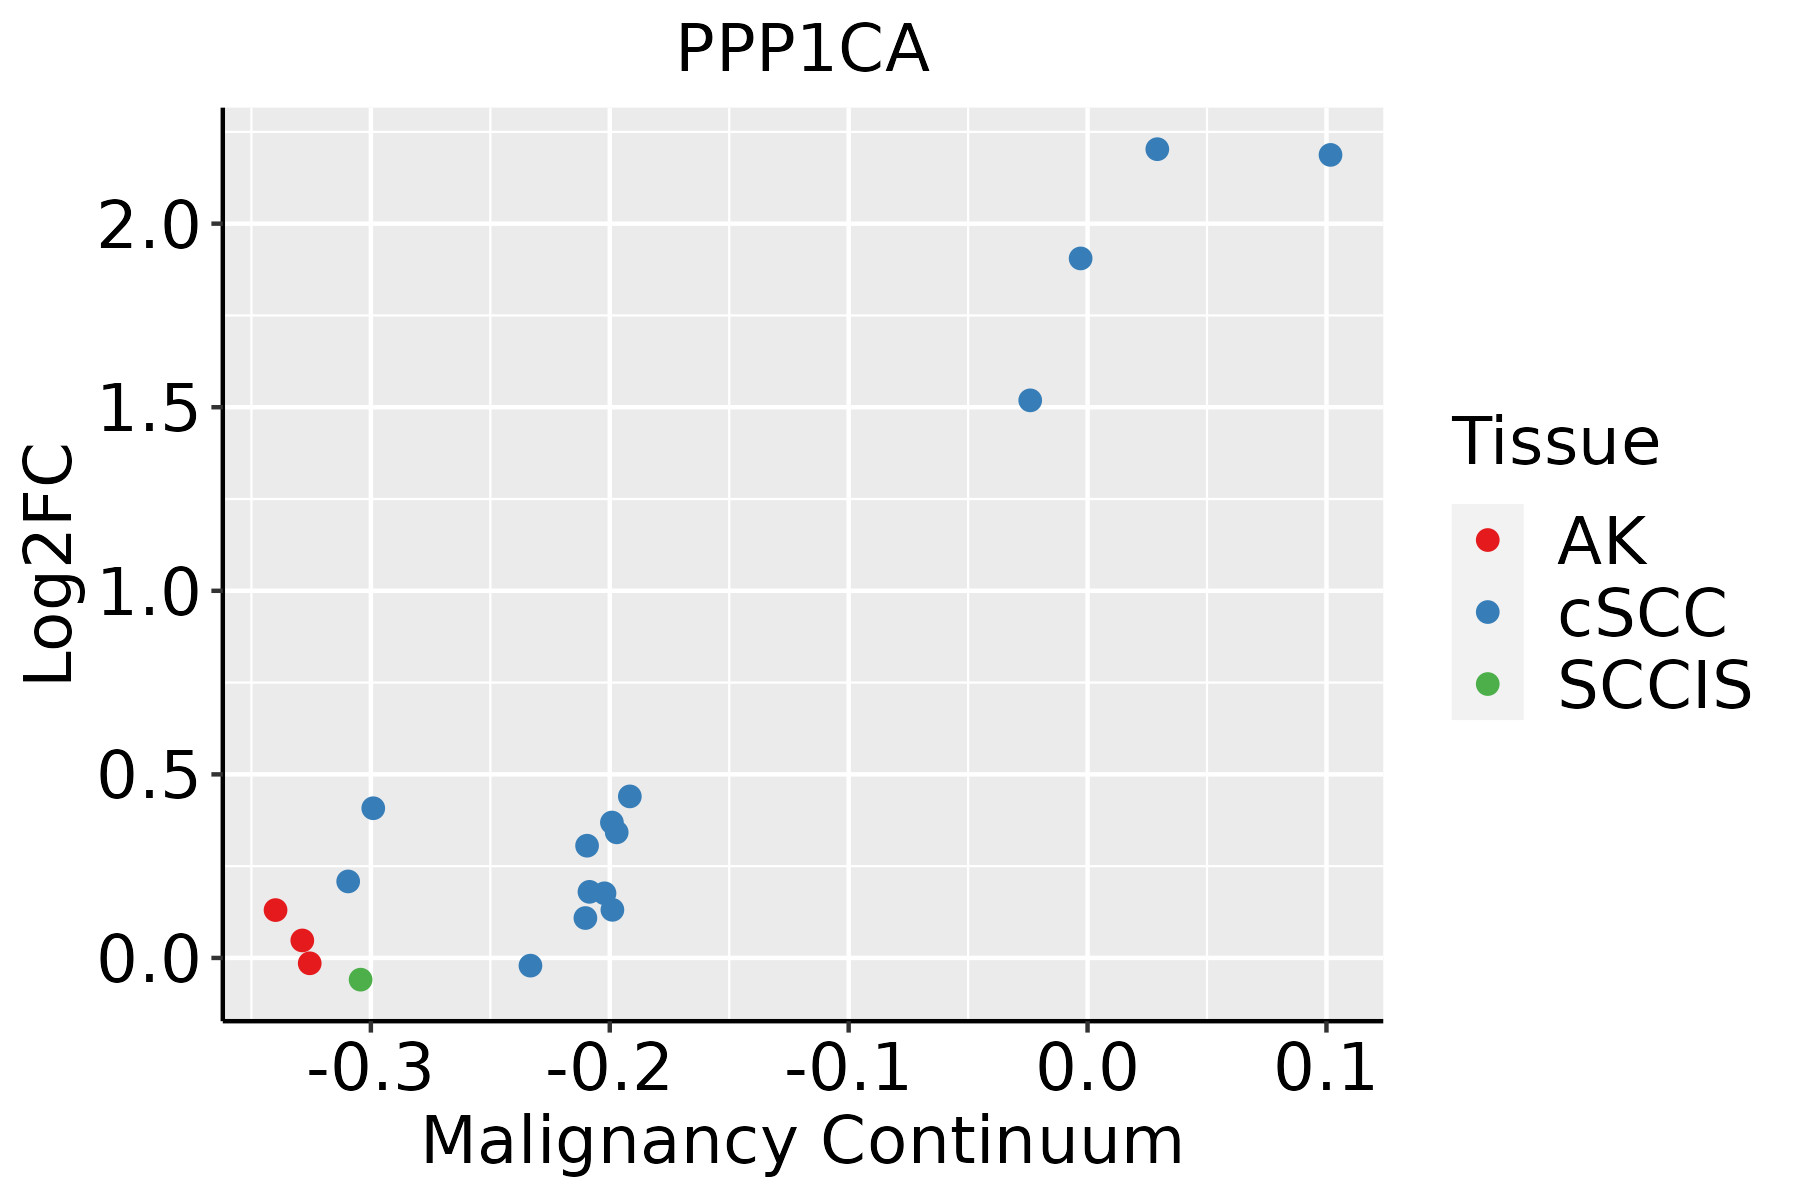 | AK: Actinic keratosis |
| cSCC: Cutaneous squamous cell carcinoma | ||
| SCCIS:squamous cell carcinoma in situ | ||
| Thyroid | 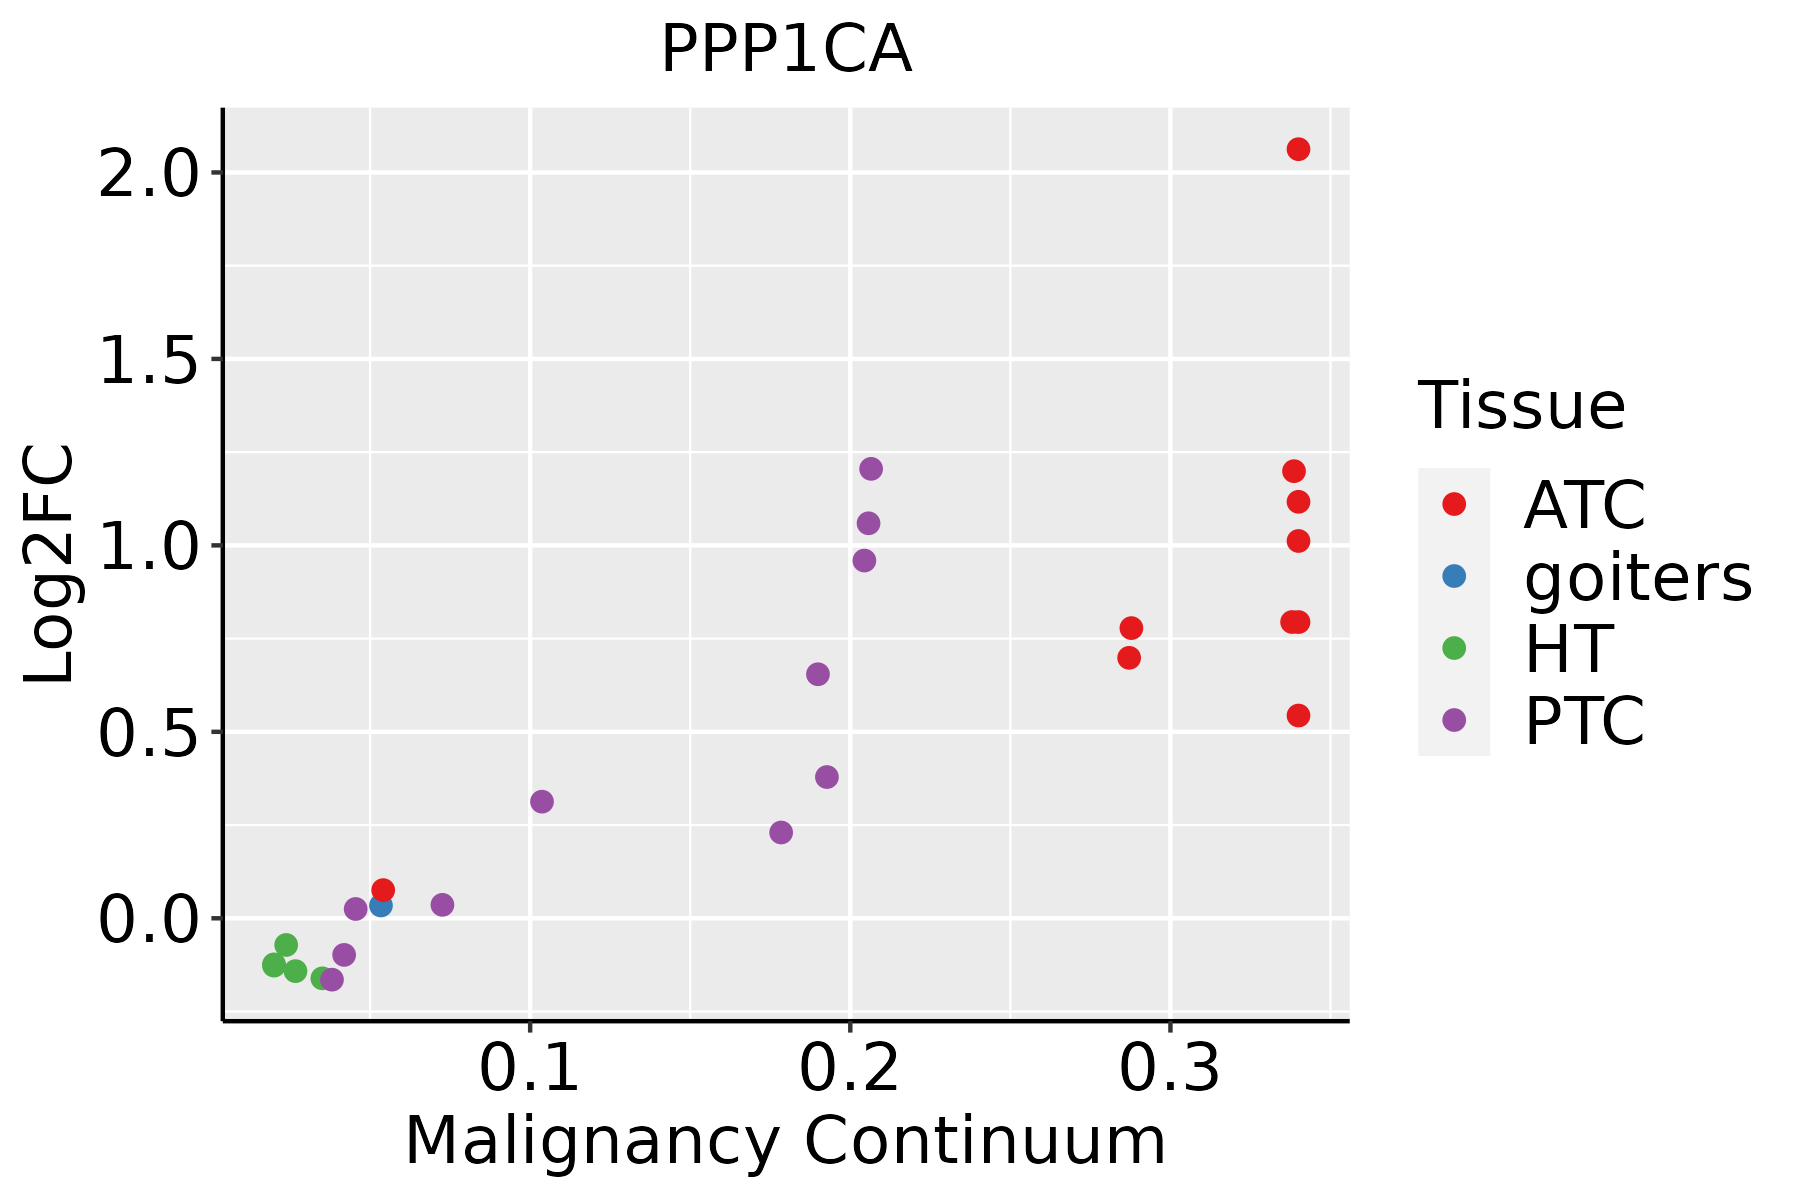 | ATC: Anaplastic thyroid cancer |
| HT: Hashimoto's thyroiditis | ||
| PTC: Papillary thyroid cancer |
| ∗log2FC in expression of this searched gene in stem-like cells from each diseased tissue sample relative to stem-like cells in normal samples in each tissue plotted against the malignancy continuum. Samples are colored based on if they are from different disease stage. |
Top |
Malignant transformation related pathway analysis |
| Find out the enriched GO biological processes and KEGG pathways involved in transition from healthy to precancer to cancer |
| Tissue | Disease Stage | Enriched GO biological Processes |
| Colorectum | AD |  |
| Colorectum | SER |  |
| Colorectum | MSS |  |
| Colorectum | MSI-H |  |
| Colorectum | FAP |  |
| ∗Top 15 enriched GO BP terms are showed in the bar plot of each disease state in each tissue. Each row represents a significant GO biological process which is colored according to the -log10(p.adjust). |
| Page: 1 2 3 4 5 6 7 8 9 |
| GO ID | Tissue | Disease Stage | Description | Gene Ratio | Bg Ratio | pvalue | p.adjust | Count |
| GO:001003820 | Oral cavity | OSCC | response to metal ion | 188/7305 | 373/18723 | 4.34e-06 | 5.00e-05 | 188 |
| GO:00320919 | Oral cavity | OSCC | negative regulation of protein binding | 57/7305 | 94/18723 | 1.75e-05 | 1.71e-04 | 57 |
| GO:003011110 | Oral cavity | OSCC | regulation of Wnt signaling pathway | 165/7305 | 328/18723 | 1.87e-05 | 1.80e-04 | 165 |
| GO:00435584 | Oral cavity | OSCC | regulation of translational initiation in response to stress | 13/7305 | 14/18723 | 4.31e-05 | 3.71e-04 | 13 |
| GO:000762316 | Oral cavity | OSCC | circadian rhythm | 110/7305 | 210/18723 | 5.40e-05 | 4.48e-04 | 110 |
| GO:00094164 | Oral cavity | OSCC | response to light stimulus | 159/7305 | 320/18723 | 5.98e-05 | 4.92e-04 | 159 |
| GO:00702623 | Oral cavity | OSCC | peptidyl-serine dephosphorylation | 16/7305 | 19/18723 | 7.05e-05 | 5.60e-04 | 16 |
| GO:005110019 | Oral cavity | OSCC | negative regulation of binding | 87/7305 | 162/18723 | 1.00e-04 | 7.54e-04 | 87 |
| GO:006082810 | Oral cavity | OSCC | regulation of canonical Wnt signaling pathway | 128/7305 | 253/18723 | 1.11e-04 | 8.16e-04 | 128 |
| GO:00303238 | Oral cavity | OSCC | respiratory tube development | 95/7305 | 181/18723 | 1.53e-04 | 1.07e-03 | 95 |
| GO:00059968 | Oral cavity | OSCC | monosaccharide metabolic process | 129/7305 | 257/18723 | 1.63e-04 | 1.13e-03 | 129 |
| GO:004346716 | Oral cavity | OSCC | regulation of generation of precursor metabolites and energy | 71/7305 | 130/18723 | 2.15e-04 | 1.41e-03 | 71 |
| GO:006007010 | Oral cavity | OSCC | canonical Wnt signaling pathway | 148/7305 | 303/18723 | 2.89e-04 | 1.82e-03 | 148 |
| GO:00193188 | Oral cavity | OSCC | hexose metabolic process | 118/7305 | 237/18723 | 4.53e-04 | 2.73e-03 | 118 |
| GO:00303248 | Oral cavity | OSCC | lung development | 91/7305 | 177/18723 | 5.18e-04 | 3.01e-03 | 91 |
| GO:00359702 | Oral cavity | OSCC | peptidyl-threonine dephosphorylation | 13/7305 | 16/18723 | 7.05e-04 | 3.89e-03 | 13 |
| GO:00329229 | Oral cavity | OSCC | circadian regulation of gene expression | 40/7305 | 68/18723 | 7.28e-04 | 3.98e-03 | 40 |
| GO:00060068 | Oral cavity | OSCC | glucose metabolic process | 98/7305 | 196/18723 | 1.10e-03 | 5.63e-03 | 98 |
| GO:20012393 | Oral cavity | OSCC | regulation of extrinsic apoptotic signaling pathway in absence of ligand | 27/7305 | 43/18723 | 1.35e-03 | 6.62e-03 | 27 |
| GO:00605416 | Oral cavity | OSCC | respiratory system development | 100/7305 | 203/18723 | 1.83e-03 | 8.60e-03 | 100 |
| Page: 1 2 3 4 5 6 7 8 9 10 11 12 13 14 15 16 17 18 19 20 21 22 23 24 25 26 27 28 29 30 31 32 33 34 35 36 37 38 39 |
| Pathway ID | Tissue | Disease Stage | Description | Gene Ratio | Bg Ratio | pvalue | p.adjust | qvalue | Count |
| hsa0541518 | Breast | Precancer | Diabetic cardiomyopathy | 63/684 | 203/8465 | 5.63e-22 | 1.48e-20 | 1.14e-20 | 63 |
| hsa042189 | Breast | Precancer | Cellular senescence | 29/684 | 156/8465 | 1.66e-05 | 1.69e-04 | 1.30e-04 | 29 |
| hsa0520514 | Breast | Precancer | Proteoglycans in cancer | 30/684 | 205/8465 | 1.00e-03 | 7.18e-03 | 5.50e-03 | 30 |
| hsa05031 | Breast | Precancer | Amphetamine addiction | 14/684 | 69/8465 | 1.05e-03 | 7.35e-03 | 5.63e-03 | 14 |
| hsa0541519 | Breast | Precancer | Diabetic cardiomyopathy | 63/684 | 203/8465 | 5.63e-22 | 1.48e-20 | 1.14e-20 | 63 |
| hsa0421814 | Breast | Precancer | Cellular senescence | 29/684 | 156/8465 | 1.66e-05 | 1.69e-04 | 1.30e-04 | 29 |
| hsa0520515 | Breast | Precancer | Proteoglycans in cancer | 30/684 | 205/8465 | 1.00e-03 | 7.18e-03 | 5.50e-03 | 30 |
| hsa050311 | Breast | Precancer | Amphetamine addiction | 14/684 | 69/8465 | 1.05e-03 | 7.35e-03 | 5.63e-03 | 14 |
| hsa0541523 | Breast | IDC | Diabetic cardiomyopathy | 67/867 | 203/8465 | 3.17e-19 | 8.59e-18 | 6.43e-18 | 67 |
| hsa0421824 | Breast | IDC | Cellular senescence | 35/867 | 156/8465 | 5.49e-06 | 7.43e-05 | 5.56e-05 | 35 |
| hsa0520523 | Breast | IDC | Proteoglycans in cancer | 42/867 | 205/8465 | 7.69e-06 | 9.99e-05 | 7.48e-05 | 42 |
| hsa050312 | Breast | IDC | Amphetamine addiction | 18/867 | 69/8465 | 1.42e-04 | 1.36e-03 | 1.01e-03 | 18 |
| hsa0481014 | Breast | IDC | Regulation of actin cytoskeleton | 36/867 | 229/8465 | 5.79e-03 | 3.13e-02 | 2.34e-02 | 36 |
| hsa045109 | Breast | IDC | Focal adhesion | 32/867 | 203/8465 | 8.60e-03 | 4.23e-02 | 3.17e-02 | 32 |
| hsa0541533 | Breast | IDC | Diabetic cardiomyopathy | 67/867 | 203/8465 | 3.17e-19 | 8.59e-18 | 6.43e-18 | 67 |
| hsa0421834 | Breast | IDC | Cellular senescence | 35/867 | 156/8465 | 5.49e-06 | 7.43e-05 | 5.56e-05 | 35 |
| hsa0520533 | Breast | IDC | Proteoglycans in cancer | 42/867 | 205/8465 | 7.69e-06 | 9.99e-05 | 7.48e-05 | 42 |
| hsa050313 | Breast | IDC | Amphetamine addiction | 18/867 | 69/8465 | 1.42e-04 | 1.36e-03 | 1.01e-03 | 18 |
| hsa0481015 | Breast | IDC | Regulation of actin cytoskeleton | 36/867 | 229/8465 | 5.79e-03 | 3.13e-02 | 2.34e-02 | 36 |
| hsa0451013 | Breast | IDC | Focal adhesion | 32/867 | 203/8465 | 8.60e-03 | 4.23e-02 | 3.17e-02 | 32 |
| Page: 1 2 3 4 5 6 7 8 9 10 |
Top |
Cell-cell communication analysis |
| Identification of potential cell-cell interactions between two cell types and their ligand-receptor pairs for different disease states |
| Ligand | Receptor | LRpair | Pathway | Tissue | Disease Stage |
| Page: 1 |
Top |
Single-cell gene regulatory network inference analysis |
| Find out the significant the regulons (TFs) and the target genes of each regulon across cell types for different disease states |
| TF | Cell Type | Tissue | Disease Stage | Target Gene | RSS | Regulon Activity |
| ∗The dot plots of a searched regulon are shown for all cell subpopulations in each disease state of each tissue based on the regulon specific score inferred using pySCENIC and by calculating the average expression. |
| Page: 1 |
Top |
Somatic mutation of malignant transformation related genes |
| Annotation of somatic variants for genes involved in malignant transformation |
| Hugo Symbol | Variant Class | Variant Classification | dbSNP RS | HGVSc | HGVSp | HGVSp Short | SWISSPROT | BIOTYPE | SIFT | PolyPhen | Tumor Sample Barcode | Tissue | Histology | Sex | Age | Stage | Therapy Types | Drugs | Outcome |
| PPP1CA | insertion | In_Frame_Ins | novel | c.223_224insGACCCAGAAGCTCCAAGTTAC | p.Asp75delinsGlyProArgSerSerLysLeuHis | p.D75delinsGPRSSKLH | P62136 | protein_coding | TCGA-A8-A09Z-01 | Breast | breast invasive carcinoma | Female | >=65 | I/II | Unknown | Unknown | SD | ||
| PPP1CA | insertion | Frame_Shift_Ins | novel | c.221_222insCGGGAAGATCCCT | p.Asp75GlyfsTer5 | p.D75Gfs*5 | P62136 | protein_coding | TCGA-A8-A09Z-01 | Breast | breast invasive carcinoma | Female | >=65 | I/II | Unknown | Unknown | SD | ||
| PPP1CA | insertion | Frame_Shift_Ins | novel | c.348_349insGGAGT | p.Leu117GlyfsTer61 | p.L117Gfs*61 | P62136 | protein_coding | TCGA-BH-A0B9-01 | Breast | breast invasive carcinoma | Female | <65 | I/II | Chemotherapy | cyclophosphamide | SD | ||
| PPP1CA | insertion | Frame_Shift_Ins | novel | c.347_348insTTTCTTTACTTTTTTGAGA | p.Leu117PhefsTer12 | p.L117Ffs*12 | P62136 | protein_coding | TCGA-BH-A0B9-01 | Breast | breast invasive carcinoma | Female | <65 | I/II | Chemotherapy | cyclophosphamide | SD | ||
| PPP1CA | deletion | Frame_Shift_Del | novel | c.620delC | p.Pro207LeufsTer56 | p.P207Lfs*56 | P62136 | protein_coding | TCGA-EW-A2FV-01 | Breast | breast invasive carcinoma | Female | <65 | III/IV | Chemotherapy | docetaxel | SD | ||
| PPP1CA | SNV | Missense_Mutation | c.461N>A | p.Arg154His | p.R154H | P62136 | protein_coding | deleterious_low_confidence(0) | probably_damaging(0.966) | TCGA-AA-3950-01 | Colorectum | colon adenocarcinoma | Female | >=65 | I/II | Unknown | Unknown | SD | |
| PPP1CA | SNV | Missense_Mutation | novel | c.441N>A | p.Phe147Leu | p.F147L | P62136 | protein_coding | deleterious_low_confidence(0) | possibly_damaging(0.727) | TCGA-AA-A010-01 | Colorectum | colon adenocarcinoma | Female | <65 | I/II | Chemotherapy | folinic | CR |
| PPP1CA | SNV | Missense_Mutation | c.848N>G | p.Tyr283Cys | p.Y283C | P62136 | protein_coding | deleterious_low_confidence(0.02) | probably_damaging(1) | TCGA-AD-6964-01 | Colorectum | colon adenocarcinoma | Male | <65 | III/IV | Chemotherapy | folfox | PD | |
| PPP1CA | SNV | Missense_Mutation | novel | c.379N>A | p.Glu127Lys | p.E127K | P62136 | protein_coding | deleterious_low_confidence(0.01) | benign(0.057) | TCGA-A5-A0G2-01 | Endometrium | uterine corpus endometrioid carcinoma | Female | <65 | III/IV | Unknown | Unknown | SD |
| PPP1CA | SNV | Missense_Mutation | rs774510465 | c.931N>A | p.Asp311Asn | p.D311N | P62136 | protein_coding | deleterious_low_confidence(0.05) | benign(0) | TCGA-A5-A2K5-01 | Endometrium | uterine corpus endometrioid carcinoma | Female | >=65 | I/II | Unknown | Unknown | SD |
| Page: 1 2 3 4 |
Top |
Related drugs of malignant transformation related genes |
| Identification of chemicals and drugs interact with genes involved in malignant transfromation |
| (DGIdb 4.0) |
| Entrez ID | Symbol | Category | Interaction Types | Drug Claim Name | Drug Name | PMIDs |
| 5499 | PPP1CA | KINASE, DRUGGABLE GENOME, PROTEIN PHOSPHATASE | CANTHARIDIN | CANTHARIDIN | ||
| 5499 | PPP1CA | KINASE, DRUGGABLE GENOME, PROTEIN PHOSPHATASE | DEMETHYL-CANTHARIDIN | DEMETHYL-CANTHARIDIN | ||
| 5499 | PPP1CA | KINASE, DRUGGABLE GENOME, PROTEIN PHOSPHATASE | DNDI1417601 | CHEMBL1503729 |
| Page: 1 |

Copyright 2023-Present -The University of Texas Health Science Center at Houston |