
|
|||||
|
 | |
| |
| |
| |
| |
| |
|
Gene: NUDT2 |
Gene summary for NUDT2 |
| Gene information | Species | Human | Gene symbol | NUDT2 | Gene ID | 318 |
| Gene name | nudix hydrolase 2 | |
| Gene Alias | APAH1 | |
| Cytomap | 9p13.3 | |
| Gene Type | protein-coding | GO ID | GO:0006139 | UniProtAcc | P50583 |
Top |
Malignant transformation analysis |
| Identification of the aberrant gene expression in precancerous and cancerous lesions by comparing the gene expression of stem-like cells in diseased tissues with normal stem cells |
| Entrez ID | Symbol | Replicates | Species | Organ | Tissue | Adj P-value | Log2FC | Malignancy |
| 318 | NUDT2 | LZE3D | Human | Esophagus | HGIN | 4.85e-03 | 4.08e-01 | 0.0668 |
| 318 | NUDT2 | LZE4T | Human | Esophagus | ESCC | 1.23e-06 | 6.46e-02 | 0.0811 |
| 318 | NUDT2 | LZE5T | Human | Esophagus | ESCC | 3.17e-02 | 1.03e-01 | 0.0514 |
| 318 | NUDT2 | LZE7T | Human | Esophagus | ESCC | 1.15e-06 | 3.58e-01 | 0.0667 |
| 318 | NUDT2 | LZE8T | Human | Esophagus | ESCC | 1.67e-03 | -2.15e-02 | 0.067 |
| 318 | NUDT2 | LZE22T | Human | Esophagus | ESCC | 2.29e-04 | 2.12e-01 | 0.068 |
| 318 | NUDT2 | LZE24T | Human | Esophagus | ESCC | 3.74e-13 | 3.46e-01 | 0.0596 |
| 318 | NUDT2 | LZE6T | Human | Esophagus | ESCC | 6.23e-04 | 1.04e-01 | 0.0845 |
| 318 | NUDT2 | P1T-E | Human | Esophagus | ESCC | 5.05e-04 | 1.71e-01 | 0.0875 |
| 318 | NUDT2 | P2T-E | Human | Esophagus | ESCC | 6.12e-23 | 3.88e-01 | 0.1177 |
| 318 | NUDT2 | P4T-E | Human | Esophagus | ESCC | 5.78e-10 | 2.55e-01 | 0.1323 |
| 318 | NUDT2 | P5T-E | Human | Esophagus | ESCC | 2.16e-15 | 3.05e-01 | 0.1327 |
| 318 | NUDT2 | P8T-E | Human | Esophagus | ESCC | 3.84e-15 | 1.32e-01 | 0.0889 |
| 318 | NUDT2 | P9T-E | Human | Esophagus | ESCC | 1.41e-19 | 3.75e-01 | 0.1131 |
| 318 | NUDT2 | P10T-E | Human | Esophagus | ESCC | 8.45e-19 | 3.24e-01 | 0.116 |
| 318 | NUDT2 | P11T-E | Human | Esophagus | ESCC | 2.96e-06 | 3.85e-01 | 0.1426 |
| 318 | NUDT2 | P12T-E | Human | Esophagus | ESCC | 4.41e-23 | 4.01e-01 | 0.1122 |
| 318 | NUDT2 | P15T-E | Human | Esophagus | ESCC | 4.22e-12 | 9.11e-02 | 0.1149 |
| 318 | NUDT2 | P16T-E | Human | Esophagus | ESCC | 1.50e-17 | 3.05e-01 | 0.1153 |
| 318 | NUDT2 | P17T-E | Human | Esophagus | ESCC | 7.37e-11 | 2.92e-01 | 0.1278 |
| Page: 1 2 3 4 5 6 |
| Tissue | Expression Dynamics | Abbreviation |
| Esophagus | 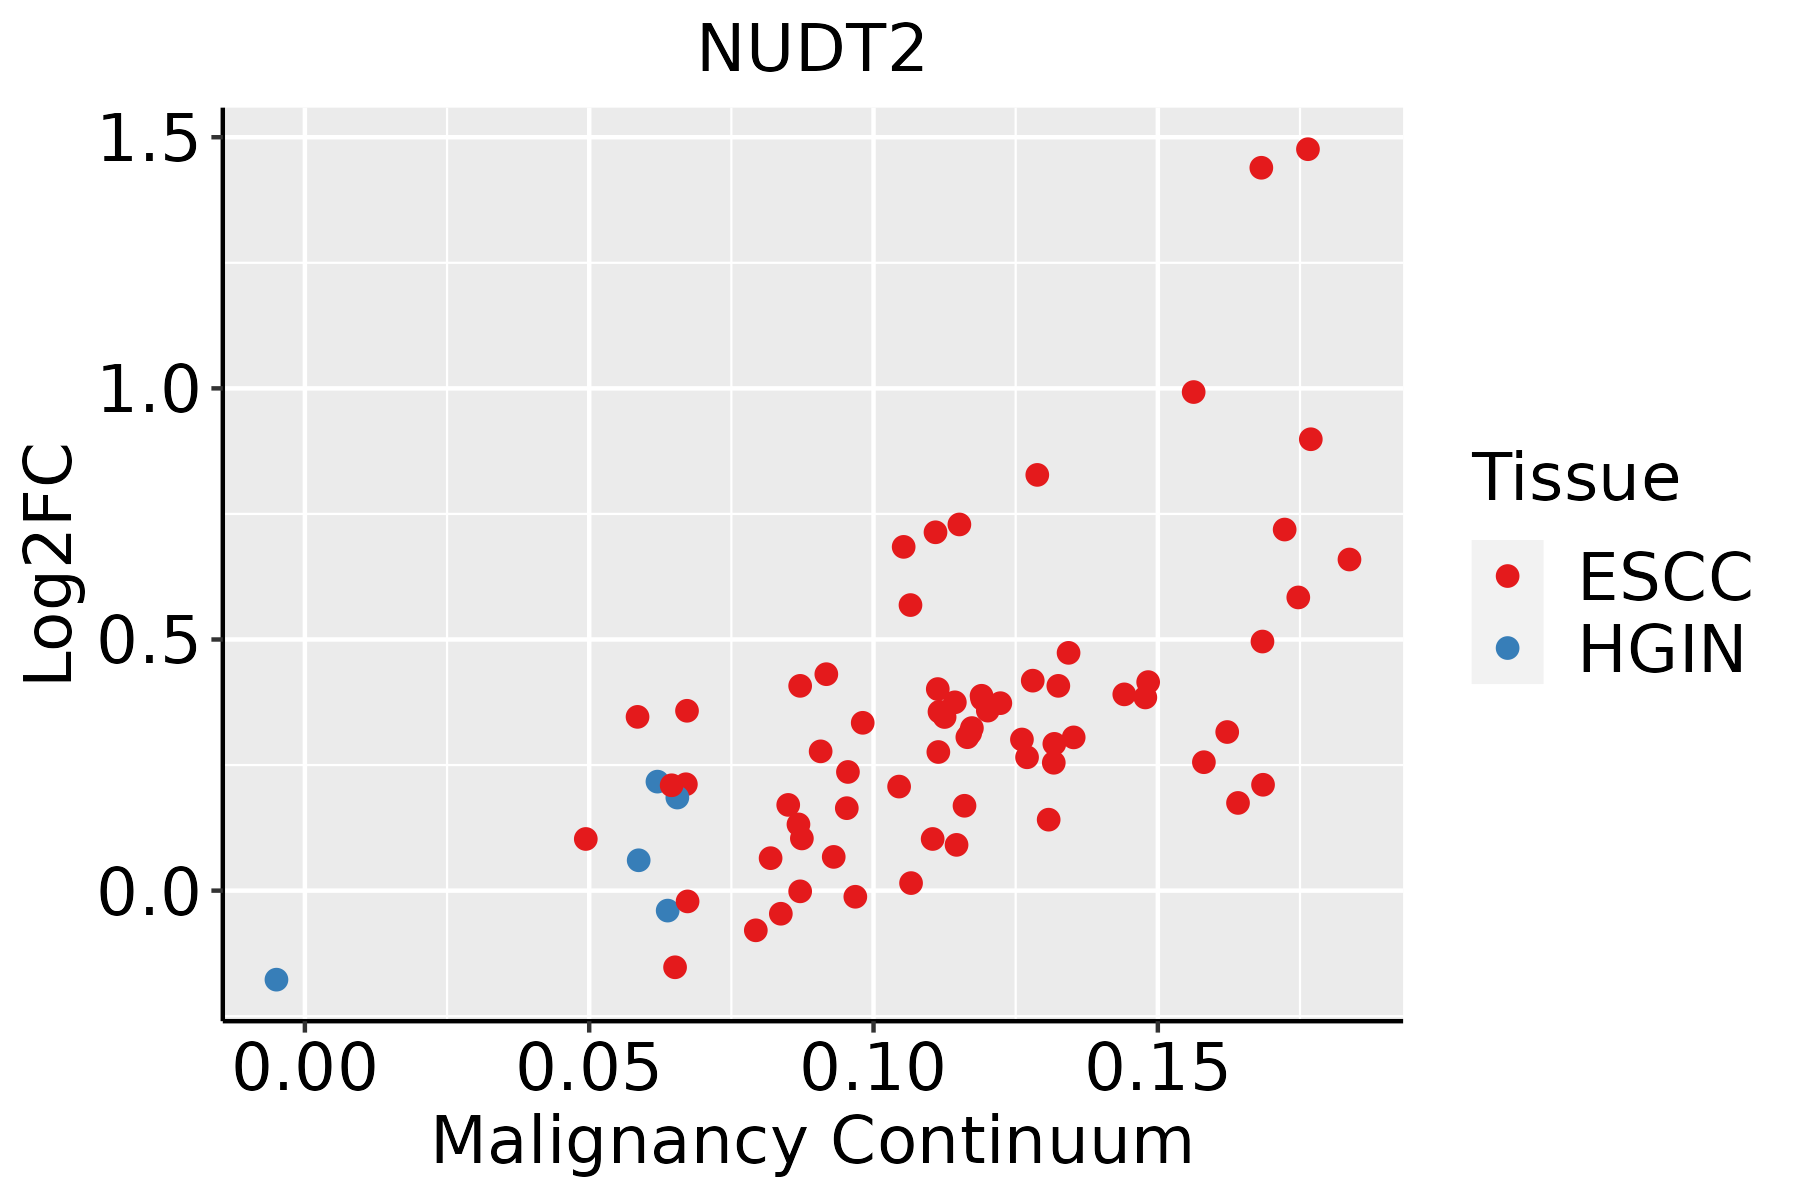 | ESCC: Esophageal squamous cell carcinoma |
| HGIN: High-grade intraepithelial neoplasias | ||
| LGIN: Low-grade intraepithelial neoplasias | ||
| Liver | 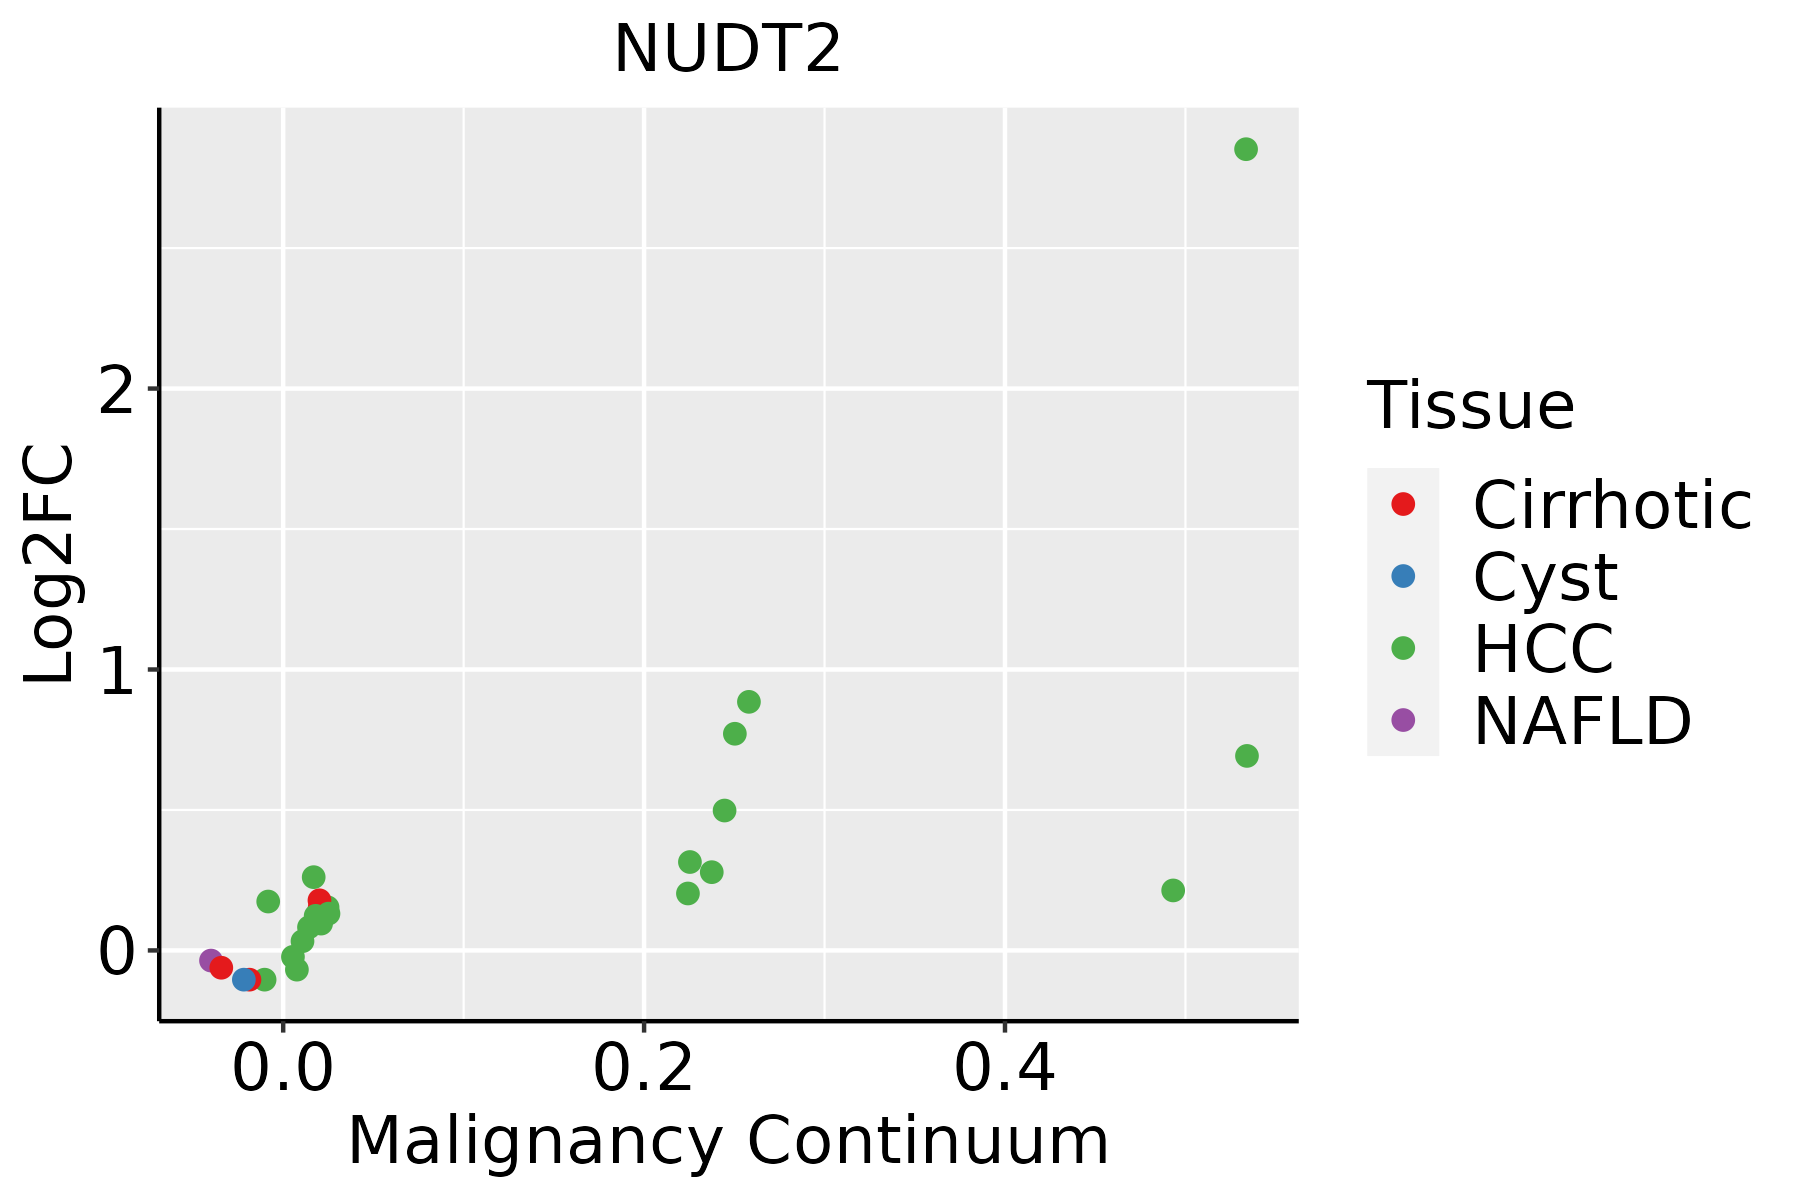 | HCC: Hepatocellular carcinoma |
| NAFLD: Non-alcoholic fatty liver disease | ||
| Oral Cavity |  | EOLP: Erosive Oral lichen planus |
| LP: leukoplakia | ||
| NEOLP: Non-erosive oral lichen planus | ||
| OSCC: Oral squamous cell carcinoma | ||
| Prostate | 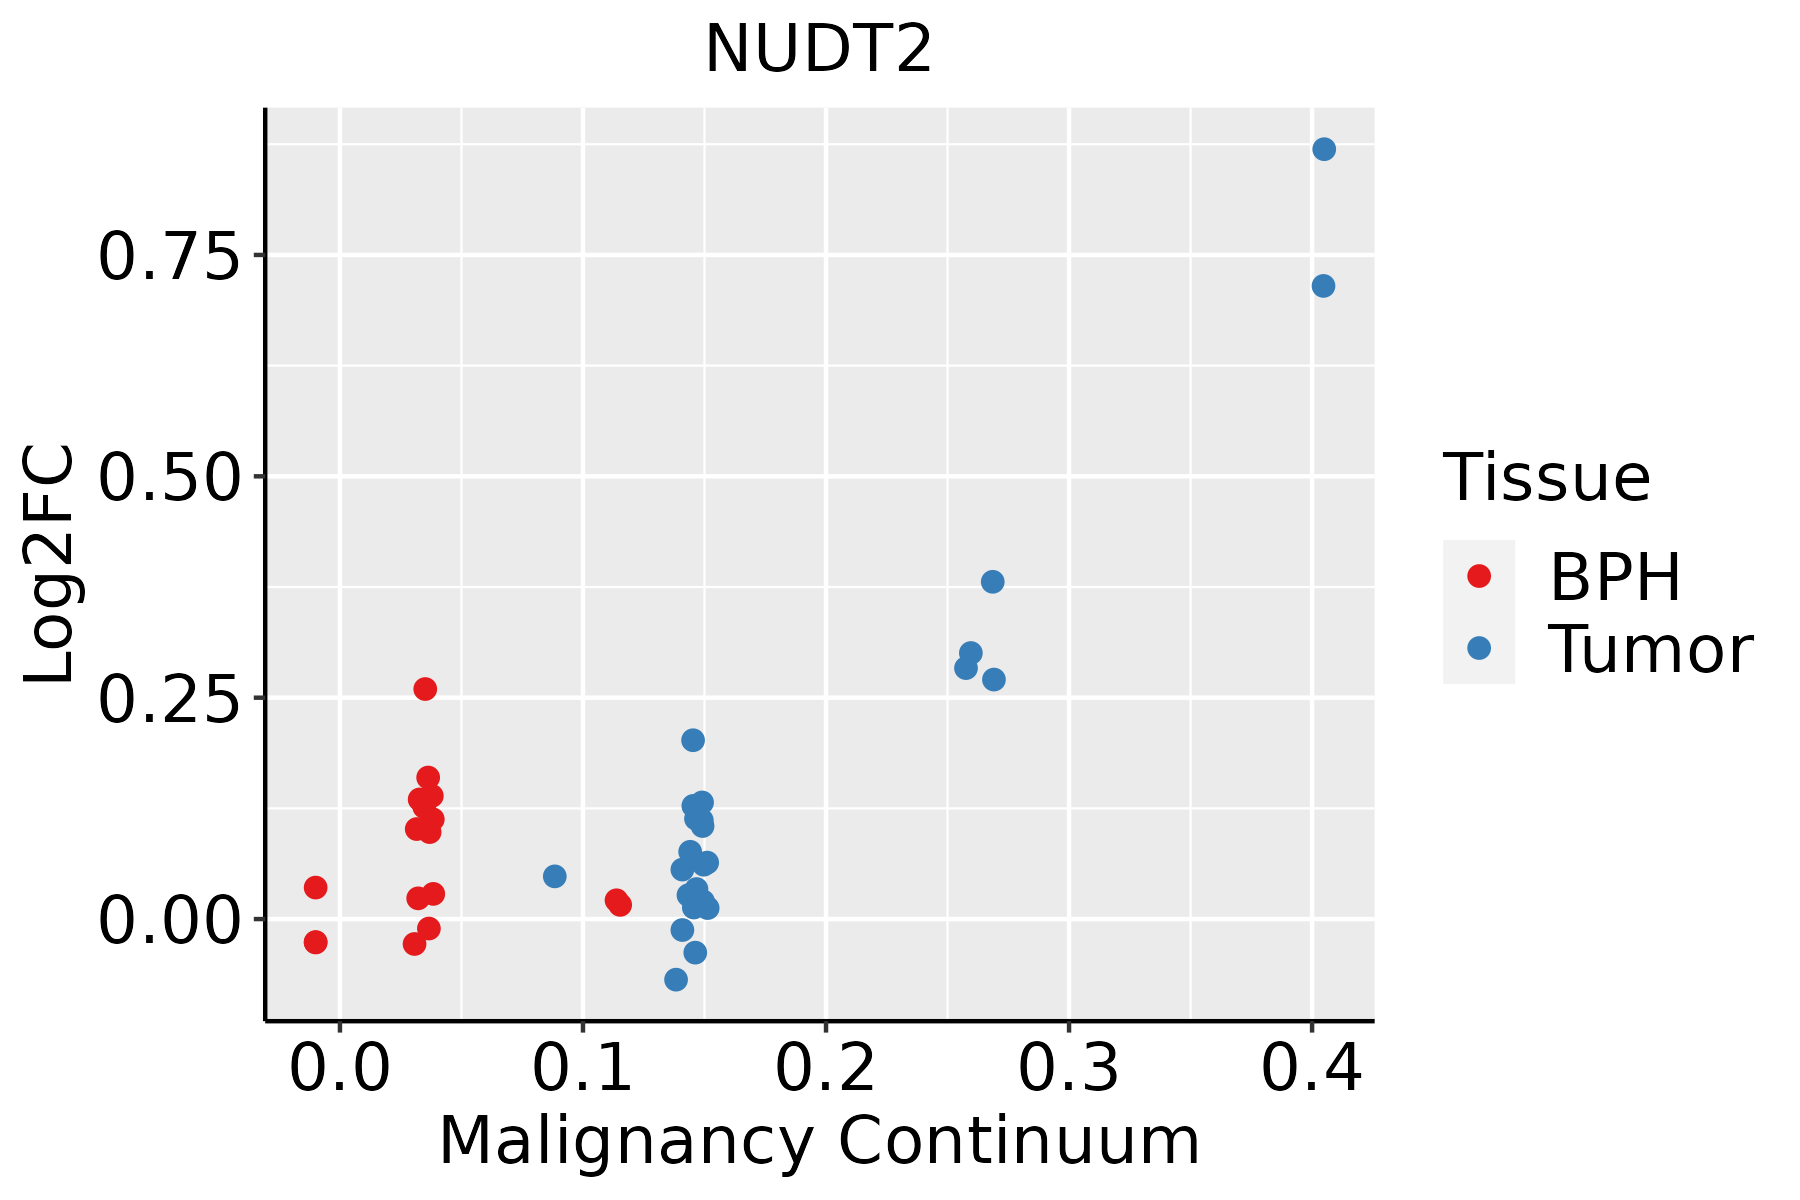 | BPH: Benign Prostatic Hyperplasia |
| Thyroid | 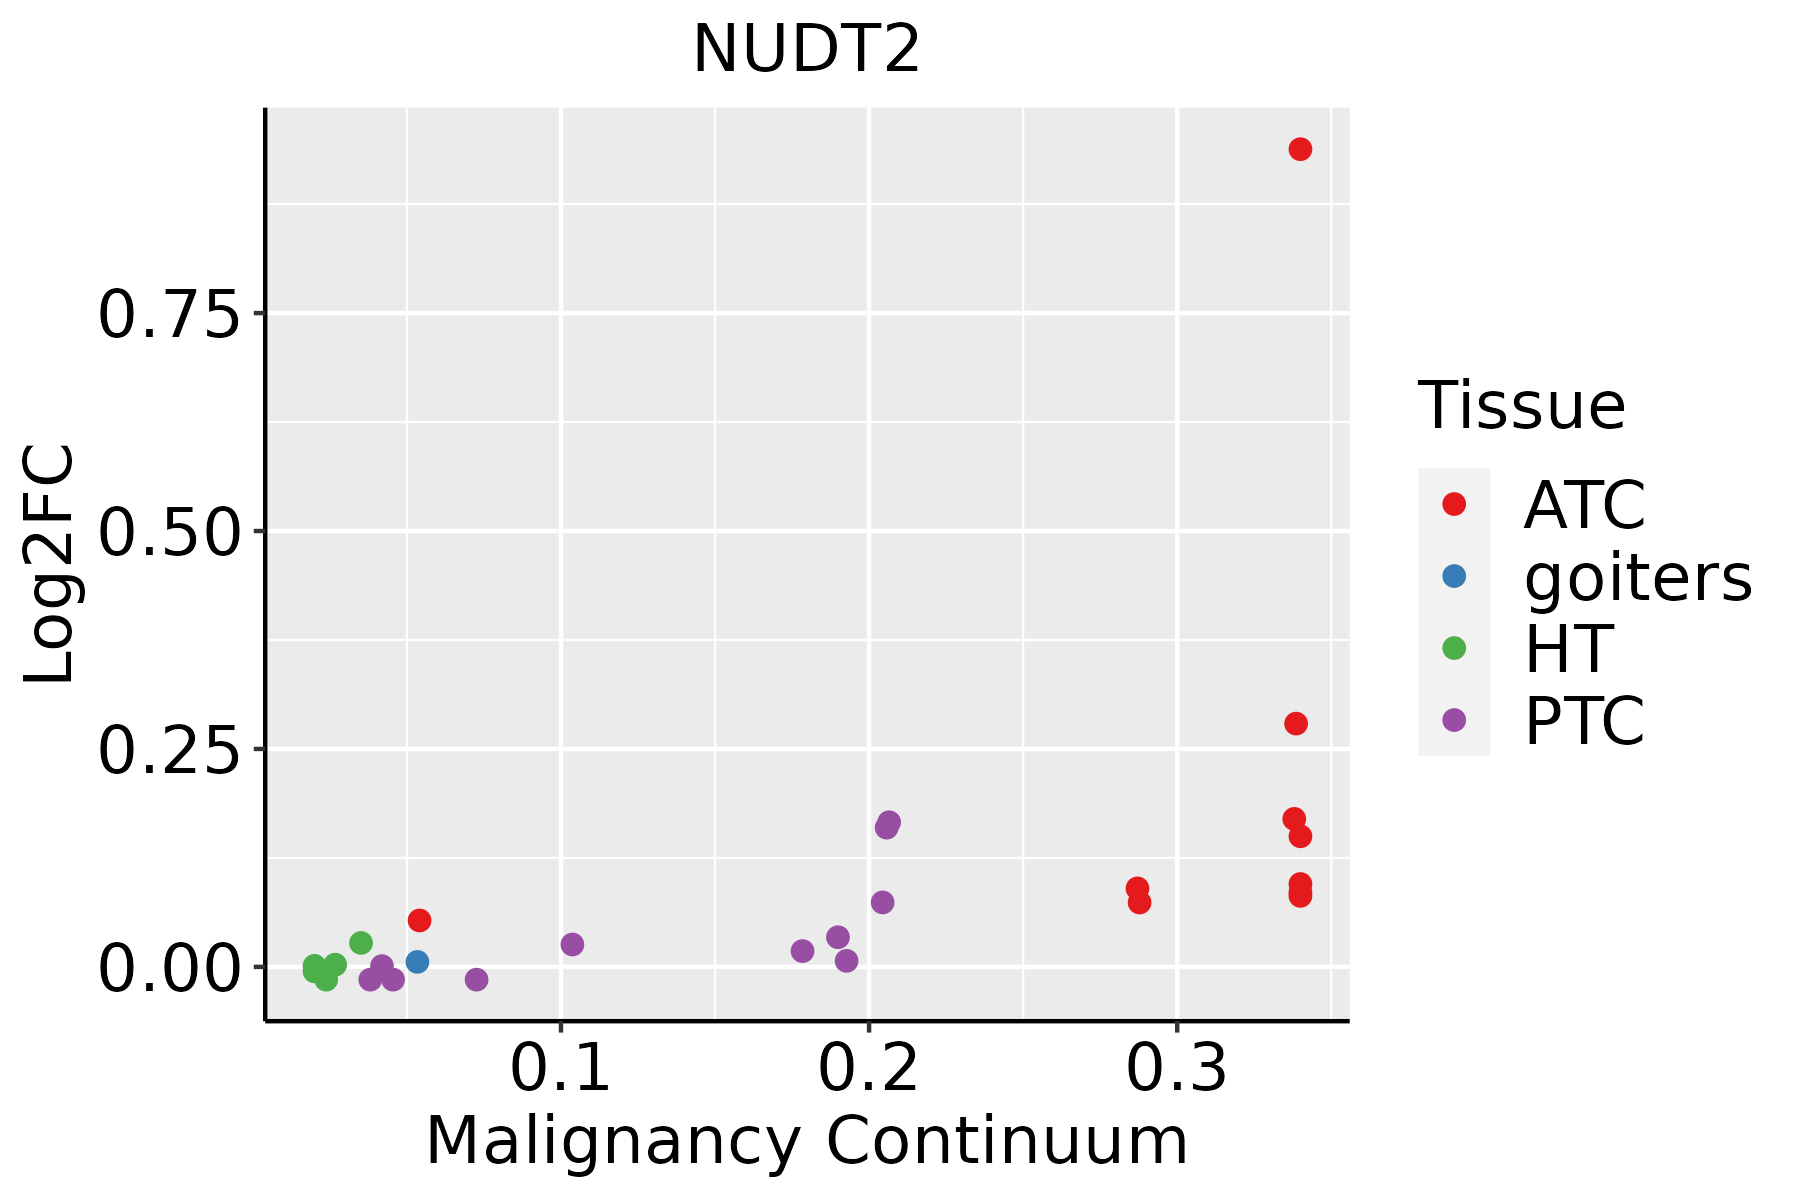 | ATC: Anaplastic thyroid cancer |
| HT: Hashimoto's thyroiditis | ||
| PTC: Papillary thyroid cancer |
| ∗log2FC in expression of this searched gene in stem-like cells from each diseased tissue sample relative to stem-like cells in normal samples in each tissue plotted against the malignancy continuum. Samples are colored based on if they are from different disease stage. |
Top |
Malignant transformation related pathway analysis |
| Find out the enriched GO biological processes and KEGG pathways involved in transition from healthy to precancer to cancer |
| Tissue | Disease Stage | Enriched GO biological Processes |
| Colorectum | AD |  |
| Colorectum | SER |  |
| Colorectum | MSS |  |
| Colorectum | MSI-H |  |
| Colorectum | FAP |  |
| ∗Top 15 enriched GO BP terms are showed in the bar plot of each disease state in each tissue. Each row represents a significant GO biological process which is colored according to the -log10(p.adjust). |
| Page: 1 2 3 4 5 6 7 8 9 |
| GO ID | Tissue | Disease Stage | Description | Gene Ratio | Bg Ratio | pvalue | p.adjust | Count |
| GO:00091236 | Thyroid | PTC | nucleoside monophosphate metabolic process | 35/5968 | 76/18723 | 6.68e-03 | 2.89e-02 | 35 |
| GO:002261334 | Thyroid | ATC | ribonucleoprotein complex biogenesis | 292/6293 | 463/18723 | 3.05e-39 | 9.63e-36 | 292 |
| GO:190331134 | Thyroid | ATC | regulation of mRNA metabolic process | 181/6293 | 288/18723 | 1.75e-24 | 5.54e-22 | 181 |
| GO:000697934 | Thyroid | ATC | response to oxidative stress | 246/6293 | 446/18723 | 2.98e-21 | 6.09e-19 | 246 |
| GO:004603434 | Thyroid | ATC | ATP metabolic process | 167/6293 | 277/18723 | 5.60e-20 | 8.64e-18 | 167 |
| GO:005068434 | Thyroid | ATC | regulation of mRNA processing | 97/6293 | 137/18723 | 5.28e-19 | 7.25e-17 | 97 |
| GO:006219734 | Thyroid | ATC | cellular response to chemical stress | 188/6293 | 337/18723 | 3.16e-17 | 3.07e-15 | 188 |
| GO:007182635 | Thyroid | ATC | ribonucleoprotein complex subunit organization | 133/6293 | 227/18723 | 8.32e-15 | 5.01e-13 | 133 |
| GO:002261835 | Thyroid | ATC | ribonucleoprotein complex assembly | 129/6293 | 220/18723 | 1.93e-14 | 1.10e-12 | 129 |
| GO:003459934 | Thyroid | ATC | cellular response to oxidative stress | 158/6293 | 288/18723 | 7.35e-14 | 3.94e-12 | 158 |
| GO:190331324 | Thyroid | ATC | positive regulation of mRNA metabolic process | 75/6293 | 118/18723 | 2.57e-11 | 8.84e-10 | 75 |
| GO:001969328 | Thyroid | ATC | ribose phosphate metabolic process | 184/6293 | 396/18723 | 5.87e-08 | 1.05e-06 | 184 |
| GO:000915029 | Thyroid | ATC | purine ribonucleotide metabolic process | 172/6293 | 368/18723 | 9.58e-08 | 1.64e-06 | 172 |
| GO:000925928 | Thyroid | ATC | ribonucleotide metabolic process | 178/6293 | 385/18723 | 1.47e-07 | 2.39e-06 | 178 |
| GO:000914427 | Thyroid | ATC | purine nucleoside triphosphate metabolic process | 53/6293 | 88/18723 | 2.75e-07 | 4.20e-06 | 53 |
| GO:007252128 | Thyroid | ATC | purine-containing compound metabolic process | 189/6293 | 416/18723 | 2.83e-07 | 4.29e-06 | 189 |
| GO:003112312 | Thyroid | ATC | RNA 3'-end processing | 65/6293 | 116/18723 | 5.58e-07 | 7.93e-06 | 65 |
| GO:0006753111 | Thyroid | ATC | nucleoside phosphate metabolic process | 219/6293 | 497/18723 | 5.92e-07 | 8.29e-06 | 219 |
| GO:003112413 | Thyroid | ATC | mRNA 3'-end processing | 40/6293 | 62/18723 | 6.25e-07 | 8.65e-06 | 40 |
| GO:000914128 | Thyroid | ATC | nucleoside triphosphate metabolic process | 63/6293 | 112/18723 | 6.90e-07 | 9.35e-06 | 63 |
| Page: 1 2 3 4 5 6 7 8 9 10 11 12 13 14 15 16 17 18 19 20 21 22 |
| Pathway ID | Tissue | Disease Stage | Description | Gene Ratio | Bg Ratio | pvalue | p.adjust | qvalue | Count |
| hsa002405 | Esophagus | ESCC | Pyrimidine metabolism | 41/4205 | 58/8465 | 9.14e-04 | 2.92e-03 | 1.49e-03 | 41 |
| hsa0024012 | Esophagus | ESCC | Pyrimidine metabolism | 41/4205 | 58/8465 | 9.14e-04 | 2.92e-03 | 1.49e-03 | 41 |
| hsa00240 | Liver | Cirrhotic | Pyrimidine metabolism | 27/2530 | 58/8465 | 5.31e-03 | 1.88e-02 | 1.16e-02 | 27 |
| hsa002401 | Liver | Cirrhotic | Pyrimidine metabolism | 27/2530 | 58/8465 | 5.31e-03 | 1.88e-02 | 1.16e-02 | 27 |
| hsa002402 | Liver | HCC | Pyrimidine metabolism | 44/4020 | 58/8465 | 9.34e-06 | 7.11e-05 | 3.95e-05 | 44 |
| hsa002403 | Liver | HCC | Pyrimidine metabolism | 44/4020 | 58/8465 | 9.34e-06 | 7.11e-05 | 3.95e-05 | 44 |
| hsa002404 | Oral cavity | OSCC | Pyrimidine metabolism | 37/3704 | 58/8465 | 1.62e-03 | 4.45e-03 | 2.26e-03 | 37 |
| hsa0024011 | Oral cavity | OSCC | Pyrimidine metabolism | 37/3704 | 58/8465 | 1.62e-03 | 4.45e-03 | 2.26e-03 | 37 |
| hsa0024021 | Oral cavity | LP | Pyrimidine metabolism | 28/2418 | 58/8465 | 1.12e-03 | 5.02e-03 | 3.24e-03 | 28 |
| hsa0024031 | Oral cavity | LP | Pyrimidine metabolism | 28/2418 | 58/8465 | 1.12e-03 | 5.02e-03 | 3.24e-03 | 28 |
| Page: 1 |
Top |
Cell-cell communication analysis |
| Identification of potential cell-cell interactions between two cell types and their ligand-receptor pairs for different disease states |
| Ligand | Receptor | LRpair | Pathway | Tissue | Disease Stage |
| Page: 1 |
Top |
Single-cell gene regulatory network inference analysis |
| Find out the significant the regulons (TFs) and the target genes of each regulon across cell types for different disease states |
| TF | Cell Type | Tissue | Disease Stage | Target Gene | RSS | Regulon Activity |
| ∗The dot plots of a searched regulon are shown for all cell subpopulations in each disease state of each tissue based on the regulon specific score inferred using pySCENIC and by calculating the average expression. |
| Page: 1 |
Top |
Somatic mutation of malignant transformation related genes |
| Annotation of somatic variants for genes involved in malignant transformation |
| Hugo Symbol | Variant Class | Variant Classification | dbSNP RS | HGVSc | HGVSp | HGVSp Short | SWISSPROT | BIOTYPE | SIFT | PolyPhen | Tumor Sample Barcode | Tissue | Histology | Sex | Age | Stage | Therapy Types | Drugs | Outcome |
| NUDT2 | SNV | Missense_Mutation | novel | c.90N>T | p.Gln30His | p.Q30H | P50583 | protein_coding | deleterious(0) | probably_damaging(0.973) | TCGA-A2-A25A-01 | Breast | breast invasive carcinoma | Female | <65 | I/II | Unspecific | Cytoxan | SD |
| NUDT2 | SNV | Missense_Mutation | c.334N>G | p.Gln112Glu | p.Q112E | P50583 | protein_coding | deleterious(0.03) | possibly_damaging(0.468) | TCGA-C8-A275-01 | Breast | breast invasive carcinoma | Female | <65 | I/II | Unknown | Unknown | SD | |
| NUDT2 | SNV | Missense_Mutation | novel | c.439N>A | p.Ala147Thr | p.A147T | P50583 | protein_coding | deleterious_low_confidence(0.02) | benign(0) | TCGA-F5-6814-01 | Colorectum | rectum adenocarcinoma | Male | <65 | I/II | Unknown | Unknown | SD |
| NUDT2 | deletion | Frame_Shift_Del | novel | c.268delA | p.Thr90GlnfsTer9 | p.T90Qfs*9 | P50583 | protein_coding | TCGA-AA-3950-01 | Colorectum | colon adenocarcinoma | Female | >=65 | I/II | Unknown | Unknown | SD | ||
| NUDT2 | SNV | Missense_Mutation | novel | c.439N>A | p.Ala147Thr | p.A147T | P50583 | protein_coding | deleterious_low_confidence(0.02) | benign(0) | TCGA-A5-A2K3-01 | Endometrium | uterine corpus endometrioid carcinoma | Female | >=65 | I/II | Chemotherapy | carboplatin | SD |
| NUDT2 | SNV | Missense_Mutation | novel | c.151N>T | p.Asp51Tyr | p.D51Y | P50583 | protein_coding | deleterious(0.04) | possibly_damaging(0.482) | TCGA-A5-A2K5-01 | Endometrium | uterine corpus endometrioid carcinoma | Female | >=65 | I/II | Unknown | Unknown | SD |
| NUDT2 | SNV | Missense_Mutation | c.30C>G | p.Ile10Met | p.I10M | P50583 | protein_coding | deleterious(0) | probably_damaging(0.941) | TCGA-05-4389-01 | Lung | lung adenocarcinoma | Male | >=65 | I/II | Unknown | Unknown | SD | |
| NUDT2 | SNV | Missense_Mutation | c.344G>A | p.Arg115His | p.R115H | P50583 | protein_coding | deleterious(0.01) | possibly_damaging(0.825) | TCGA-49-4501-01 | Lung | lung adenocarcinoma | Female | >=65 | I/II | Chemotherapy | gemzar | PD | |
| NUDT2 | SNV | Missense_Mutation | novel | c.431N>G | p.Ser144Cys | p.S144C | P50583 | protein_coding | deleterious(0) | possibly_damaging(0.645) | TCGA-90-A4EE-01 | Lung | lung squamous cell carcinoma | Male | <65 | I/II | Chemotherapy | cisplatin | CR |
| NUDT2 | SNV | Missense_Mutation | c.30C>G | p.Ile10Met | p.I10M | P50583 | protein_coding | deleterious(0) | probably_damaging(0.941) | TCGA-CX-7086-01 | Oral cavity | head & neck squamous cell carcinoma | Male | <65 | III/IV | Unknown | Unknown | SD |
| Page: 1 2 |
Top |
Related drugs of malignant transformation related genes |
| Identification of chemicals and drugs interact with genes involved in malignant transfromation |
| (DGIdb 4.0) |
| Entrez ID | Symbol | Category | Interaction Types | Drug Claim Name | Drug Name | PMIDs |
| Page: 1 |

Copyright 2023-Present -The University of Texas Health Science Center at Houston |