| Tissue | Expression Dynamics | Abbreviation |
| Colorectum (GSE201348) |  | FAP: Familial adenomatous polyposis |
| CRC: Colorectal cancer |
| Colorectum (HTA11) | 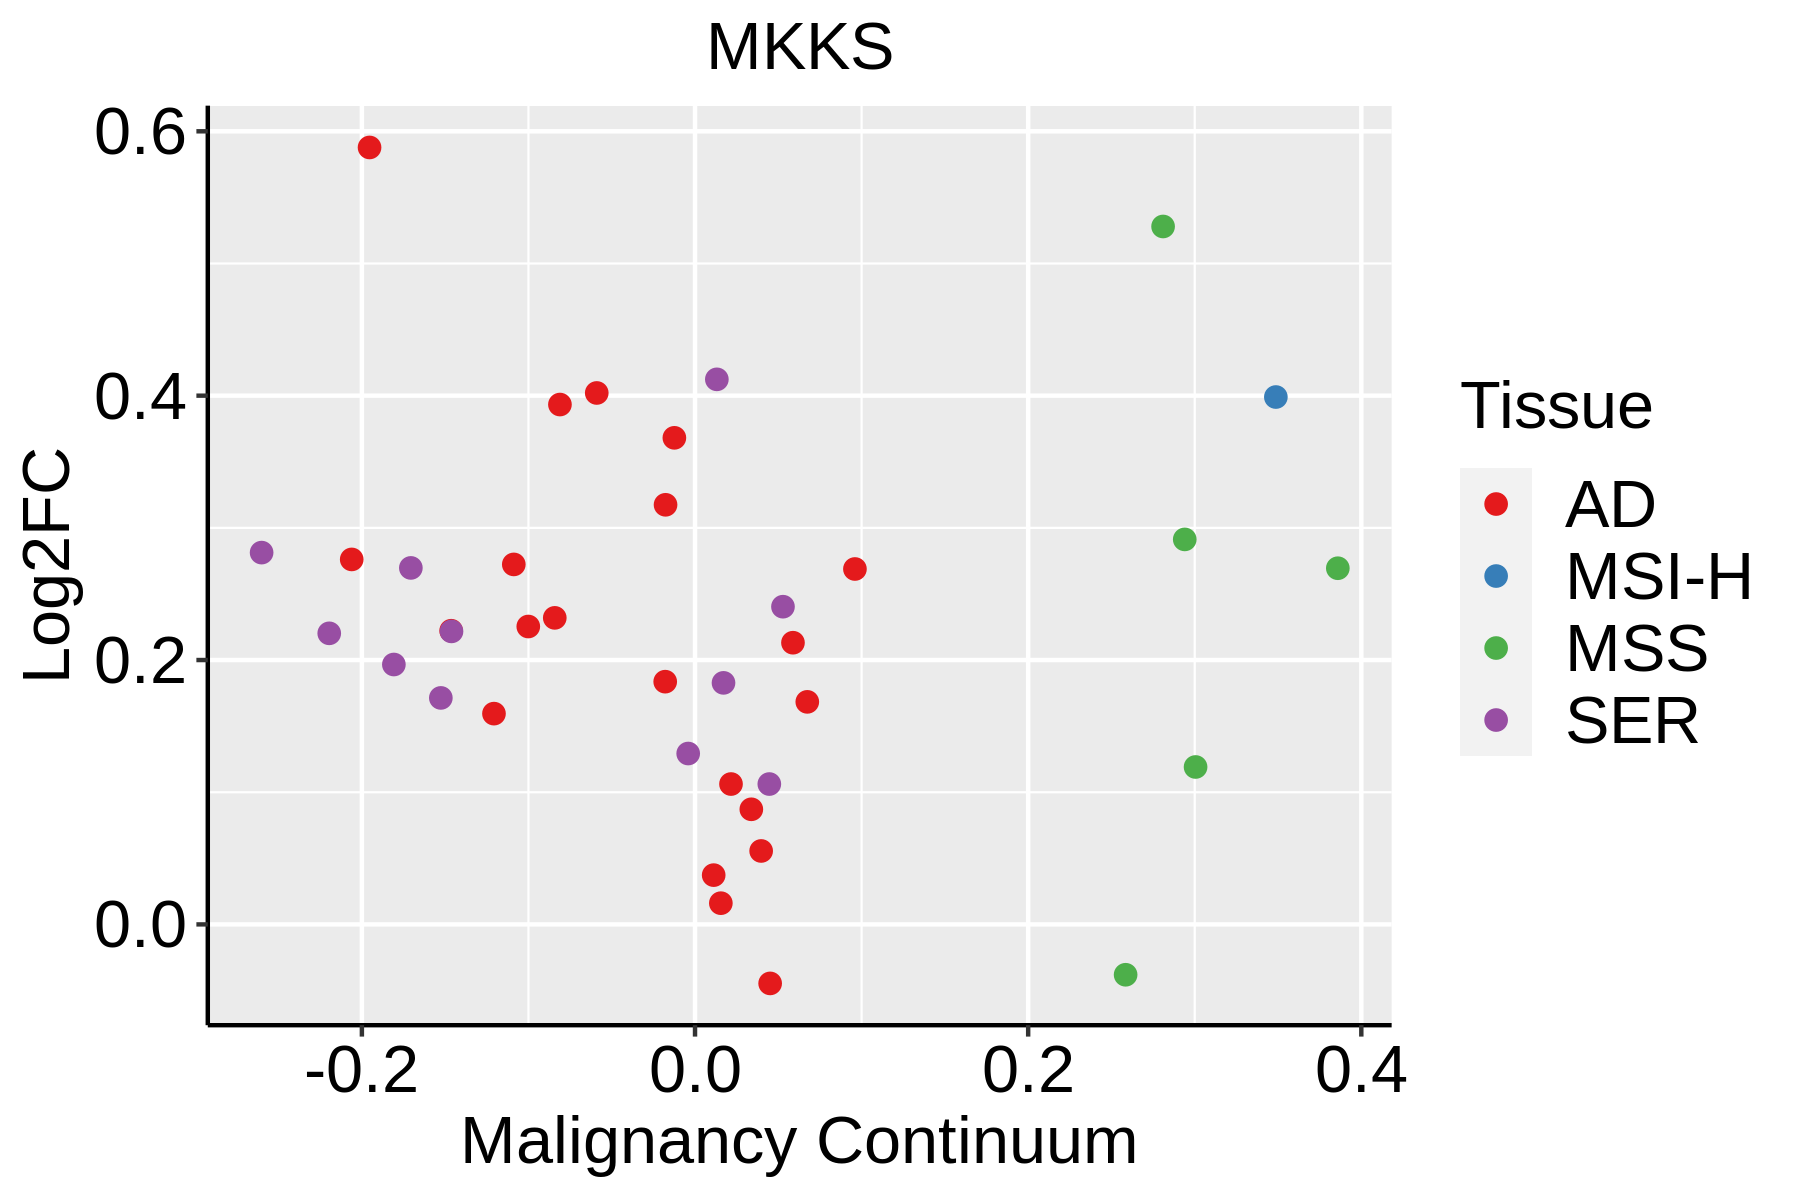 | AD: Adenomas |
| SER: Sessile serrated lesions |
| MSI-H: Microsatellite-high colorectal cancer |
| MSS: Microsatellite stable colorectal cancer |
| Esophagus | 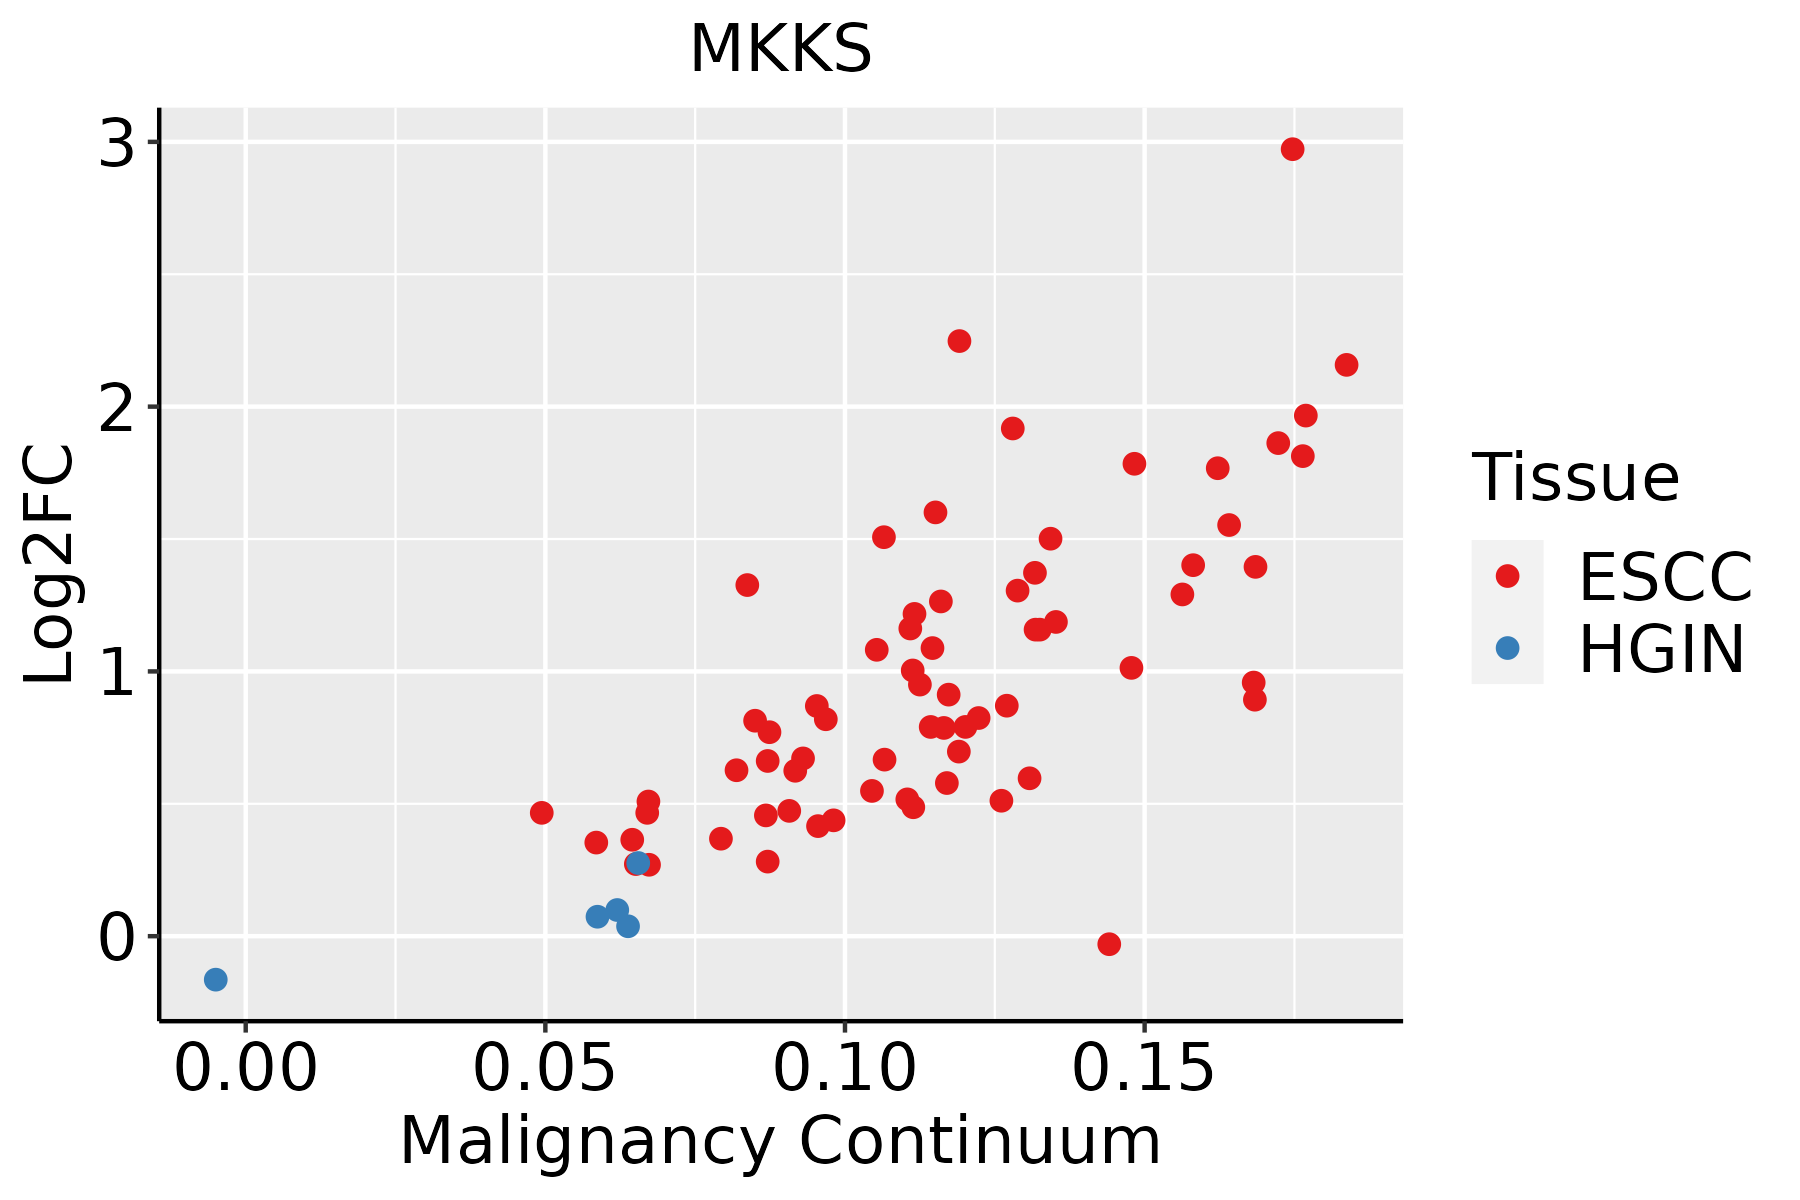 | ESCC: Esophageal squamous cell carcinoma |
| HGIN: High-grade intraepithelial neoplasias |
| LGIN: Low-grade intraepithelial neoplasias |
| Liver | 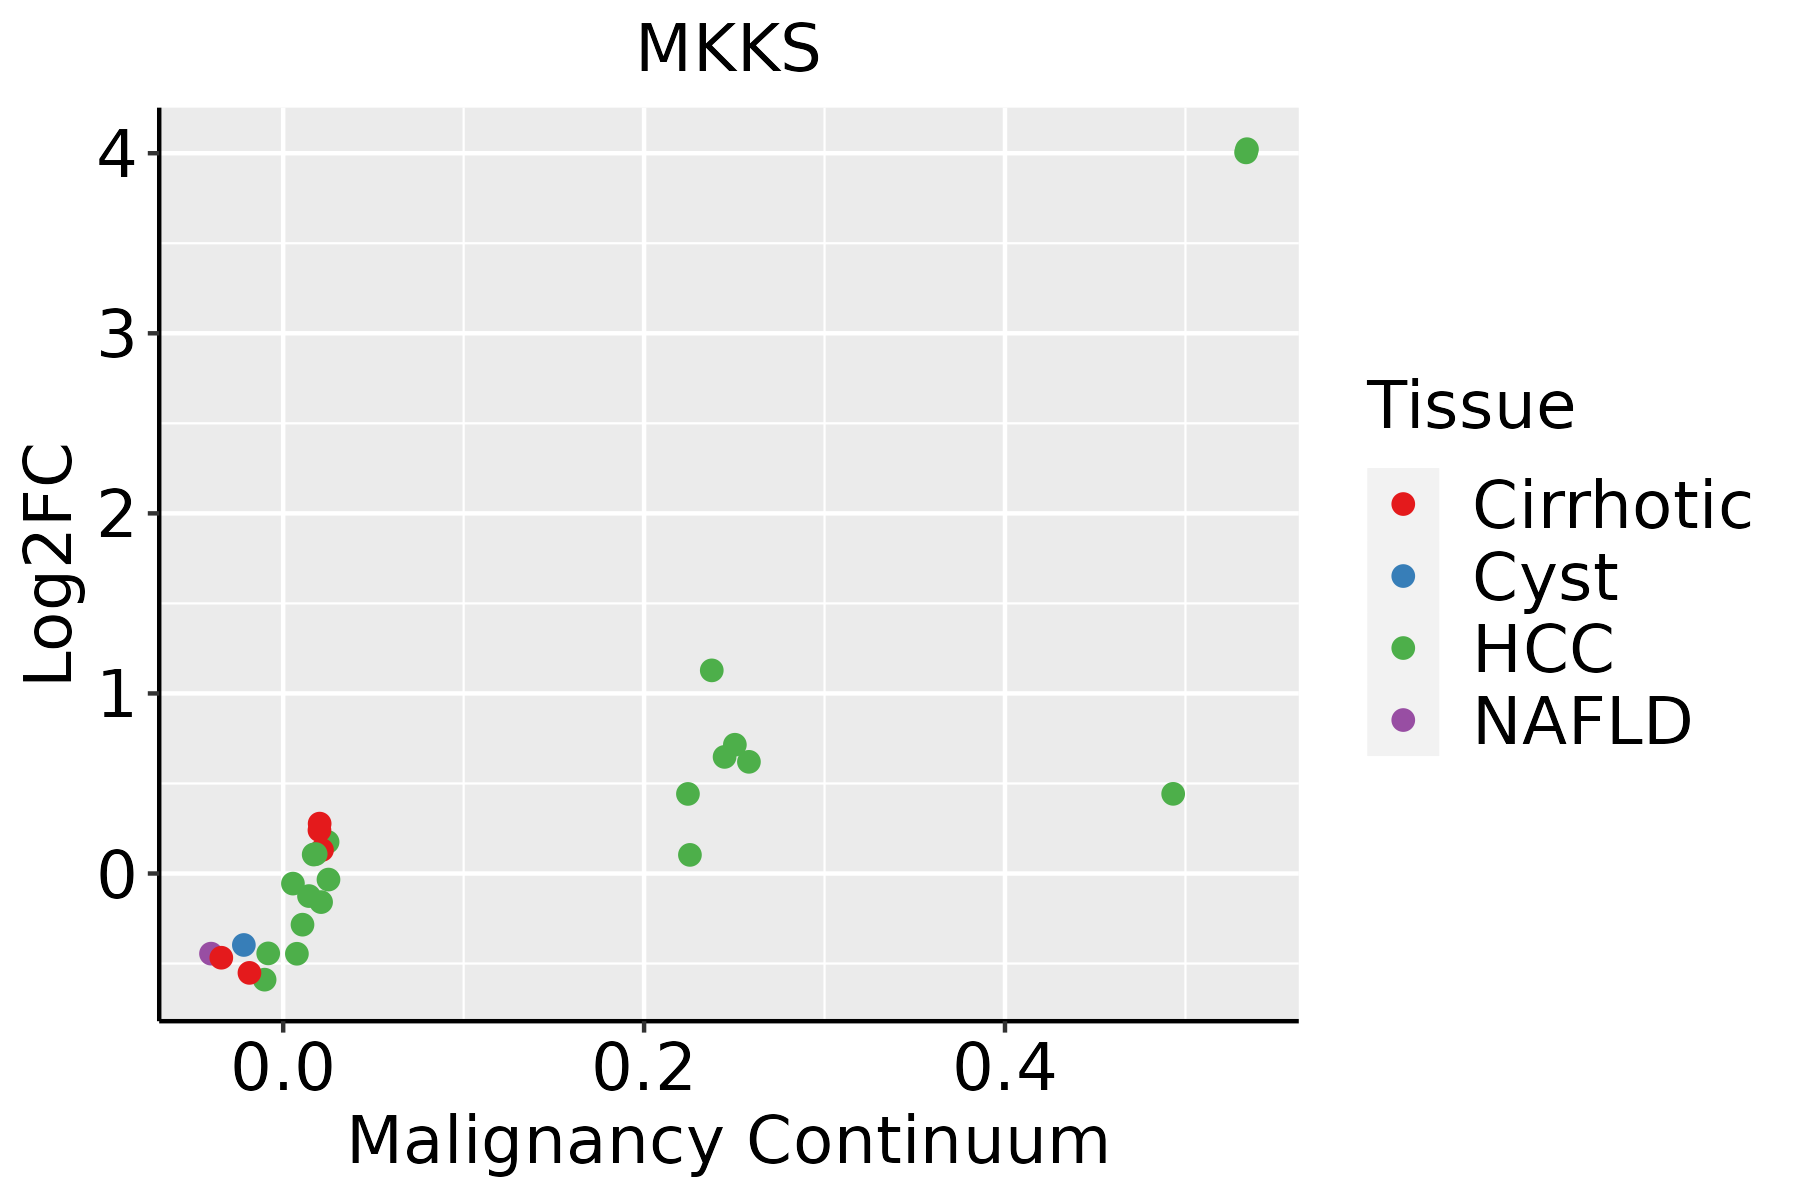 | HCC: Hepatocellular carcinoma |
| NAFLD: Non-alcoholic fatty liver disease |
| Oral Cavity | 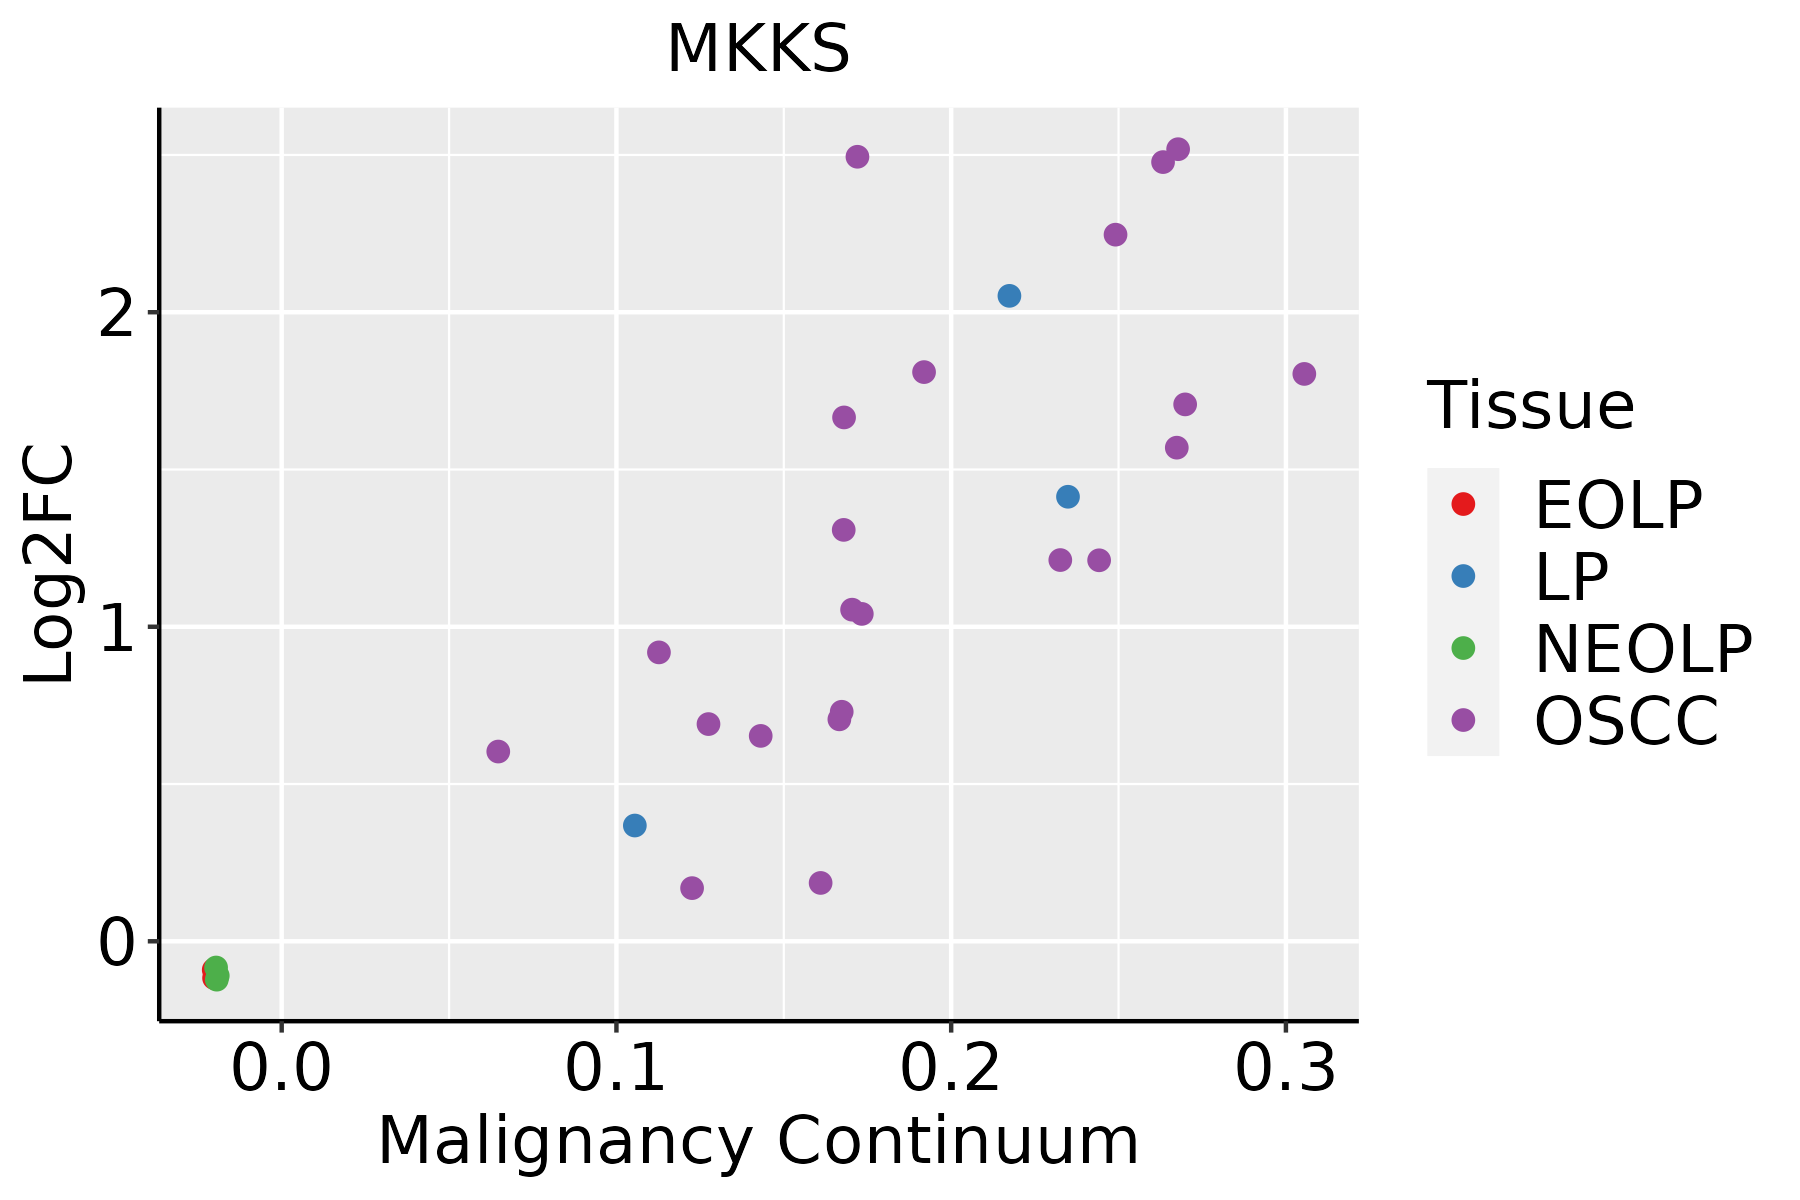 | EOLP: Erosive Oral lichen planus |
| LP: leukoplakia |
| NEOLP: Non-erosive oral lichen planus |
| OSCC: Oral squamous cell carcinoma |
| Prostate | 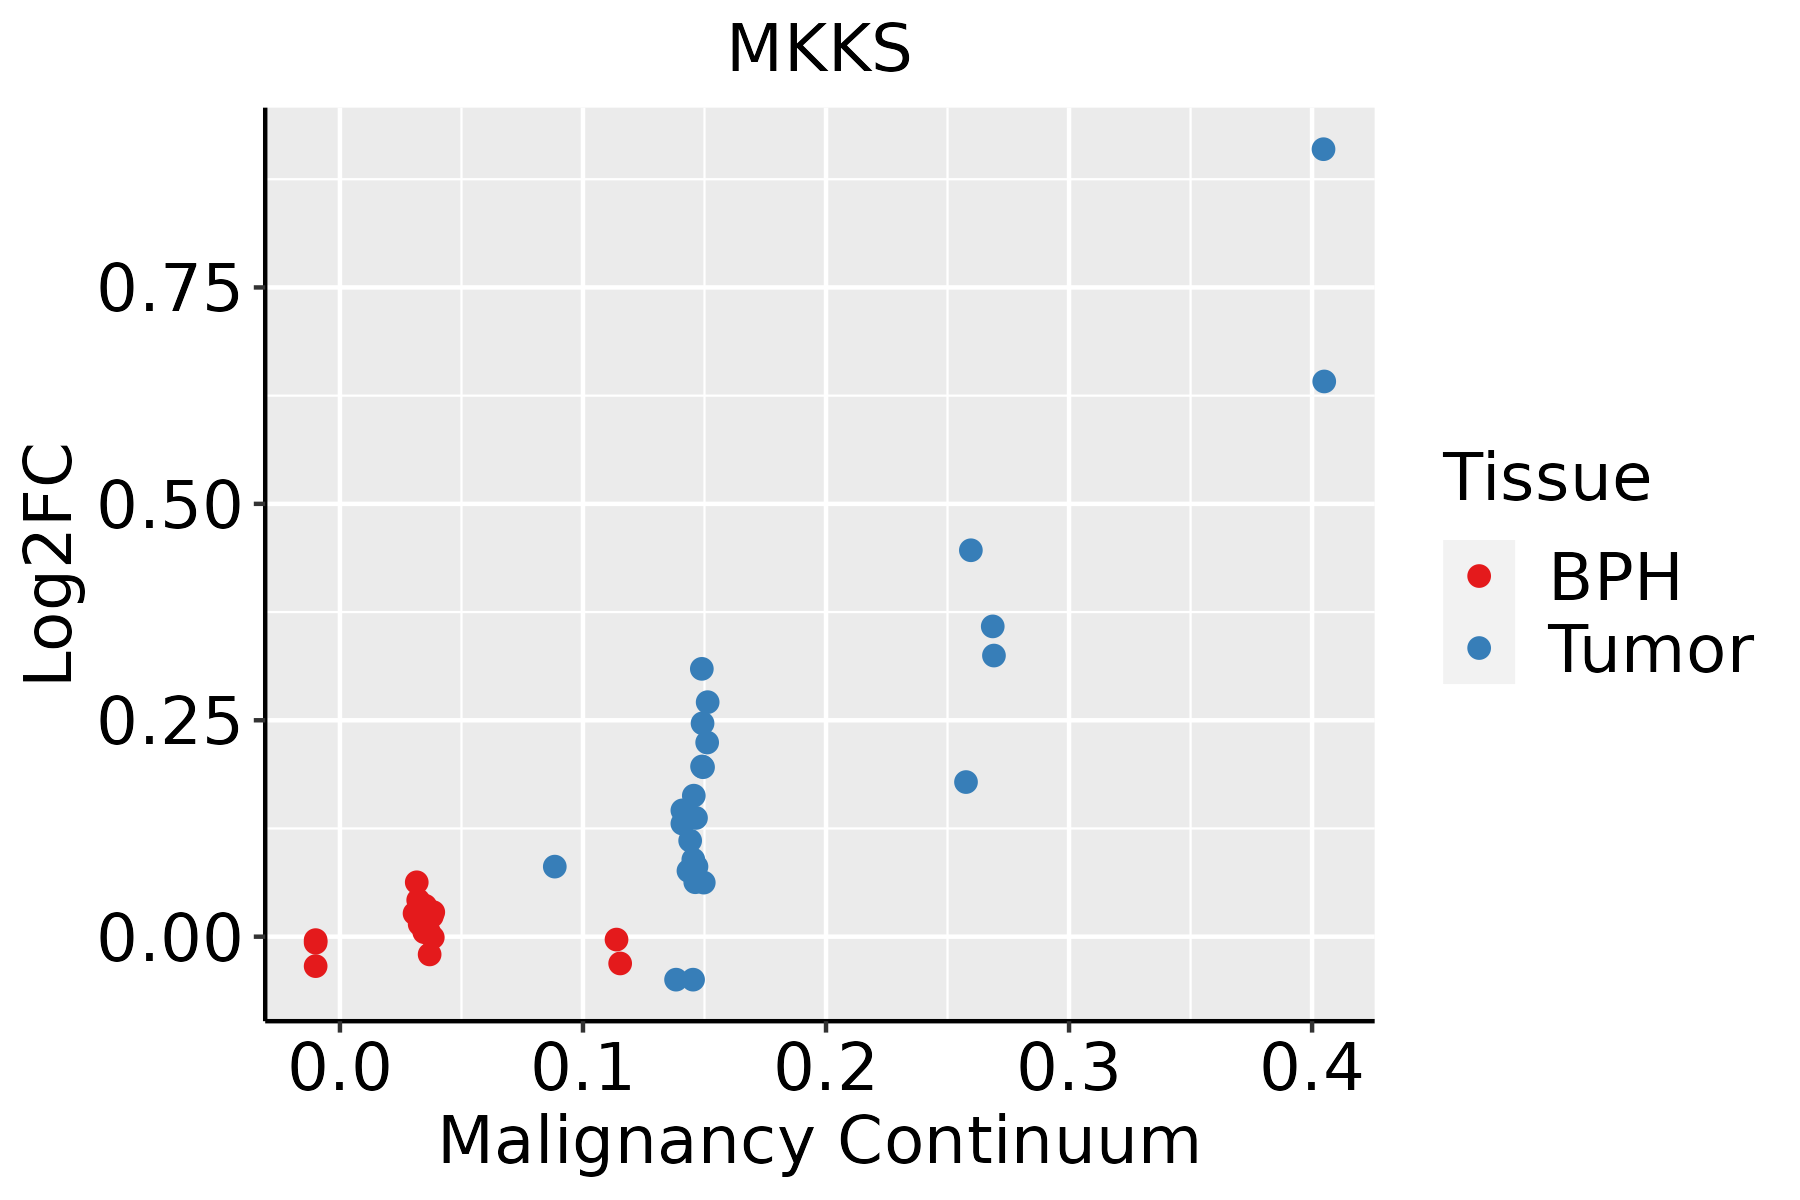 | BPH: Benign Prostatic Hyperplasia |
| Skin |  | AK: Actinic keratosis |
| cSCC: Cutaneous squamous cell carcinoma |
| SCCIS:squamous cell carcinoma in situ |
| GO ID | Tissue | Disease Stage | Description | Gene Ratio | Bg Ratio | pvalue | p.adjust | Count |
| GO:005113117 | Oral cavity | LP | chaperone-mediated protein complex assembly | 17/4623 | 23/18723 | 9.55e-07 | 2.43e-05 | 17 |
| GO:0032271110 | Oral cavity | LP | regulation of protein polymerization | 89/4623 | 233/18723 | 3.00e-06 | 6.47e-05 | 89 |
| GO:1902903110 | Oral cavity | LP | regulation of supramolecular fiber organization | 131/4623 | 383/18723 | 1.58e-05 | 2.78e-04 | 131 |
| GO:005165015 | Oral cavity | LP | establishment of vesicle localization | 64/4623 | 161/18723 | 1.65e-05 | 2.86e-04 | 64 |
| GO:000961215 | Oral cavity | LP | response to mechanical stimulus | 81/4623 | 216/18723 | 1.80e-05 | 3.09e-04 | 81 |
| GO:0032970110 | Oral cavity | LP | regulation of actin filament-based process | 133/4623 | 397/18723 | 4.21e-05 | 6.09e-04 | 133 |
| GO:0032535110 | Oral cavity | LP | regulation of cellular component size | 128/4623 | 383/18723 | 6.56e-05 | 8.80e-04 | 128 |
| GO:003083319 | Oral cavity | LP | regulation of actin filament polymerization | 65/4623 | 172/18723 | 8.86e-05 | 1.11e-03 | 65 |
| GO:0032956110 | Oral cavity | LP | regulation of actin cytoskeleton organization | 120/4623 | 358/18723 | 9.47e-05 | 1.18e-03 | 120 |
| GO:005164814 | Oral cavity | LP | vesicle localization | 66/4623 | 177/18723 | 1.25e-04 | 1.46e-03 | 66 |
| GO:0007015110 | Oral cavity | LP | actin filament organization | 143/4623 | 442/18723 | 1.44e-04 | 1.65e-03 | 143 |
| GO:000806418 | Oral cavity | LP | regulation of actin polymerization or depolymerization | 69/4623 | 188/18723 | 1.55e-04 | 1.76e-03 | 69 |
| GO:003083217 | Oral cavity | LP | regulation of actin filament length | 69/4623 | 189/18723 | 1.86e-04 | 2.05e-03 | 69 |
| GO:003004119 | Oral cavity | LP | actin filament polymerization | 69/4623 | 191/18723 | 2.65e-04 | 2.75e-03 | 69 |
| GO:000815419 | Oral cavity | LP | actin polymerization or depolymerization | 76/4623 | 218/18723 | 4.67e-04 | 4.42e-03 | 76 |
| GO:003133319 | Oral cavity | LP | negative regulation of protein-containing complex assembly | 52/4623 | 141/18723 | 8.28e-04 | 7.24e-03 | 52 |
| GO:0110053110 | Oral cavity | LP | regulation of actin filament organization | 92/4623 | 278/18723 | 9.25e-04 | 7.85e-03 | 92 |
| GO:005134619 | Oral cavity | LP | negative regulation of hydrolase activity | 120/4623 | 379/18723 | 1.16e-03 | 9.48e-03 | 120 |
| GO:00330591 | Oral cavity | LP | cellular pigmentation | 22/4623 | 53/18723 | 5.20e-03 | 3.19e-02 | 22 |
| GO:190290418 | Oral cavity | LP | negative regulation of supramolecular fiber organization | 56/4623 | 167/18723 | 6.19e-03 | 3.66e-02 | 56 |
| Hugo Symbol | Variant Class | Variant Classification | dbSNP RS | HGVSc | HGVSp | HGVSp Short | SWISSPROT | BIOTYPE | SIFT | PolyPhen | Tumor Sample Barcode | Tissue | Histology | Sex | Age | Stage | Therapy Types | Drugs | Outcome |
| MKKS | SNV | Missense_Mutation | | c.1133G>T | p.Arg378Ile | p.R378I | Q9NPJ1 | protein_coding | deleterious(0) | possibly_damaging(0.902) | TCGA-AC-A23H-01 | Breast | breast invasive carcinoma | Female | >=65 | I/II | Unknown | Unknown | PD |
| MKKS | SNV | Missense_Mutation | | c.1045G>T | p.Asp349Tyr | p.D349Y | Q9NPJ1 | protein_coding | deleterious(0) | probably_damaging(0.948) | TCGA-AC-A23H-01 | Breast | breast invasive carcinoma | Female | >=65 | I/II | Unknown | Unknown | PD |
| MKKS | SNV | Missense_Mutation | novel | c.503G>A | p.Arg168Lys | p.R168K | Q9NPJ1 | protein_coding | tolerated(0.89) | benign(0.001) | TCGA-AC-A5XS-01 | Breast | breast invasive carcinoma | Female | >=65 | I/II | Hormone Therapy | femara | SD |
| MKKS | SNV | Missense_Mutation | novel | c.8N>A | p.Arg3His | p.R3H | Q9NPJ1 | protein_coding | deleterious(0.02) | probably_damaging(0.964) | TCGA-AO-A03L-01 | Breast | breast invasive carcinoma | Female | <65 | III/IV | Chemotherapy | cyclophosphamide | SD |
| MKKS | SNV | Missense_Mutation | novel | c.1615N>A | p.Leu539Met | p.L539M | Q9NPJ1 | protein_coding | deleterious(0) | probably_damaging(0.934) | TCGA-LL-A441-01 | Breast | breast invasive carcinoma | Female | <65 | I/II | Chemotherapy | taxotere | CR |
| MKKS | insertion | In_Frame_Ins | novel | c.22_23insTCAACTGCCCTCAAGGTGGCACTCTTTTGTACAACTTTATCC | p.Lys8delinsIleAsnCysProGlnGlyGlyThrLeuLeuTyrAsnPheIleGln | p.K8delinsINCPQGGTLLYNFIQ | Q9NPJ1 | protein_coding | | | TCGA-B6-A0I5-01 | Breast | breast invasive carcinoma | Female | <65 | I/II | Unknown | Unknown | SD |
| MKKS | SNV | Missense_Mutation | novel | c.1166N>T | p.Thr389Met | p.T389M | Q9NPJ1 | protein_coding | deleterious(0.01) | possibly_damaging(0.88) | TCGA-2W-A8YY-01 | Cervix | cervical & endocervical cancer | Female | <65 | I/II | Chemotherapy | cisplatin | CR |
| MKKS | SNV | Missense_Mutation | novel | c.173N>T | p.Ser58Leu | p.S58L | Q9NPJ1 | protein_coding | deleterious(0) | probably_damaging(0.997) | TCGA-HM-A4S6-01 | Cervix | cervical & endocervical cancer | Female | <65 | III/IV | Chemotherapy | cisplatin | CR |
| MKKS | SNV | Missense_Mutation | | c.631G>T | p.Asp211Tyr | p.D211Y | Q9NPJ1 | protein_coding | deleterious(0) | probably_damaging(0.98) | TCGA-AA-A010-01 | Colorectum | colon adenocarcinoma | Female | <65 | I/II | Chemotherapy | folinic | CR |
| MKKS | SNV | Missense_Mutation | rs750058438 | c.235N>A | p.Ala79Thr | p.A79T | Q9NPJ1 | protein_coding | tolerated(0.84) | benign(0.01) | TCGA-CA-6717-01 | Colorectum | colon adenocarcinoma | Male | <65 | I/II | Chemotherapy | oxaliplatin | CR |


