| Tissue | Expression Dynamics | Abbreviation |
| Colorectum (GSE201348) |  | FAP: Familial adenomatous polyposis |
| CRC: Colorectal cancer |
| Colorectum (HTA11) |  | AD: Adenomas |
| SER: Sessile serrated lesions |
| MSI-H: Microsatellite-high colorectal cancer |
| MSS: Microsatellite stable colorectal cancer |
| Esophagus |  | ESCC: Esophageal squamous cell carcinoma |
| HGIN: High-grade intraepithelial neoplasias |
| LGIN: Low-grade intraepithelial neoplasias |
| Liver | 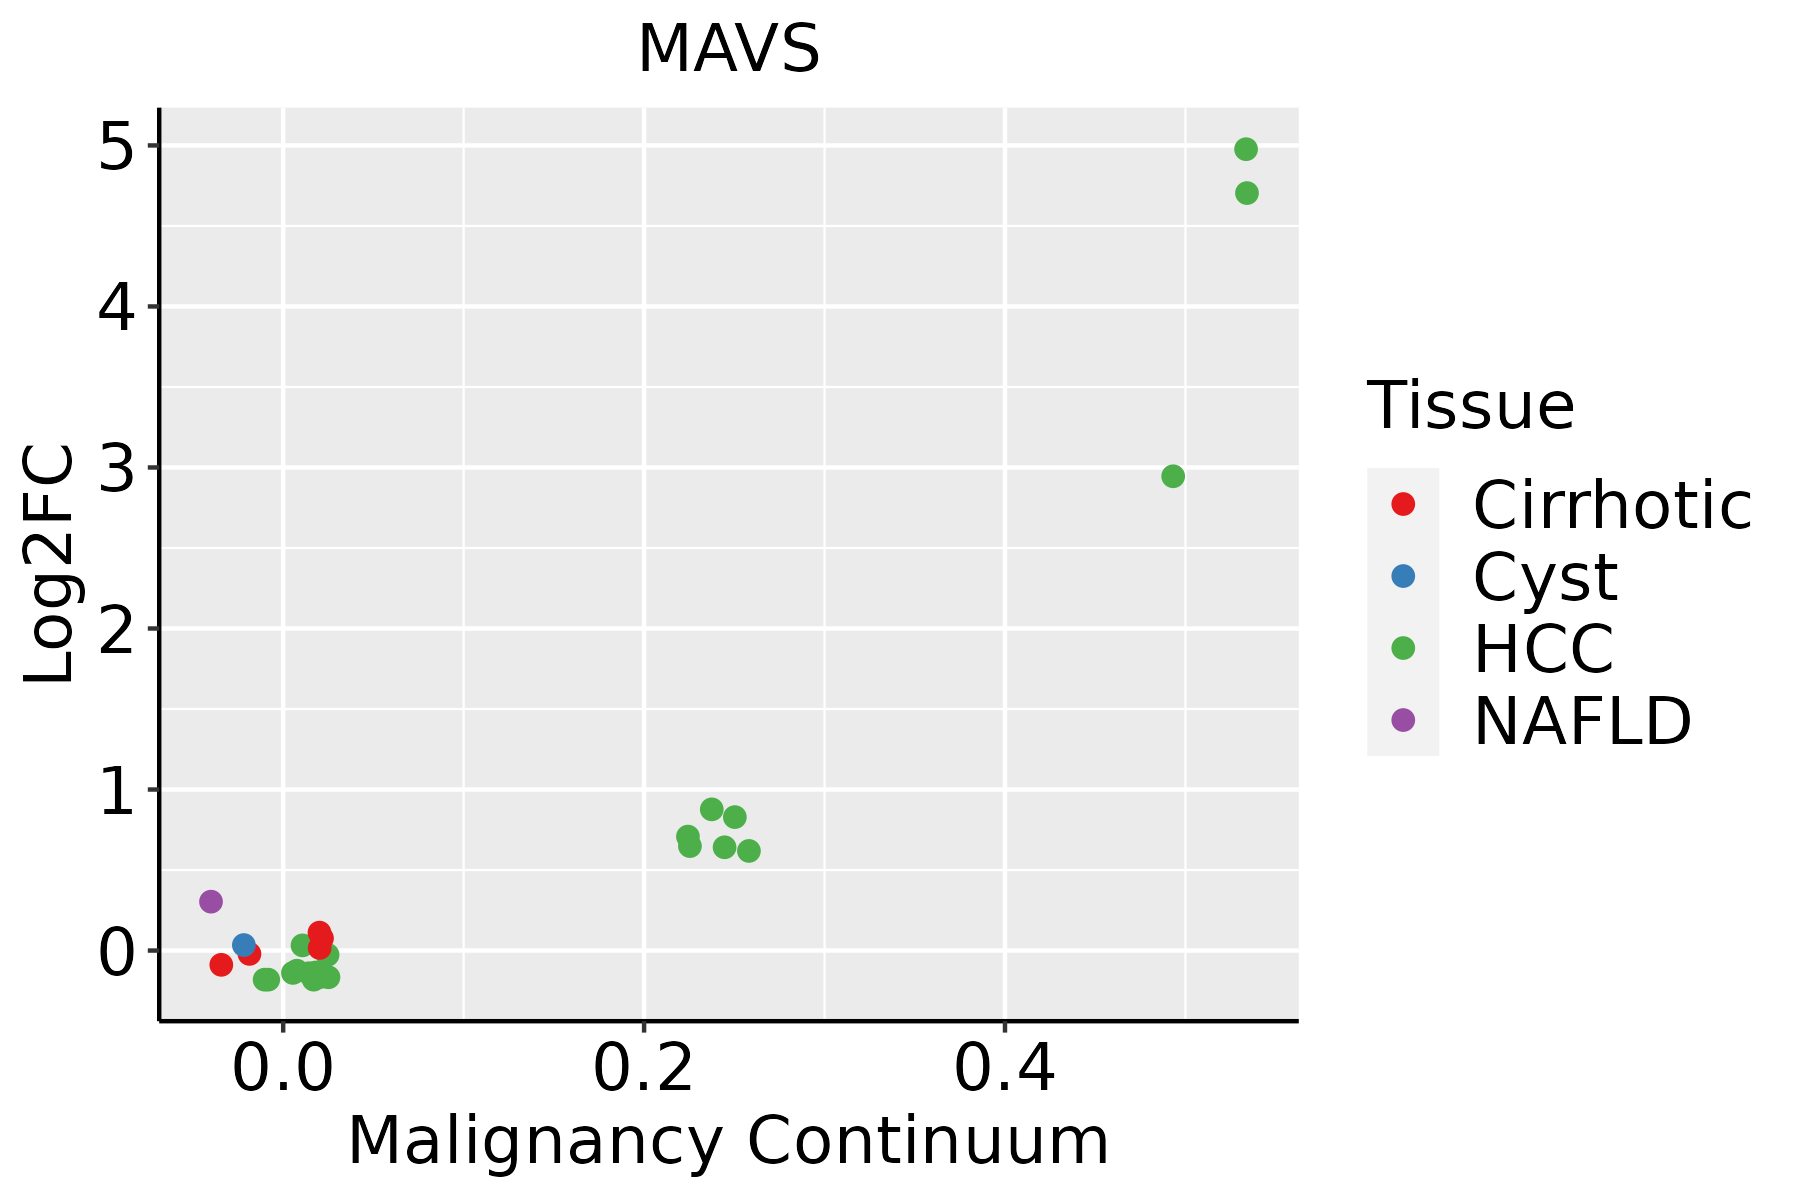 | HCC: Hepatocellular carcinoma |
| NAFLD: Non-alcoholic fatty liver disease |
| Oral Cavity | 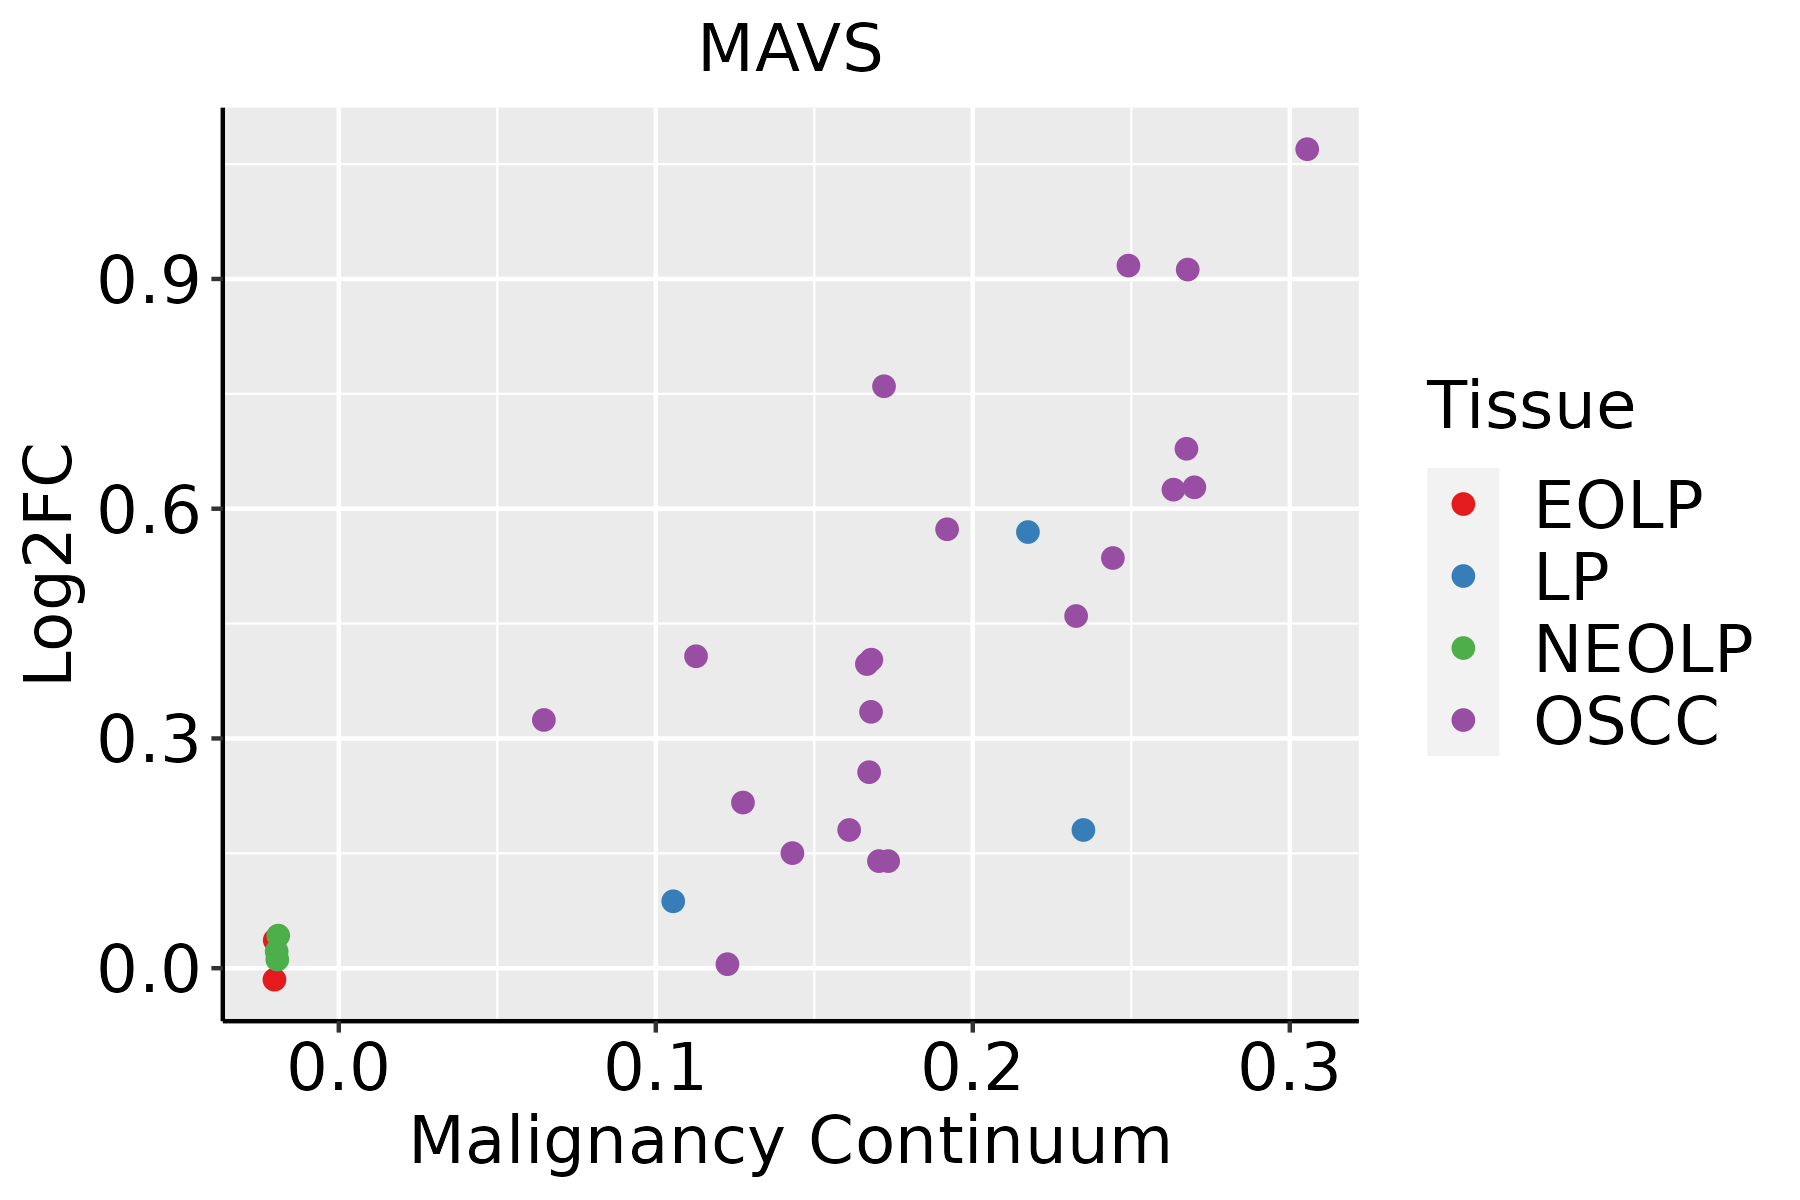 | EOLP: Erosive Oral lichen planus |
| LP: leukoplakia |
| NEOLP: Non-erosive oral lichen planus |
| OSCC: Oral squamous cell carcinoma |
| Prostate |  | BPH: Benign Prostatic Hyperplasia |
| Thyroid | 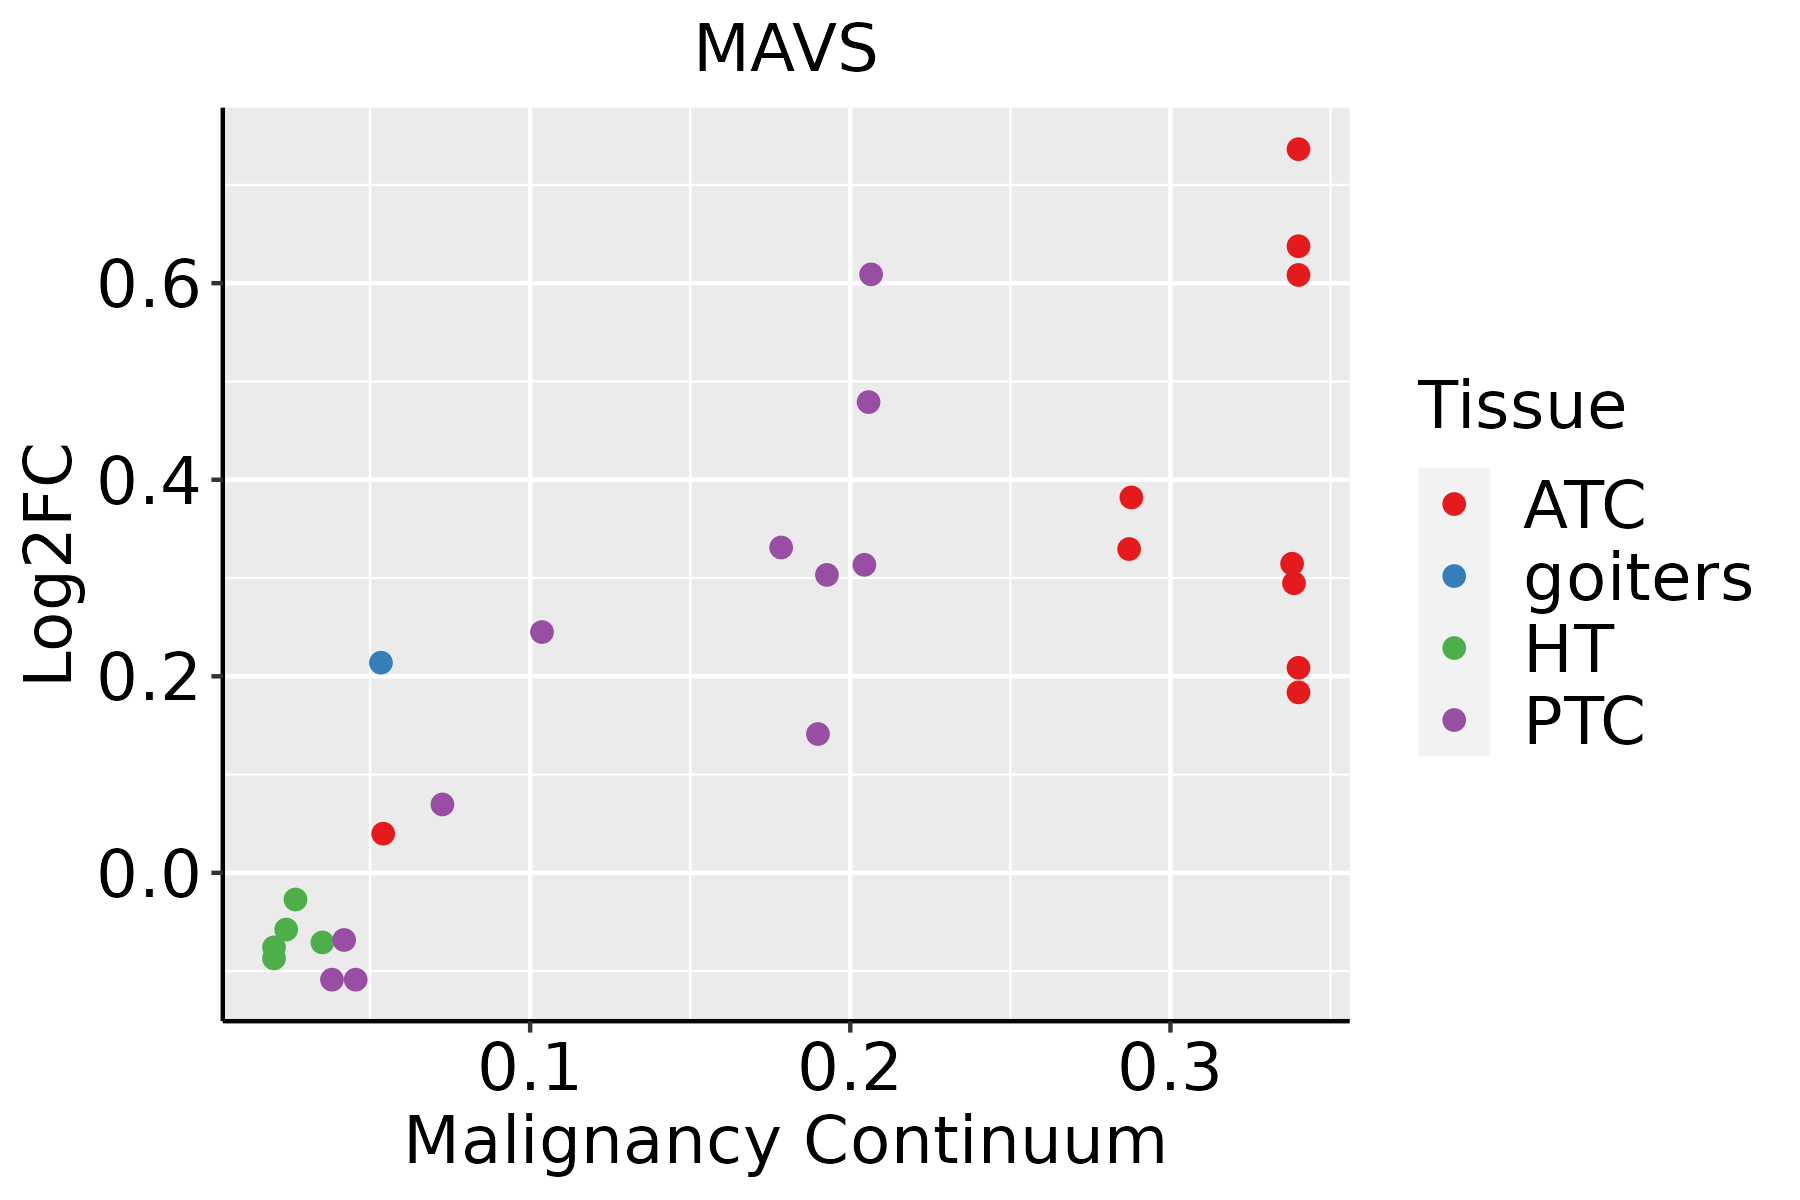 | ATC: Anaplastic thyroid cancer |
| HT: Hashimoto's thyroiditis |
| PTC: Papillary thyroid cancer |
| GO ID | Tissue | Disease Stage | Description | Gene Ratio | Bg Ratio | pvalue | p.adjust | Count |
| GO:006033712 | Oral cavity | LP | type I interferon signaling pathway | 30/4623 | 50/18723 | 1.17e-07 | 3.78e-06 | 30 |
| GO:004682415 | Oral cavity | LP | positive regulation of nucleocytoplasmic transport | 33/4623 | 62/18723 | 1.30e-06 | 3.16e-05 | 33 |
| GO:004852515 | Oral cavity | LP | negative regulation of viral process | 43/4623 | 92/18723 | 3.47e-06 | 7.35e-05 | 43 |
| GO:005117013 | Oral cavity | LP | import into nucleus | 65/4623 | 159/18723 | 4.78e-06 | 9.69e-05 | 65 |
| GO:005160711 | Oral cavity | LP | defense response to virus | 97/4623 | 265/18723 | 9.31e-06 | 1.74e-04 | 97 |
| GO:014054611 | Oral cavity | LP | defense response to symbiont | 97/4623 | 265/18723 | 9.31e-06 | 1.74e-04 | 97 |
| GO:00603381 | Oral cavity | LP | regulation of type I interferon-mediated signaling pathway | 21/4623 | 36/18723 | 1.74e-05 | 2.99e-04 | 21 |
| GO:000660612 | Oral cavity | LP | protein import into nucleus | 62/4623 | 155/18723 | 1.76e-05 | 3.04e-04 | 62 |
| GO:005109015 | Oral cavity | LP | regulation of DNA-binding transcription factor activity | 147/4623 | 440/18723 | 2.00e-05 | 3.35e-04 | 147 |
| GO:190458913 | Oral cavity | LP | regulation of protein import | 31/4623 | 63/18723 | 2.20e-05 | 3.58e-04 | 31 |
| GO:004507113 | Oral cavity | LP | negative regulation of viral genome replication | 28/4623 | 56/18723 | 3.75e-05 | 5.55e-04 | 28 |
| GO:190459115 | Oral cavity | LP | positive regulation of protein import | 23/4623 | 43/18723 | 4.70e-05 | 6.64e-04 | 23 |
| GO:004230613 | Oral cavity | LP | regulation of protein import into nucleus | 29/4623 | 60/18723 | 6.10e-05 | 8.28e-04 | 29 |
| GO:004230714 | Oral cavity | LP | positive regulation of protein import into nucleus | 22/4623 | 41/18723 | 6.43e-05 | 8.67e-04 | 22 |
| GO:000195911 | Oral cavity | LP | regulation of cytokine-mediated signaling pathway | 58/4623 | 150/18723 | 1.00e-04 | 1.24e-03 | 58 |
| GO:004508811 | Oral cavity | LP | regulation of innate immune response | 78/4623 | 218/18723 | 1.57e-04 | 1.78e-03 | 78 |
| GO:006075911 | Oral cavity | LP | regulation of response to cytokine stimulus | 61/4623 | 162/18723 | 1.61e-04 | 1.81e-03 | 61 |
| GO:000221811 | Oral cavity | LP | activation of innate immune response | 25/4623 | 52/18723 | 2.15e-04 | 2.33e-03 | 25 |
| GO:000283112 | Oral cavity | LP | regulation of response to biotic stimulus | 109/4623 | 327/18723 | 2.45e-04 | 2.60e-03 | 109 |
| GO:005109114 | Oral cavity | LP | positive regulation of DNA-binding transcription factor activity | 86/4623 | 260/18723 | 1.35e-03 | 1.08e-02 | 86 |
| Pathway ID | Tissue | Disease Stage | Description | Gene Ratio | Bg Ratio | pvalue | p.adjust | qvalue | Count |
| hsa05171 | Colorectum | AD | Coronavirus disease - COVID-19 | 113/2092 | 232/8465 | 9.90e-16 | 2.55e-14 | 1.63e-14 | 113 |
| hsa05160 | Colorectum | AD | Hepatitis C | 54/2092 | 157/8465 | 3.87e-03 | 1.96e-02 | 1.25e-02 | 54 |
| hsa051711 | Colorectum | AD | Coronavirus disease - COVID-19 | 113/2092 | 232/8465 | 9.90e-16 | 2.55e-14 | 1.63e-14 | 113 |
| hsa051601 | Colorectum | AD | Hepatitis C | 54/2092 | 157/8465 | 3.87e-03 | 1.96e-02 | 1.25e-02 | 54 |
| hsa051712 | Colorectum | SER | Coronavirus disease - COVID-19 | 98/1580 | 232/8465 | 3.33e-17 | 8.50e-16 | 6.17e-16 | 98 |
| hsa051713 | Colorectum | SER | Coronavirus disease - COVID-19 | 98/1580 | 232/8465 | 3.33e-17 | 8.50e-16 | 6.17e-16 | 98 |
| hsa051714 | Colorectum | MSS | Coronavirus disease - COVID-19 | 108/1875 | 232/8465 | 6.50e-17 | 1.67e-15 | 1.03e-15 | 108 |
| hsa051602 | Colorectum | MSS | Hepatitis C | 52/1875 | 157/8465 | 9.29e-04 | 5.58e-03 | 3.42e-03 | 52 |
| hsa05169 | Colorectum | MSS | Epstein-Barr virus infection | 63/1875 | 202/8465 | 1.63e-03 | 8.98e-03 | 5.50e-03 | 63 |
| hsa05161 | Colorectum | MSS | Hepatitis B | 48/1875 | 162/8465 | 1.53e-02 | 4.93e-02 | 3.02e-02 | 48 |
| hsa051715 | Colorectum | MSS | Coronavirus disease - COVID-19 | 108/1875 | 232/8465 | 6.50e-17 | 1.67e-15 | 1.03e-15 | 108 |
| hsa051603 | Colorectum | MSS | Hepatitis C | 52/1875 | 157/8465 | 9.29e-04 | 5.58e-03 | 3.42e-03 | 52 |
| hsa051691 | Colorectum | MSS | Epstein-Barr virus infection | 63/1875 | 202/8465 | 1.63e-03 | 8.98e-03 | 5.50e-03 | 63 |
| hsa051611 | Colorectum | MSS | Hepatitis B | 48/1875 | 162/8465 | 1.53e-02 | 4.93e-02 | 3.02e-02 | 48 |
| hsa051718 | Colorectum | FAP | Coronavirus disease - COVID-19 | 78/1404 | 232/8465 | 9.94e-11 | 1.11e-08 | 6.73e-09 | 78 |
| hsa051719 | Colorectum | FAP | Coronavirus disease - COVID-19 | 78/1404 | 232/8465 | 9.94e-11 | 1.11e-08 | 6.73e-09 | 78 |
| hsa0517110 | Colorectum | CRC | Coronavirus disease - COVID-19 | 74/1091 | 232/8465 | 1.66e-14 | 2.78e-12 | 1.88e-12 | 74 |
| hsa0517111 | Colorectum | CRC | Coronavirus disease - COVID-19 | 74/1091 | 232/8465 | 1.66e-14 | 2.78e-12 | 1.88e-12 | 74 |
| hsa05169210 | Esophagus | ESCC | Epstein-Barr virus infection | 151/4205 | 202/8465 | 1.55e-13 | 3.45e-12 | 1.77e-12 | 151 |
| hsa0516425 | Esophagus | ESCC | Influenza A | 122/4205 | 171/8465 | 5.01e-09 | 4.79e-08 | 2.45e-08 | 122 |
| Hugo Symbol | Variant Class | Variant Classification | dbSNP RS | HGVSc | HGVSp | HGVSp Short | SWISSPROT | BIOTYPE | SIFT | PolyPhen | Tumor Sample Barcode | Tissue | Histology | Sex | Age | Stage | Therapy Types | Drugs | Outcome |
| MAVS | SNV | Missense_Mutation | novel | c.967C>A | p.Pro323Thr | p.P323T | Q7Z434 | protein_coding | deleterious(0.02) | benign(0.047) | TCGA-A2-A0CP-01 | Breast | breast invasive carcinoma | Female | <65 | I/II | Chemotherapy | cytoxan | SD |
| MAVS | SNV | Missense_Mutation | novel | c.841N>G | p.Ile281Val | p.I281V | Q7Z434 | protein_coding | tolerated(0.1) | benign(0) | TCGA-A2-A0YM-01 | Breast | breast invasive carcinoma | Female | >=65 | I/II | Unknown | Unknown | SD |
| MAVS | SNV | Missense_Mutation | rs762014329 | c.1460N>T | p.Ala487Val | p.A487V | Q7Z434 | protein_coding | tolerated(0.18) | benign(0.087) | TCGA-AC-A62X-01 | Breast | breast invasive carcinoma | Female | >=65 | I/II | Unknown | Unknown | SD |
| MAVS | SNV | Missense_Mutation | novel | c.1249G>C | p.Glu417Gln | p.E417Q | Q7Z434 | protein_coding | deleterious(0.02) | possibly_damaging(0.728) | TCGA-E9-A3QA-01 | Breast | breast invasive carcinoma | Female | <65 | I/II | Unknown | Unknown | SD |
| MAVS | SNV | Missense_Mutation | novel | c.1216N>C | p.Asp406His | p.D406H | Q7Z434 | protein_coding | deleterious(0) | probably_damaging(0.958) | TCGA-LL-A5YO-01 | Breast | breast invasive carcinoma | Female | <65 | I/II | Chemotherapy | taxotere | CR |
| MAVS | insertion | Frame_Shift_Ins | novel | c.965_966insCCCTCAGAAATATATAGTTGTCCATCTG | p.Ser324GlnfsTer15 | p.S324Qfs*15 | Q7Z434 | protein_coding | | | TCGA-A2-A0CP-01 | Breast | breast invasive carcinoma | Female | <65 | I/II | Chemotherapy | cytoxan | SD |
| MAVS | SNV | Missense_Mutation | | c.545N>G | p.Ser182Cys | p.S182C | Q7Z434 | protein_coding | deleterious(0.04) | possibly_damaging(0.826) | TCGA-Q1-A73O-01 | Cervix | cervical & endocervical cancer | Female | <65 | I/II | Chemotherapy | cisplatin | CR |
| MAVS | SNV | Missense_Mutation | | c.1438N>C | p.Glu480Gln | p.E480Q | Q7Z434 | protein_coding | tolerated(0.22) | possibly_damaging(0.605) | TCGA-Q1-A73O-01 | Cervix | cervical & endocervical cancer | Female | <65 | I/II | Chemotherapy | cisplatin | CR |
| MAVS | SNV | Missense_Mutation | novel | c.835N>A | p.Glu279Lys | p.E279K | Q7Z434 | protein_coding | tolerated(0.33) | benign(0.02) | TCGA-AA-3994-01 | Colorectum | colon adenocarcinoma | Male | >=65 | III/IV | Chemotherapy | capecitabine | CR |
| MAVS | SNV | Missense_Mutation | | c.1459N>A | p.Ala487Thr | p.A487T | Q7Z434 | protein_coding | tolerated(0.27) | benign(0.034) | TCGA-AZ-4615-01 | Colorectum | colon adenocarcinoma | Male | >=65 | III/IV | Chemotherapy | xeloda | PD |


