
|
|||||
|
 | |
| |
| |
| |
| |
| |
|
Gene: HCLS1 |
Gene summary for HCLS1 |
| Gene information | Species | Human | Gene symbol | HCLS1 | Gene ID | 3059 |
| Gene name | hematopoietic cell-specific Lyn substrate 1 | |
| Gene Alias | CTTNL | |
| Cytomap | 3q13.33 | |
| Gene Type | protein-coding | GO ID | GO:0000122 | UniProtAcc | P14317 |
Top |
Malignant transformation analysis |
| Identification of the aberrant gene expression in precancerous and cancerous lesions by comparing the gene expression of stem-like cells in diseased tissues with normal stem cells |
| Entrez ID | Symbol | Replicates | Species | Organ | Tissue | Adj P-value | Log2FC | Malignancy |
| 3059 | HCLS1 | LZE2D | Human | Esophagus | HGIN | 8.75e-03 | 5.55e-01 | 0.0642 |
| 3059 | HCLS1 | LZE4T | Human | Esophagus | ESCC | 4.80e-07 | 3.15e-01 | 0.0811 |
| 3059 | HCLS1 | LZE5T | Human | Esophagus | ESCC | 4.96e-05 | 3.33e-01 | 0.0514 |
| 3059 | HCLS1 | LZE7T | Human | Esophagus | ESCC | 5.99e-08 | 5.06e-01 | 0.0667 |
| 3059 | HCLS1 | LZE22D1 | Human | Esophagus | HGIN | 9.40e-04 | 2.26e-01 | 0.0595 |
| 3059 | HCLS1 | LZE22T | Human | Esophagus | ESCC | 9.86e-05 | 3.85e-01 | 0.068 |
| 3059 | HCLS1 | LZE24T | Human | Esophagus | ESCC | 1.95e-02 | 1.13e-01 | 0.0596 |
| 3059 | HCLS1 | LZE6T | Human | Esophagus | ESCC | 8.68e-15 | 6.67e-01 | 0.0845 |
| 3059 | HCLS1 | P1T-E | Human | Esophagus | ESCC | 5.07e-05 | 5.41e-01 | 0.0875 |
| 3059 | HCLS1 | P8T-E | Human | Esophagus | ESCC | 3.32e-61 | 1.06e+00 | 0.0889 |
| 3059 | HCLS1 | P15T-E | Human | Esophagus | ESCC | 6.11e-27 | 6.88e-01 | 0.1149 |
| 3059 | HCLS1 | P23T-E | Human | Esophagus | ESCC | 1.07e-28 | 8.90e-01 | 0.108 |
| 3059 | HCLS1 | P28T-E | Human | Esophagus | ESCC | 3.87e-03 | 2.09e-01 | 0.1149 |
| 3059 | HCLS1 | P47T-E | Human | Esophagus | ESCC | 3.86e-17 | 4.29e-01 | 0.1067 |
| 3059 | HCLS1 | P61T-E | Human | Esophagus | ESCC | 2.24e-34 | 9.22e-01 | 0.099 |
| 3059 | HCLS1 | P65T-E | Human | Esophagus | ESCC | 7.25e-03 | 1.40e-01 | 0.0978 |
| 3059 | HCLS1 | P74T-E | Human | Esophagus | ESCC | 1.25e-02 | 1.80e-01 | 0.1479 |
| 3059 | HCLS1 | P76T-E | Human | Esophagus | ESCC | 1.72e-04 | 2.19e-01 | 0.1207 |
| 3059 | HCLS1 | P127T-E | Human | Esophagus | ESCC | 2.66e-41 | 8.47e-01 | 0.0826 |
| 3059 | HCLS1 | P128T-E | Human | Esophagus | ESCC | 3.39e-38 | 1.40e+00 | 0.1241 |
| Page: 1 2 |
| Tissue | Expression Dynamics | Abbreviation |
| Esophagus |  | ESCC: Esophageal squamous cell carcinoma |
| HGIN: High-grade intraepithelial neoplasias | ||
| LGIN: Low-grade intraepithelial neoplasias | ||
| Oral Cavity | 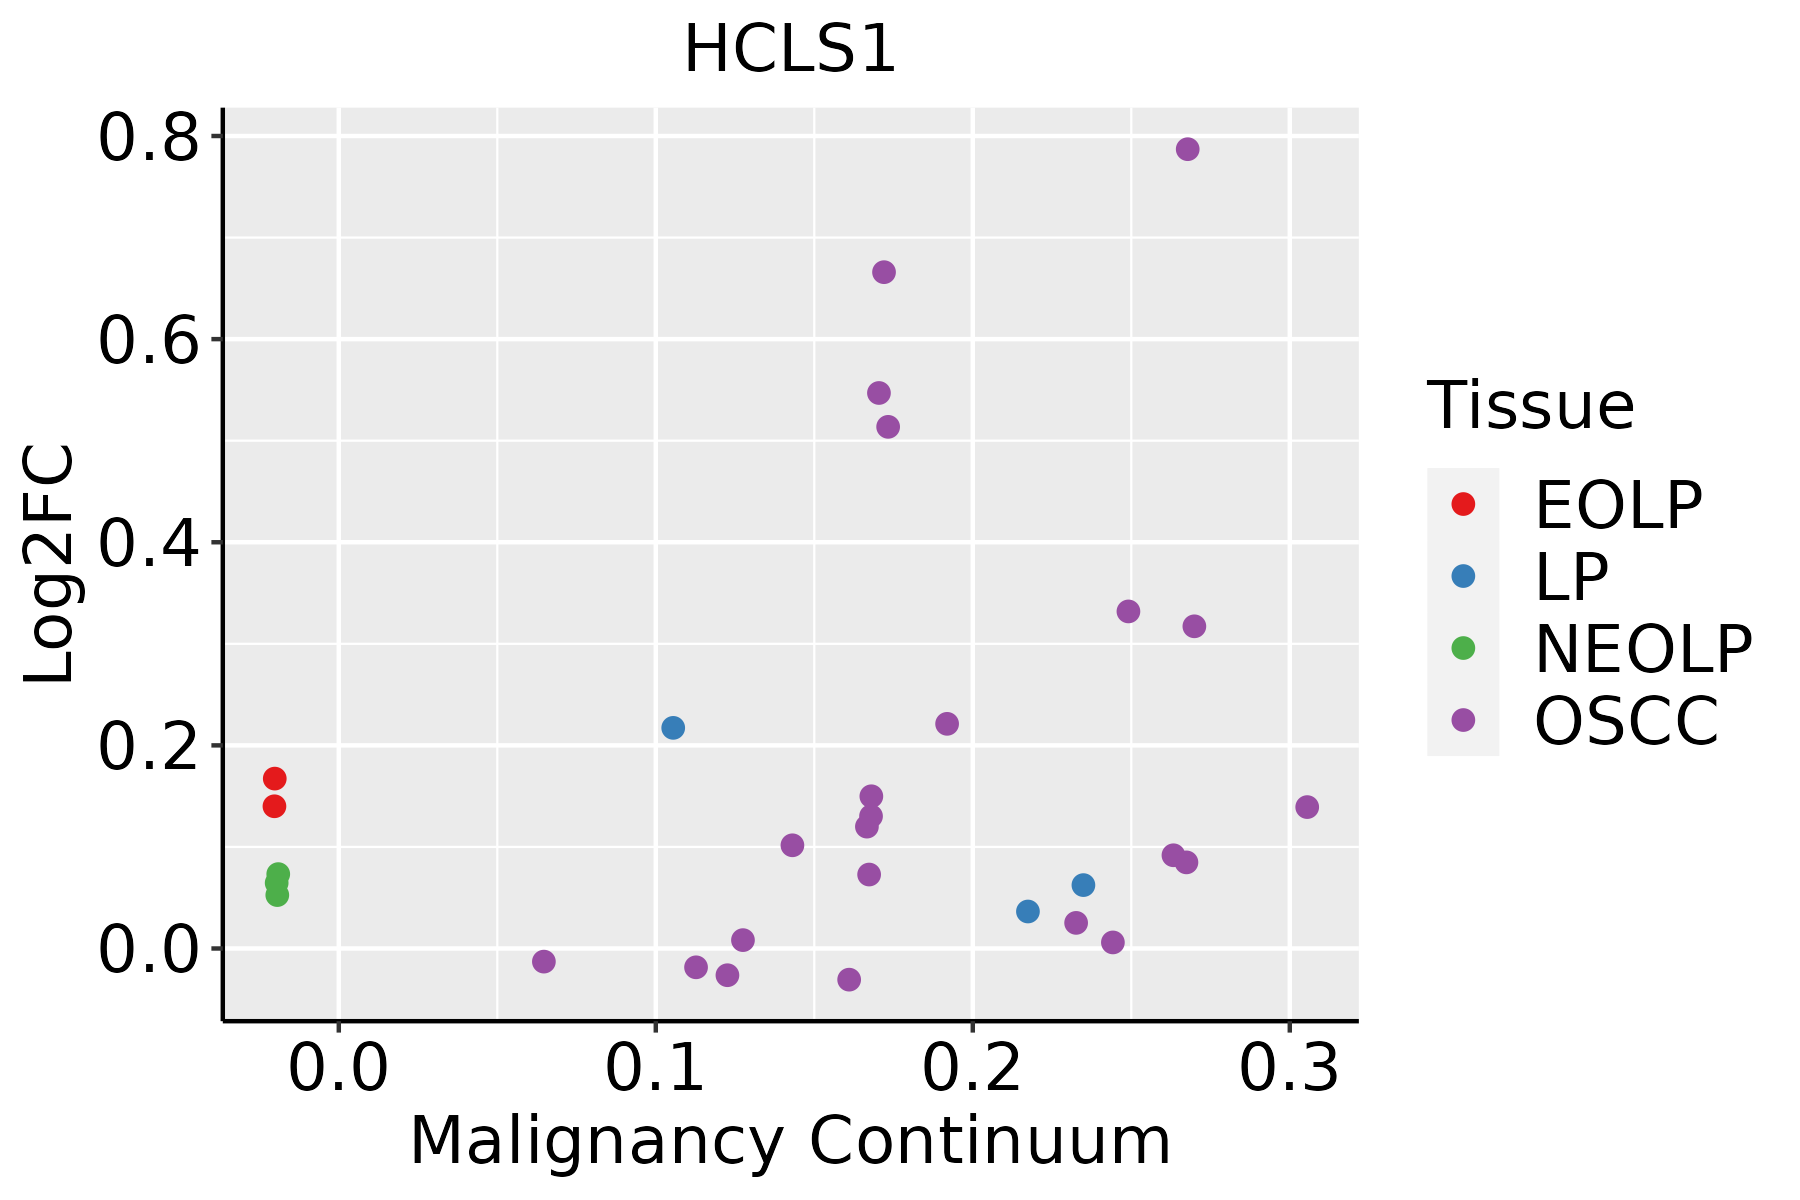 | EOLP: Erosive Oral lichen planus |
| LP: leukoplakia | ||
| NEOLP: Non-erosive oral lichen planus | ||
| OSCC: Oral squamous cell carcinoma | ||
| Prostate |  | BPH: Benign Prostatic Hyperplasia |
| Thyroid |  | ATC: Anaplastic thyroid cancer |
| HT: Hashimoto's thyroiditis | ||
| PTC: Papillary thyroid cancer |
| ∗log2FC in expression of this searched gene in stem-like cells from each diseased tissue sample relative to stem-like cells in normal samples in each tissue plotted against the malignancy continuum. Samples are colored based on if they are from different disease stage. |
Top |
Malignant transformation related pathway analysis |
| Find out the enriched GO biological processes and KEGG pathways involved in transition from healthy to precancer to cancer |
| Tissue | Disease Stage | Enriched GO biological Processes |
| Colorectum | AD |  |
| Colorectum | SER |  |
| Colorectum | MSS |  |
| Colorectum | MSI-H |  |
| Colorectum | FAP |  |
| ∗Top 15 enriched GO BP terms are showed in the bar plot of each disease state in each tissue. Each row represents a significant GO biological process which is colored according to the -log10(p.adjust). |
| Page: 1 2 3 4 5 6 7 8 9 |
| GO ID | Tissue | Disease Stage | Description | Gene Ratio | Bg Ratio | pvalue | p.adjust | Count |
| GO:0030833110 | Thyroid | ATC | regulation of actin filament polymerization | 91/6293 | 172/18723 | 1.34e-07 | 2.20e-06 | 91 |
| GO:0031532111 | Thyroid | ATC | actin cytoskeleton reorganization | 62/6293 | 107/18723 | 2.01e-07 | 3.17e-06 | 62 |
| GO:000226234 | Thyroid | ATC | myeloid cell homeostasis | 84/6293 | 157/18723 | 2.12e-07 | 3.33e-06 | 84 |
| GO:000660617 | Thyroid | ATC | protein import into nucleus | 83/6293 | 155/18723 | 2.38e-07 | 3.70e-06 | 83 |
| GO:190459119 | Thyroid | ATC | positive regulation of protein import | 31/6293 | 43/18723 | 2.80e-07 | 4.25e-06 | 31 |
| GO:190458918 | Thyroid | ATC | regulation of protein import | 41/6293 | 63/18723 | 3.19e-07 | 4.76e-06 | 41 |
| GO:003410134 | Thyroid | ATC | erythrocyte homeostasis | 71/6293 | 129/18723 | 4.36e-07 | 6.34e-06 | 71 |
| GO:004230718 | Thyroid | ATC | positive regulation of protein import into nucleus | 29/6293 | 41/18723 | 1.30e-06 | 1.66e-05 | 29 |
| GO:004230617 | Thyroid | ATC | regulation of protein import into nucleus | 38/6293 | 60/18723 | 2.34e-06 | 2.76e-05 | 38 |
| GO:003009933 | Thyroid | ATC | myeloid cell differentiation | 170/6293 | 381/18723 | 4.26e-06 | 4.68e-05 | 170 |
| GO:0030218210 | Thyroid | ATC | erythrocyte differentiation | 64/6293 | 120/18723 | 6.52e-06 | 6.76e-05 | 64 |
| GO:005109022 | Thyroid | ATC | regulation of DNA-binding transcription factor activity | 190/6293 | 440/18723 | 1.49e-05 | 1.39e-04 | 190 |
| GO:007188711 | Thyroid | ATC | leukocyte apoptotic process | 53/6293 | 106/18723 | 3.48e-04 | 2.16e-03 | 53 |
| GO:200024914 | Thyroid | ATC | regulation of actin cytoskeleton reorganization | 23/6293 | 39/18723 | 1.01e-03 | 5.34e-03 | 23 |
| GO:001821211 | Thyroid | ATC | peptidyl-tyrosine modification | 156/6293 | 378/18723 | 1.01e-03 | 5.36e-03 | 156 |
| GO:005109122 | Thyroid | ATC | positive regulation of DNA-binding transcription factor activity | 111/6293 | 260/18723 | 1.32e-03 | 6.88e-03 | 111 |
| GO:00181086 | Thyroid | ATC | peptidyl-tyrosine phosphorylation | 153/6293 | 375/18723 | 1.96e-03 | 9.48e-03 | 153 |
| GO:003313512 | Thyroid | ATC | regulation of peptidyl-serine phosphorylation | 65/6293 | 144/18723 | 2.57e-03 | 1.18e-02 | 65 |
| GO:1903706112 | Thyroid | ATC | regulation of hemopoiesis | 148/6293 | 367/18723 | 3.87e-03 | 1.68e-02 | 148 |
| GO:20001062 | Thyroid | ATC | regulation of leukocyte apoptotic process | 39/6293 | 81/18723 | 4.65e-03 | 1.92e-02 | 39 |
| Page: 1 2 3 4 5 6 7 8 9 10 11 12 13 14 15 16 17 18 19 20 21 |
| Pathway ID | Tissue | Disease Stage | Description | Gene Ratio | Bg Ratio | pvalue | p.adjust | qvalue | Count |
| hsa0513139 | Esophagus | HGIN | Shigellosis | 71/1383 | 247/8465 | 4.89e-07 | 7.98e-06 | 6.34e-06 | 71 |
| hsa0510039 | Esophagus | HGIN | Bacterial invasion of epithelial cells | 30/1383 | 77/8465 | 1.49e-06 | 2.31e-05 | 1.84e-05 | 30 |
| hsa0513039 | Esophagus | HGIN | Pathogenic Escherichia coli infection | 54/1383 | 197/8465 | 4.91e-05 | 6.15e-04 | 4.89e-04 | 54 |
| hsa0453039 | Esophagus | HGIN | Tight junction | 40/1383 | 169/8465 | 8.18e-03 | 4.71e-02 | 3.74e-02 | 40 |
| hsa0520528 | Esophagus | HGIN | Proteoglycans in cancer | 47/1383 | 205/8465 | 8.23e-03 | 4.71e-02 | 3.74e-02 | 47 |
| hsa05131114 | Esophagus | HGIN | Shigellosis | 71/1383 | 247/8465 | 4.89e-07 | 7.98e-06 | 6.34e-06 | 71 |
| hsa05100114 | Esophagus | HGIN | Bacterial invasion of epithelial cells | 30/1383 | 77/8465 | 1.49e-06 | 2.31e-05 | 1.84e-05 | 30 |
| hsa05130115 | Esophagus | HGIN | Pathogenic Escherichia coli infection | 54/1383 | 197/8465 | 4.91e-05 | 6.15e-04 | 4.89e-04 | 54 |
| hsa04530115 | Esophagus | HGIN | Tight junction | 40/1383 | 169/8465 | 8.18e-03 | 4.71e-02 | 3.74e-02 | 40 |
| hsa05205112 | Esophagus | HGIN | Proteoglycans in cancer | 47/1383 | 205/8465 | 8.23e-03 | 4.71e-02 | 3.74e-02 | 47 |
| hsa05131211 | Esophagus | ESCC | Shigellosis | 176/4205 | 247/8465 | 2.27e-12 | 4.01e-11 | 2.05e-11 | 176 |
| hsa05130211 | Esophagus | ESCC | Pathogenic Escherichia coli infection | 142/4205 | 197/8465 | 8.21e-11 | 1.06e-09 | 5.42e-10 | 142 |
| hsa0520529 | Esophagus | ESCC | Proteoglycans in cancer | 138/4205 | 205/8465 | 1.79e-07 | 1.40e-06 | 7.15e-07 | 138 |
| hsa05100211 | Esophagus | ESCC | Bacterial invasion of epithelial cells | 59/4205 | 77/8465 | 1.05e-06 | 6.76e-06 | 3.46e-06 | 59 |
| hsa04530211 | Esophagus | ESCC | Tight junction | 105/4205 | 169/8465 | 6.73e-04 | 2.23e-03 | 1.14e-03 | 105 |
| hsa05131310 | Esophagus | ESCC | Shigellosis | 176/4205 | 247/8465 | 2.27e-12 | 4.01e-11 | 2.05e-11 | 176 |
| hsa05130310 | Esophagus | ESCC | Pathogenic Escherichia coli infection | 142/4205 | 197/8465 | 8.21e-11 | 1.06e-09 | 5.42e-10 | 142 |
| hsa0520537 | Esophagus | ESCC | Proteoglycans in cancer | 138/4205 | 205/8465 | 1.79e-07 | 1.40e-06 | 7.15e-07 | 138 |
| hsa05100310 | Esophagus | ESCC | Bacterial invasion of epithelial cells | 59/4205 | 77/8465 | 1.05e-06 | 6.76e-06 | 3.46e-06 | 59 |
| hsa04530310 | Esophagus | ESCC | Tight junction | 105/4205 | 169/8465 | 6.73e-04 | 2.23e-03 | 1.14e-03 | 105 |
| Page: 1 2 3 |
Top |
Cell-cell communication analysis |
| Identification of potential cell-cell interactions between two cell types and their ligand-receptor pairs for different disease states |
| Ligand | Receptor | LRpair | Pathway | Tissue | Disease Stage |
| Page: 1 |
Top |
Single-cell gene regulatory network inference analysis |
| Find out the significant the regulons (TFs) and the target genes of each regulon across cell types for different disease states |
| TF | Cell Type | Tissue | Disease Stage | Target Gene | RSS | Regulon Activity |
| HCLS1 | M2MAC | Esophagus | ADJ | FUBP1,HEXB,FENDRR, etc. | 2.84e-01 |  |
| HCLS1 | M2MAC | Esophagus | ESCC | FUBP1,HEXB,FENDRR, etc. | 2.94e-01 |  |
| ∗The dot plots of a searched regulon are shown for all cell subpopulations in each disease state of each tissue based on the regulon specific score inferred using pySCENIC and by calculating the average expression. |
| Page: 1 |
Top |
Somatic mutation of malignant transformation related genes |
| Annotation of somatic variants for genes involved in malignant transformation |
| Hugo Symbol | Variant Class | Variant Classification | dbSNP RS | HGVSc | HGVSp | HGVSp Short | SWISSPROT | BIOTYPE | SIFT | PolyPhen | Tumor Sample Barcode | Tissue | Histology | Sex | Age | Stage | Therapy Types | Drugs | Outcome |
| HCLS1 | SNV | Missense_Mutation | novel | c.495N>C | p.Lys165Asn | p.K165N | P14317 | protein_coding | deleterious(0.01) | possibly_damaging(0.88) | TCGA-A1-A0SH-01 | Breast | breast invasive carcinoma | Female | <65 | I/II | Chemotherapy | tc | SD |
| HCLS1 | SNV | Missense_Mutation | rs202020296 | c.631N>A | p.Gly211Ser | p.G211S | P14317 | protein_coding | tolerated(0.13) | possibly_damaging(0.596) | TCGA-AC-A8OP-01 | Breast | breast invasive carcinoma | Female | >=65 | I/II | Unknown | Unknown | SD |
| HCLS1 | SNV | Missense_Mutation | c.304N>C | p.Glu102Gln | p.E102Q | P14317 | protein_coding | deleterious(0) | probably_damaging(0.949) | TCGA-D8-A27V-01 | Breast | breast invasive carcinoma | Female | <65 | I/II | Hormone Therapy | tamoxiphen | SD | |
| HCLS1 | SNV | Missense_Mutation | c.158N>C | p.Asn53Thr | p.N53T | P14317 | protein_coding | deleterious(0) | benign(0.283) | TCGA-EK-A2RN-01 | Cervix | cervical & endocervical cancer | Female | <65 | I/II | Unknown | Unknown | SD | |
| HCLS1 | SNV | Missense_Mutation | rs767550556 | c.553G>A | p.Glu185Lys | p.E185K | P14317 | protein_coding | deleterious(0.01) | probably_damaging(0.917) | TCGA-AA-3511-01 | Colorectum | colon adenocarcinoma | Male | <65 | I/II | Unknown | Unknown | PD |
| HCLS1 | SNV | Missense_Mutation | rs147125943 | c.1300N>A | p.Val434Met | p.V434M | P14317 | protein_coding | deleterious(0.05) | possibly_damaging(0.622) | TCGA-AA-3663-01 | Colorectum | colon adenocarcinoma | Male | <65 | I/II | Unknown | Unknown | SD |
| HCLS1 | SNV | Missense_Mutation | rs770634522 | c.278N>A | p.Arg93Gln | p.R93Q | P14317 | protein_coding | deleterious(0) | probably_damaging(0.989) | TCGA-AA-3977-01 | Colorectum | colon adenocarcinoma | Male | >=65 | I/II | Unknown | Unknown | SD |
| HCLS1 | SNV | Missense_Mutation | c.114N>T | p.Trp38Cys | p.W38C | P14317 | protein_coding | deleterious(0) | benign(0.185) | TCGA-AD-A5EJ-01 | Colorectum | colon adenocarcinoma | Female | >=65 | I/II | Unknown | Unknown | SD | |
| HCLS1 | SNV | Missense_Mutation | novel | c.824N>A | p.Ser275Asn | p.S275N | P14317 | protein_coding | tolerated(0.55) | benign(0.09) | TCGA-AZ-4315-01 | Colorectum | colon adenocarcinoma | Male | <65 | I/II | Unknown | Unknown | SD |
| HCLS1 | SNV | Missense_Mutation | c.1415N>A | p.Gly472Asp | p.G472D | P14317 | protein_coding | deleterious(0) | probably_damaging(1) | TCGA-AZ-6601-01 | Colorectum | colon adenocarcinoma | Male | >=65 | I/II | Unknown | Unknown | PD |
| Page: 1 2 3 4 5 6 |
Top |
Related drugs of malignant transformation related genes |
| Identification of chemicals and drugs interact with genes involved in malignant transfromation |
| (DGIdb 4.0) |
| Entrez ID | Symbol | Category | Interaction Types | Drug Claim Name | Drug Name | PMIDs |
| Page: 1 |

Copyright 2023-Present -The University of Texas Health Science Center at Houston |