
|
|||||
|
 | |
| |
| |
| |
| |
| |
|
Gene: FMN1 |
Gene summary for FMN1 |
| Gene information | Species | Human | Gene symbol | FMN1 | Gene ID | 342184 |
| Gene name | formin 1 | |
| Gene Alias | FMN | |
| Cytomap | 15q13.3 | |
| Gene Type | protein-coding | GO ID | GO:0001501 | UniProtAcc | Q68DA7 |
Top |
Malignant transformation analysis |
| Identification of the aberrant gene expression in precancerous and cancerous lesions by comparing the gene expression of stem-like cells in diseased tissues with normal stem cells |
| Entrez ID | Symbol | Replicates | Species | Organ | Tissue | Adj P-value | Log2FC | Malignancy |
| 342184 | FMN1 | HTA11_3410_2000001011 | Human | Colorectum | AD | 2.00e-28 | -7.39e-01 | 0.0155 |
| 342184 | FMN1 | HTA11_2951_2000001011 | Human | Colorectum | AD | 2.06e-04 | -8.00e-01 | 0.0216 |
| 342184 | FMN1 | HTA11_3361_2000001011 | Human | Colorectum | AD | 1.05e-06 | -5.91e-01 | -0.1207 |
| 342184 | FMN1 | HTA11_5212_2000001011 | Human | Colorectum | AD | 1.48e-04 | -7.03e-01 | -0.2061 |
| 342184 | FMN1 | HTA11_866_3004761011 | Human | Colorectum | AD | 2.61e-08 | -5.74e-01 | 0.096 |
| 342184 | FMN1 | HTA11_8622_2000001021 | Human | Colorectum | SER | 8.31e-07 | -7.98e-01 | 0.0528 |
| 342184 | FMN1 | HTA11_10711_2000001011 | Human | Colorectum | AD | 1.69e-07 | -5.81e-01 | 0.0338 |
| 342184 | FMN1 | HTA11_7696_3000711011 | Human | Colorectum | AD | 3.59e-10 | -4.72e-01 | 0.0674 |
| 342184 | FMN1 | HTA11_99999970781_79442 | Human | Colorectum | MSS | 1.47e-20 | -5.95e-01 | 0.294 |
| 342184 | FMN1 | HTA11_99999971662_82457 | Human | Colorectum | MSS | 1.38e-37 | -8.42e-01 | 0.3859 |
| 342184 | FMN1 | HTA11_99999974143_84620 | Human | Colorectum | MSS | 1.26e-17 | -5.66e-01 | 0.3005 |
| 342184 | FMN1 | A015-C-203 | Human | Colorectum | FAP | 2.85e-36 | -5.20e-01 | -0.1294 |
| 342184 | FMN1 | A015-C-204 | Human | Colorectum | FAP | 4.38e-06 | -3.83e-01 | -0.0228 |
| 342184 | FMN1 | A014-C-040 | Human | Colorectum | FAP | 4.09e-04 | -4.46e-01 | -0.1184 |
| 342184 | FMN1 | A002-C-201 | Human | Colorectum | FAP | 1.36e-12 | -3.55e-01 | 0.0324 |
| 342184 | FMN1 | A002-C-203 | Human | Colorectum | FAP | 1.72e-02 | -2.43e-01 | 0.2786 |
| 342184 | FMN1 | A001-C-119 | Human | Colorectum | FAP | 5.18e-06 | -4.66e-01 | -0.1557 |
| 342184 | FMN1 | A001-C-108 | Human | Colorectum | FAP | 1.42e-18 | -3.37e-01 | -0.0272 |
| 342184 | FMN1 | A002-C-021 | Human | Colorectum | FAP | 1.32e-02 | -4.43e-02 | 0.1171 |
| 342184 | FMN1 | A002-C-205 | Human | Colorectum | FAP | 6.18e-26 | -5.79e-01 | -0.1236 |
| Page: 1 2 3 4 |
| Tissue | Expression Dynamics | Abbreviation |
| Colorectum (GSE201348) |  | FAP: Familial adenomatous polyposis |
| CRC: Colorectal cancer | ||
| Colorectum (HTA11) |  | AD: Adenomas |
| SER: Sessile serrated lesions | ||
| MSI-H: Microsatellite-high colorectal cancer | ||
| MSS: Microsatellite stable colorectal cancer | ||
| Endometrium |  | AEH: Atypical endometrial hyperplasia |
| EEC: Endometrioid Cancer | ||
| Lung | 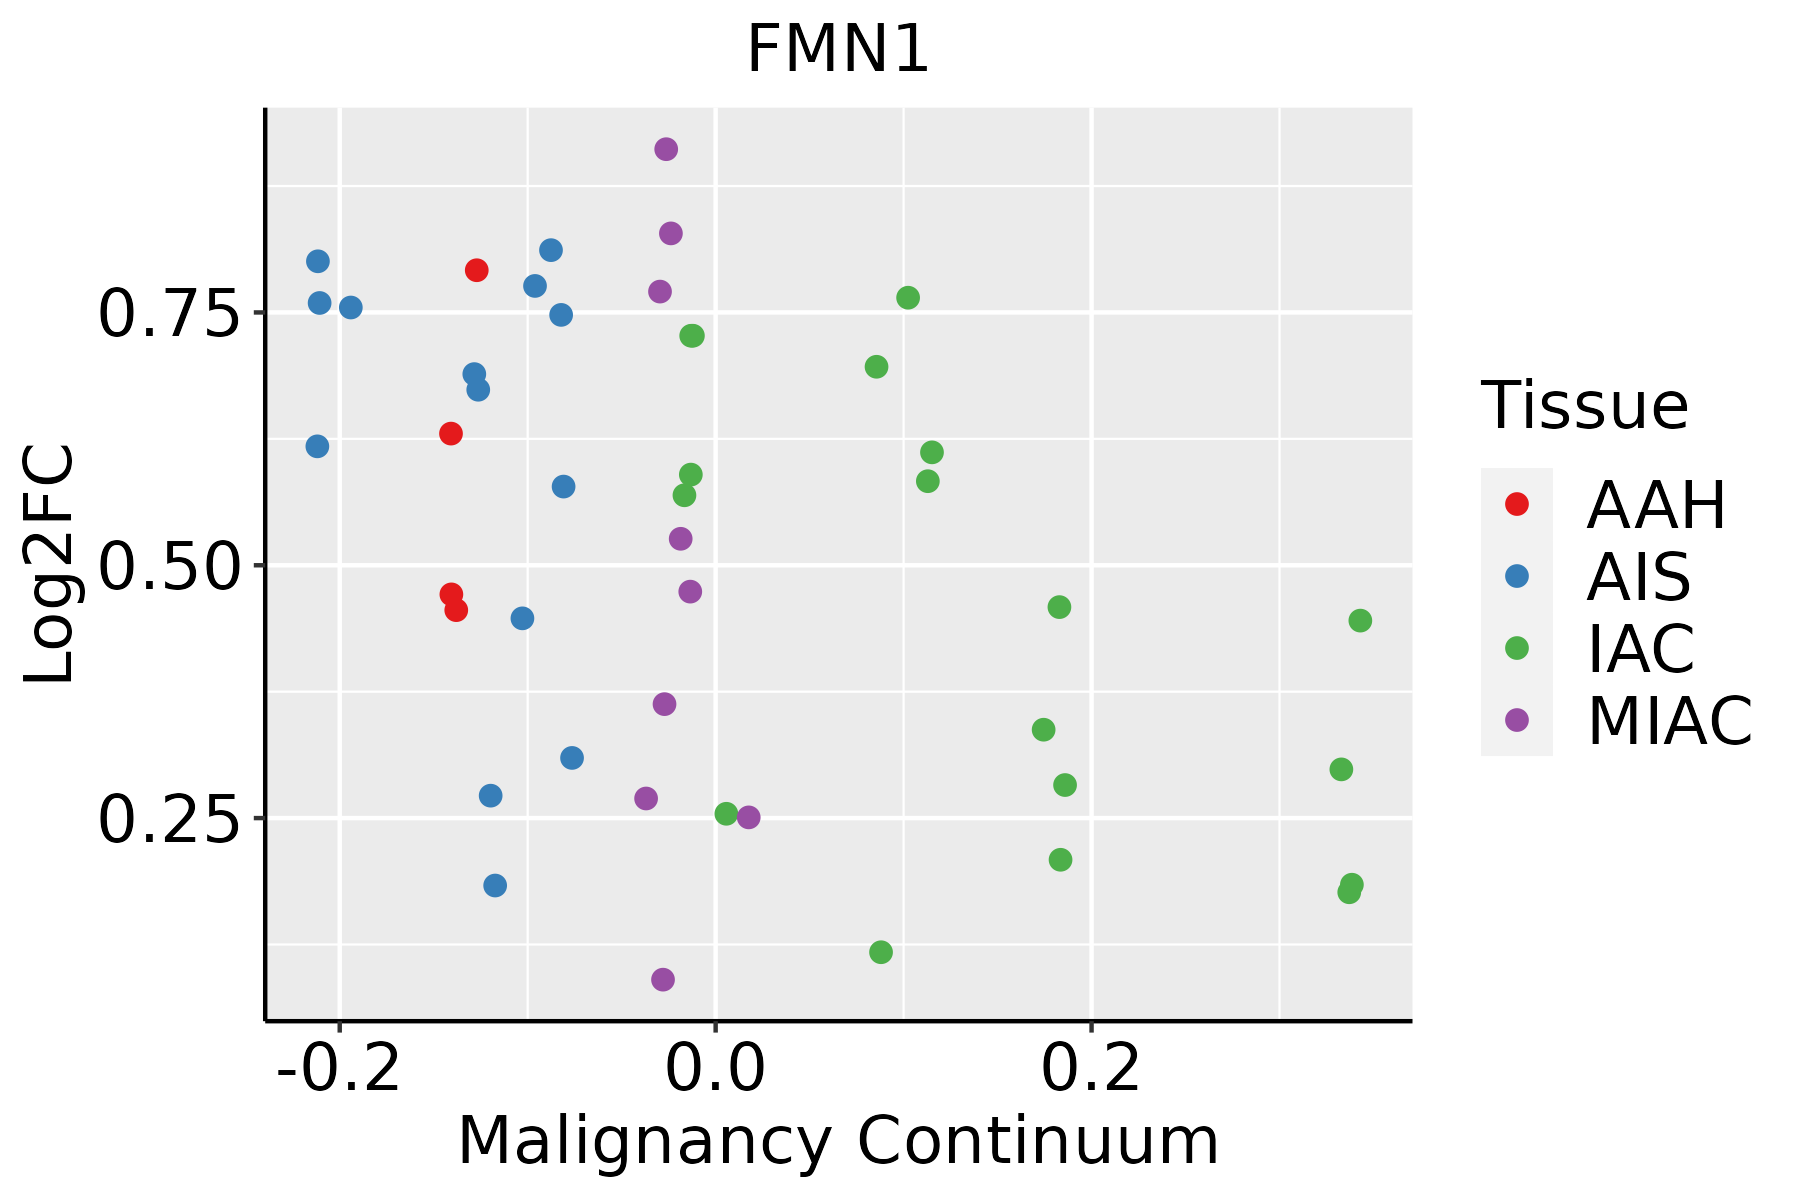 | AAH: Atypical adenomatous hyperplasia |
| AIS: Adenocarcinoma in situ | ||
| IAC: Invasive lung adenocarcinoma | ||
| MIA: Minimally invasive adenocarcinoma | ||
| Thyroid | 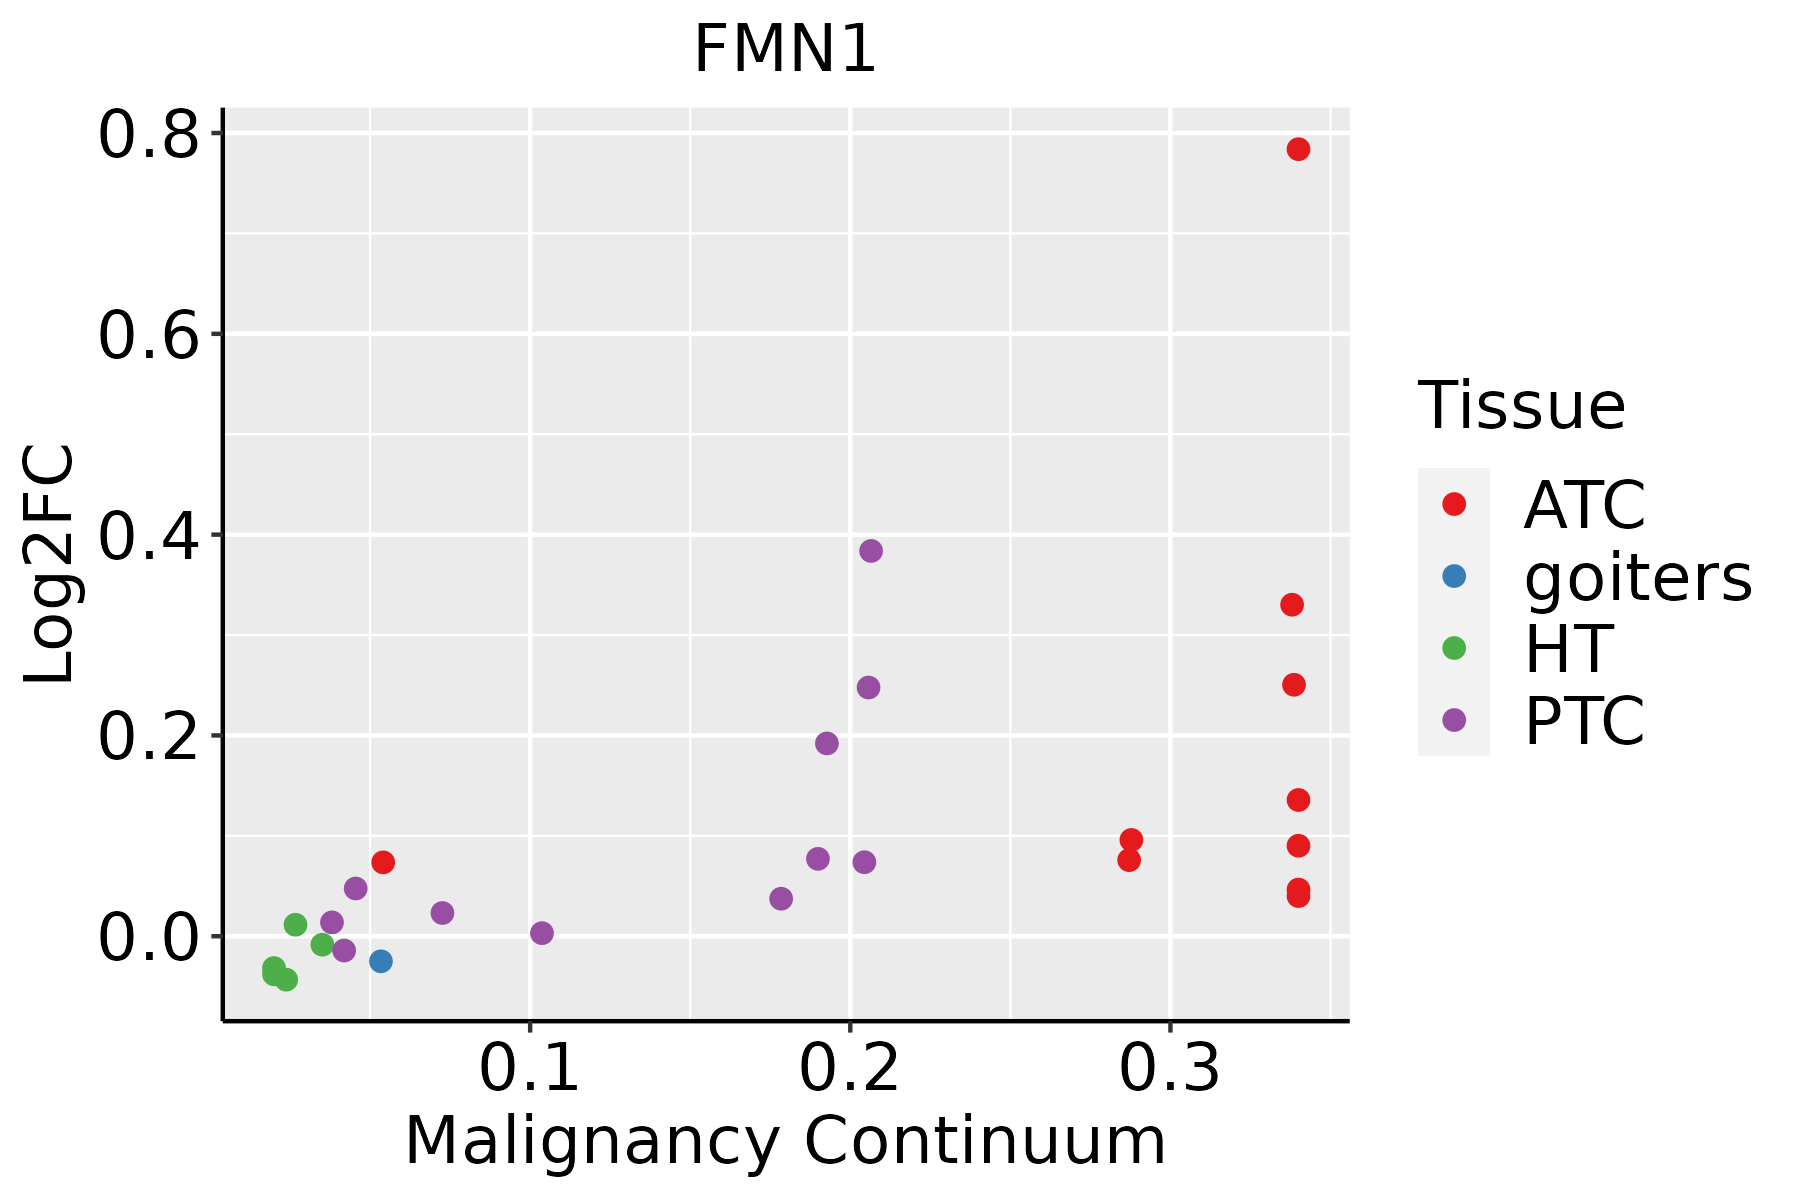 | ATC: Anaplastic thyroid cancer |
| HT: Hashimoto's thyroiditis | ||
| PTC: Papillary thyroid cancer |
| ∗log2FC in expression of this searched gene in stem-like cells from each diseased tissue sample relative to stem-like cells in normal samples in each tissue plotted against the malignancy continuum. Samples are colored based on if they are from different disease stage. |
Top |
Malignant transformation related pathway analysis |
| Find out the enriched GO biological processes and KEGG pathways involved in transition from healthy to precancer to cancer |
| Tissue | Disease Stage | Enriched GO biological Processes |
| Colorectum | AD |  |
| Colorectum | SER |  |
| Colorectum | MSS |  |
| Colorectum | MSI-H |  |
| Colorectum | FAP |  |
| ∗Top 15 enriched GO BP terms are showed in the bar plot of each disease state in each tissue. Each row represents a significant GO biological process which is colored according to the -log10(p.adjust). |
| Page: 1 2 3 4 5 6 7 8 9 |
| GO ID | Tissue | Disease Stage | Description | Gene Ratio | Bg Ratio | pvalue | p.adjust | Count |
| GO:00322738 | Lung | IAC | positive regulation of protein polymerization | 26/2061 | 138/18723 | 4.29e-03 | 3.41e-02 | 26 |
| GO:19029058 | Lung | IAC | positive regulation of supramolecular fiber organization | 36/2061 | 209/18723 | 4.34e-03 | 3.44e-02 | 36 |
| GO:00081548 | Lung | IAC | actin polymerization or depolymerization | 37/2061 | 218/18723 | 4.96e-03 | 3.79e-02 | 37 |
| GO:00720063 | Lung | IAC | nephron development | 26/2061 | 142/18723 | 6.32e-03 | 4.51e-02 | 26 |
| GO:000716012 | Lung | AIS | cell-matrix adhesion | 60/1849 | 233/18723 | 2.19e-12 | 2.55e-09 | 60 |
| GO:003158913 | Lung | AIS | cell-substrate adhesion | 80/1849 | 363/18723 | 3.80e-12 | 3.16e-09 | 80 |
| GO:000704413 | Lung | AIS | cell-substrate junction assembly | 34/1849 | 95/18723 | 8.17e-12 | 5.29e-09 | 34 |
| GO:015011513 | Lung | AIS | cell-substrate junction organization | 34/1849 | 101/18723 | 5.74e-11 | 2.09e-08 | 34 |
| GO:001081013 | Lung | AIS | regulation of cell-substrate adhesion | 55/1849 | 221/18723 | 7.48e-11 | 2.49e-08 | 55 |
| GO:004804112 | Lung | AIS | focal adhesion assembly | 31/1849 | 87/18723 | 7.71e-11 | 2.49e-08 | 31 |
| GO:000701513 | Lung | AIS | actin filament organization | 88/1849 | 442/18723 | 1.02e-10 | 3.13e-08 | 88 |
| GO:005189313 | Lung | AIS | regulation of focal adhesion assembly | 26/1849 | 66/18723 | 1.99e-10 | 5.52e-08 | 26 |
| GO:009010913 | Lung | AIS | regulation of cell-substrate junction assembly | 26/1849 | 66/18723 | 1.99e-10 | 5.52e-08 | 26 |
| GO:003432912 | Lung | AIS | cell junction assembly | 84/1849 | 420/18723 | 2.16e-10 | 5.71e-08 | 84 |
| GO:000195212 | Lung | AIS | regulation of cell-matrix adhesion | 38/1849 | 128/18723 | 2.93e-10 | 7.42e-08 | 38 |
| GO:015011613 | Lung | AIS | regulation of cell-substrate junction organization | 26/1849 | 71/18723 | 1.30e-09 | 2.52e-07 | 26 |
| GO:006056012 | Lung | AIS | developmental growth involved in morphogenesis | 51/1849 | 234/18723 | 4.43e-08 | 5.24e-06 | 51 |
| GO:004578513 | Lung | AIS | positive regulation of cell adhesion | 77/1849 | 437/18723 | 3.40e-07 | 2.83e-05 | 77 |
| GO:000165511 | Lung | AIS | urogenital system development | 63/1849 | 338/18723 | 5.46e-07 | 4.08e-05 | 63 |
| GO:003295613 | Lung | AIS | regulation of actin cytoskeleton organization | 63/1849 | 358/18723 | 4.06e-06 | 2.09e-04 | 63 |
| Page: 1 2 3 4 5 6 7 8 9 10 11 12 13 14 15 16 17 18 19 20 21 22 23 24 25 26 27 28 29 |
| Pathway ID | Tissue | Disease Stage | Description | Gene Ratio | Bg Ratio | pvalue | p.adjust | qvalue | Count |
| Page: 1 |
Top |
Cell-cell communication analysis |
| Identification of potential cell-cell interactions between two cell types and their ligand-receptor pairs for different disease states |
| Ligand | Receptor | LRpair | Pathway | Tissue | Disease Stage |
| Page: 1 |
Top |
Single-cell gene regulatory network inference analysis |
| Find out the significant the regulons (TFs) and the target genes of each regulon across cell types for different disease states |
| TF | Cell Type | Tissue | Disease Stage | Target Gene | RSS | Regulon Activity |
| ∗The dot plots of a searched regulon are shown for all cell subpopulations in each disease state of each tissue based on the regulon specific score inferred using pySCENIC and by calculating the average expression. |
| Page: 1 |
Top |
Somatic mutation of malignant transformation related genes |
| Annotation of somatic variants for genes involved in malignant transformation |
| Hugo Symbol | Variant Class | Variant Classification | dbSNP RS | HGVSc | HGVSp | HGVSp Short | SWISSPROT | BIOTYPE | SIFT | PolyPhen | Tumor Sample Barcode | Tissue | Histology | Sex | Age | Stage | Therapy Types | Drugs | Outcome |
| FMN1 | SNV | Missense_Mutation | c.2578A>G | p.Met860Val | p.M860V | Q68DA7 | protein_coding | tolerated(1) | benign(0) | TCGA-A2-A04U-01 | Breast | breast invasive carcinoma | Female | <65 | I/II | Chemotherapy | adriamycin | SD | |
| FMN1 | SNV | Missense_Mutation | rs200873951 | c.3700C>T | p.Arg1234Cys | p.R1234C | Q68DA7 | protein_coding | deleterious(0) | possibly_damaging(0.685) | TCGA-AN-A0AK-01 | Breast | breast invasive carcinoma | Female | >=65 | I/II | Unknown | Unknown | SD |
| FMN1 | SNV | Missense_Mutation | c.3587G>A | p.Arg1196Lys | p.R1196K | Q68DA7 | protein_coding | tolerated(0.09) | possibly_damaging(0.809) | TCGA-AO-A12A-01 | Breast | breast invasive carcinoma | Female | <65 | I/II | Chemotherapy | cyclophosphamide | SD | |
| FMN1 | SNV | Missense_Mutation | novel | c.4081G>A | p.Asp1361Asn | p.D1361N | Q68DA7 | protein_coding | deleterious(0) | probably_damaging(0.991) | TCGA-AQ-A0Y5-01 | Breast | breast invasive carcinoma | Female | >=65 | III/IV | Chemotherapy | cytoxan | SD |
| FMN1 | SNV | Missense_Mutation | c.2522N>A | p.Leu841His | p.L841H | Q68DA7 | protein_coding | deleterious_low_confidence(0.01) | possibly_damaging(0.781) | TCGA-AR-A0TY-01 | Breast | breast invasive carcinoma | Female | <65 | I/II | Unspecific | Paclitaxel | PD | |
| FMN1 | SNV | Missense_Mutation | c.2233G>C | p.Glu745Gln | p.E745Q | Q68DA7 | protein_coding | deleterious(0) | probably_damaging(0.922) | TCGA-BH-A0W7-01 | Breast | breast invasive carcinoma | Female | <65 | I/II | Chemotherapy | taxotere | CR | |
| FMN1 | SNV | Missense_Mutation | c.3868N>C | p.Glu1290Gln | p.E1290Q | Q68DA7 | protein_coding | tolerated(0.2) | possibly_damaging(0.466) | TCGA-D8-A27G-01 | Breast | breast invasive carcinoma | Female | >=65 | I/II | Unknown | Unknown | SD | |
| FMN1 | SNV | Missense_Mutation | novel | c.1679N>C | p.Arg560Pro | p.R560P | Q68DA7 | protein_coding | tolerated_low_confidence(0.06) | benign(0.076) | TCGA-OL-A5RV-01 | Breast | breast invasive carcinoma | Female | <65 | III/IV | Chemotherapy | doxorubicin | CR |
| FMN1 | deletion | Frame_Shift_Del | novel | c.2111delN | p.Pro704GlnfsTer12 | p.P704Qfs*12 | Q68DA7 | protein_coding | TCGA-D8-A27V-01 | Breast | breast invasive carcinoma | Female | <65 | I/II | Hormone Therapy | tamoxiphen | SD | ||
| FMN1 | deletion | Frame_Shift_Del | c.3041delN | p.Asp1014AlafsTer49 | p.D1014Afs*49 | Q68DA7 | protein_coding | TCGA-E2-A156-01 | Breast | breast invasive carcinoma | Female | <65 | I/II | Hormone Therapy | arimidex | SD |
| Page: 1 2 3 4 5 6 7 8 9 10 11 |
Top |
Related drugs of malignant transformation related genes |
| Identification of chemicals and drugs interact with genes involved in malignant transfromation |
| (DGIdb 4.0) |
| Entrez ID | Symbol | Category | Interaction Types | Drug Claim Name | Drug Name | PMIDs |
| Page: 1 |

Copyright 2023-Present -The University of Texas Health Science Center at Houston |