
|
|||||
|
 | |
| |
| |
| |
| |
| |
|
Gene: CSNK1A1 |
Gene summary for CSNK1A1 |
| Gene information | Species | Human | Gene symbol | CSNK1A1 | Gene ID | 1452 |
| Gene name | casein kinase 1 alpha 1 | |
| Gene Alias | CK1 | |
| Cytomap | 5q32 | |
| Gene Type | protein-coding | GO ID | GO:0006464 | UniProtAcc | P48729 |
Top |
Malignant transformation analysis |
| Identification of the aberrant gene expression in precancerous and cancerous lesions by comparing the gene expression of stem-like cells in diseased tissues with normal stem cells |
| Entrez ID | Symbol | Replicates | Species | Organ | Tissue | Adj P-value | Log2FC | Malignancy |
| 1452 | CSNK1A1 | GSM4909286 | Human | Breast | IDC | 3.97e-14 | -5.53e-01 | 0.1081 |
| 1452 | CSNK1A1 | GSM4909288 | Human | Breast | IDC | 6.30e-04 | -2.45e-01 | 0.0988 |
| 1452 | CSNK1A1 | GSM4909293 | Human | Breast | IDC | 7.40e-12 | 4.31e-01 | 0.1581 |
| 1452 | CSNK1A1 | GSM4909294 | Human | Breast | IDC | 9.44e-05 | -1.24e-01 | 0.2022 |
| 1452 | CSNK1A1 | GSM4909296 | Human | Breast | IDC | 1.12e-13 | -3.17e-01 | 0.1524 |
| 1452 | CSNK1A1 | GSM4909297 | Human | Breast | IDC | 1.95e-26 | -3.80e-02 | 0.1517 |
| 1452 | CSNK1A1 | GSM4909298 | Human | Breast | IDC | 3.44e-05 | 3.03e-01 | 0.1551 |
| 1452 | CSNK1A1 | GSM4909303 | Human | Breast | IDC | 3.45e-03 | 3.43e-01 | 0.0438 |
| 1452 | CSNK1A1 | GSM4909309 | Human | Breast | IDC | 6.50e-04 | -2.01e-01 | 0.0483 |
| 1452 | CSNK1A1 | GSM4909311 | Human | Breast | IDC | 3.83e-47 | -6.05e-01 | 0.1534 |
| 1452 | CSNK1A1 | GSM4909312 | Human | Breast | IDC | 1.44e-14 | -5.05e-02 | 0.1552 |
| 1452 | CSNK1A1 | GSM4909313 | Human | Breast | IDC | 3.84e-04 | 1.42e-01 | 0.0391 |
| 1452 | CSNK1A1 | GSM4909316 | Human | Breast | IDC | 1.18e-04 | -2.00e-01 | 0.21 |
| 1452 | CSNK1A1 | GSM4909319 | Human | Breast | IDC | 4.20e-54 | -5.98e-01 | 0.1563 |
| 1452 | CSNK1A1 | GSM4909320 | Human | Breast | IDC | 1.55e-09 | -4.96e-01 | 0.1575 |
| 1452 | CSNK1A1 | GSM4909321 | Human | Breast | IDC | 2.13e-22 | -2.64e-01 | 0.1559 |
| 1452 | CSNK1A1 | brca10 | Human | Breast | Precancer | 1.39e-06 | -3.91e-01 | -0.0029 |
| 1452 | CSNK1A1 | NCCBC11 | Human | Breast | DCIS | 5.24e-05 | 1.65e-01 | 0.1232 |
| 1452 | CSNK1A1 | NCCBC14 | Human | Breast | DCIS | 2.82e-19 | -1.22e-01 | 0.2021 |
| 1452 | CSNK1A1 | NCCBC2 | Human | Breast | DCIS | 1.38e-03 | -1.89e-03 | 0.1554 |
| Page: 1 2 3 4 5 6 7 8 9 10 11 12 13 14 15 16 17 |
| Tissue | Expression Dynamics | Abbreviation |
| Breast |  | IDC: Invasive ductal carcinoma |
| DCIS: Ductal carcinoma in situ | ||
| Precancer(BRCA1-mut): Precancerous lesion from BRCA1 mutation carriers | ||
| Colorectum (GSE201348) | 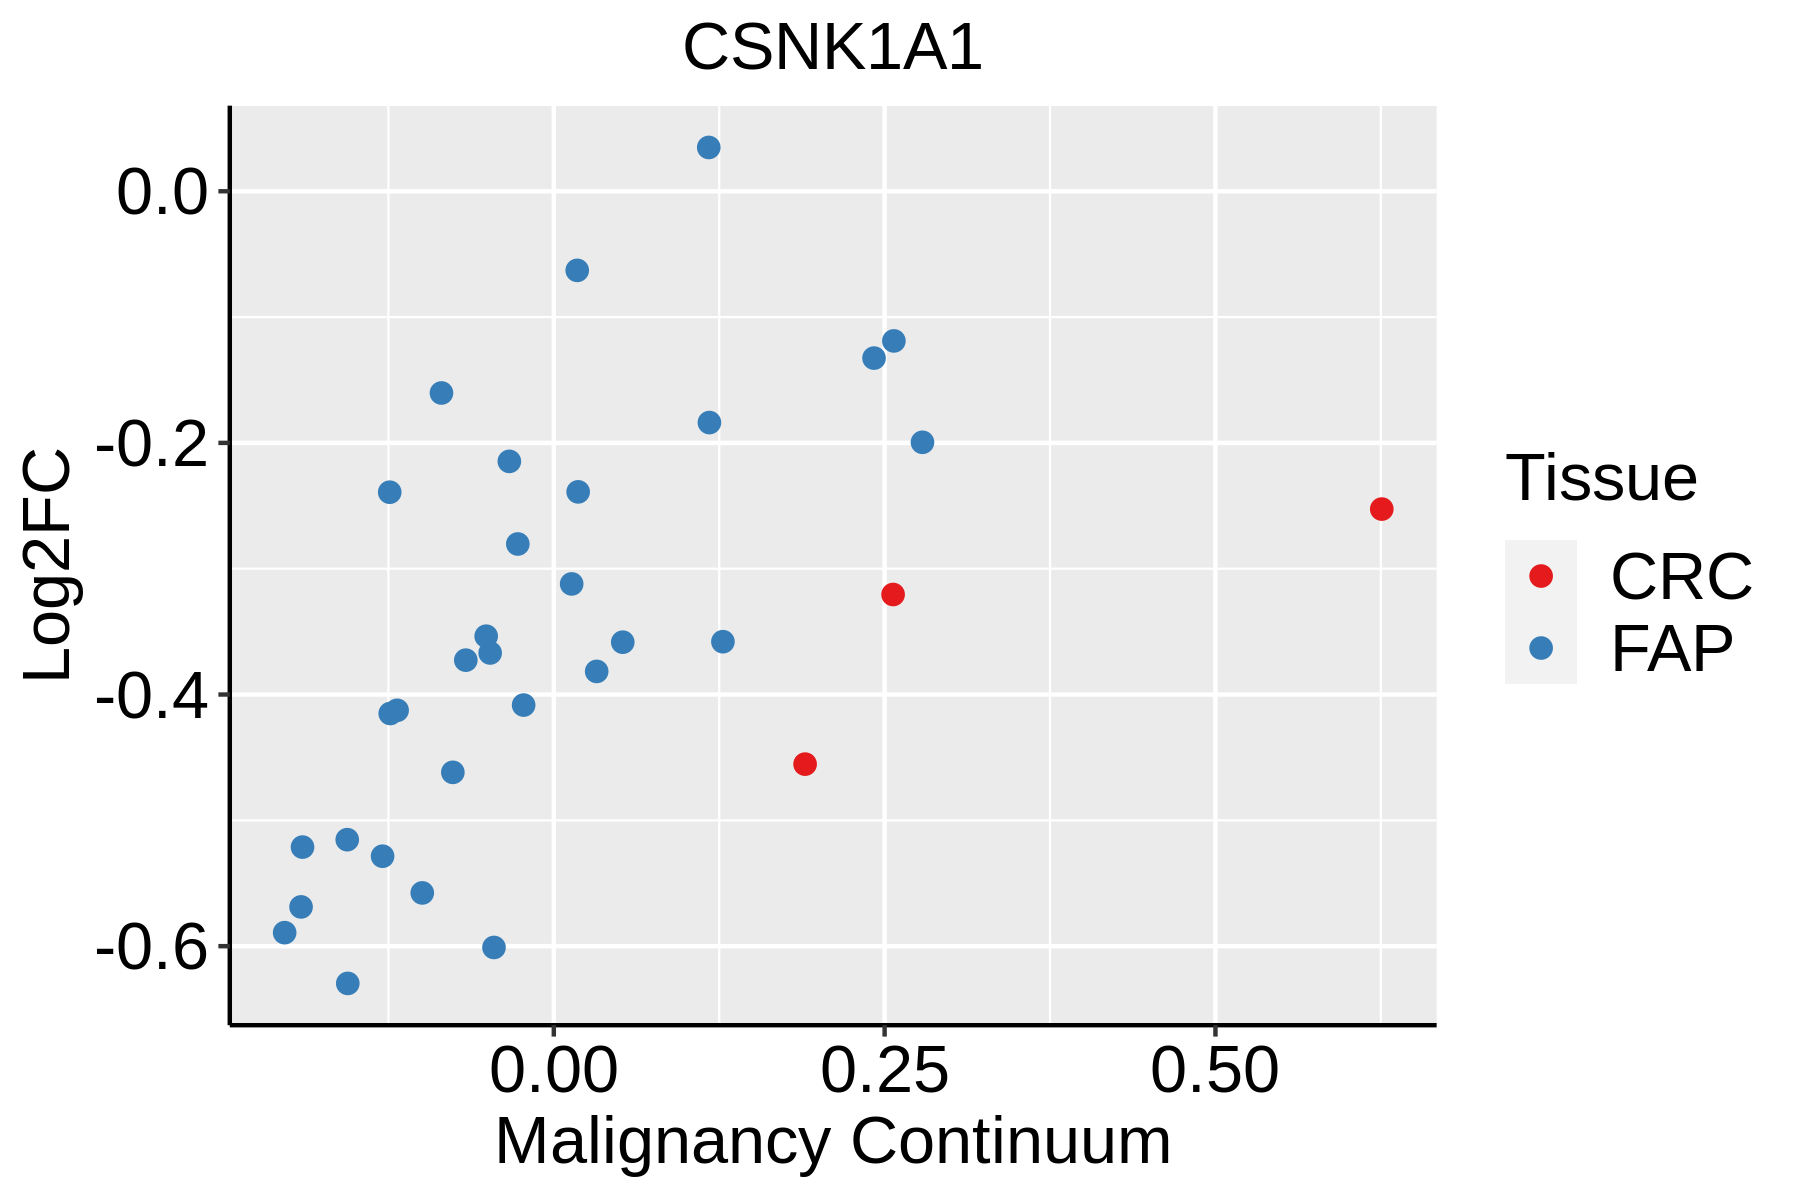 | FAP: Familial adenomatous polyposis |
| CRC: Colorectal cancer | ||
| Colorectum (HTA11) |  | AD: Adenomas |
| SER: Sessile serrated lesions | ||
| MSI-H: Microsatellite-high colorectal cancer | ||
| MSS: Microsatellite stable colorectal cancer | ||
| Endometrium | 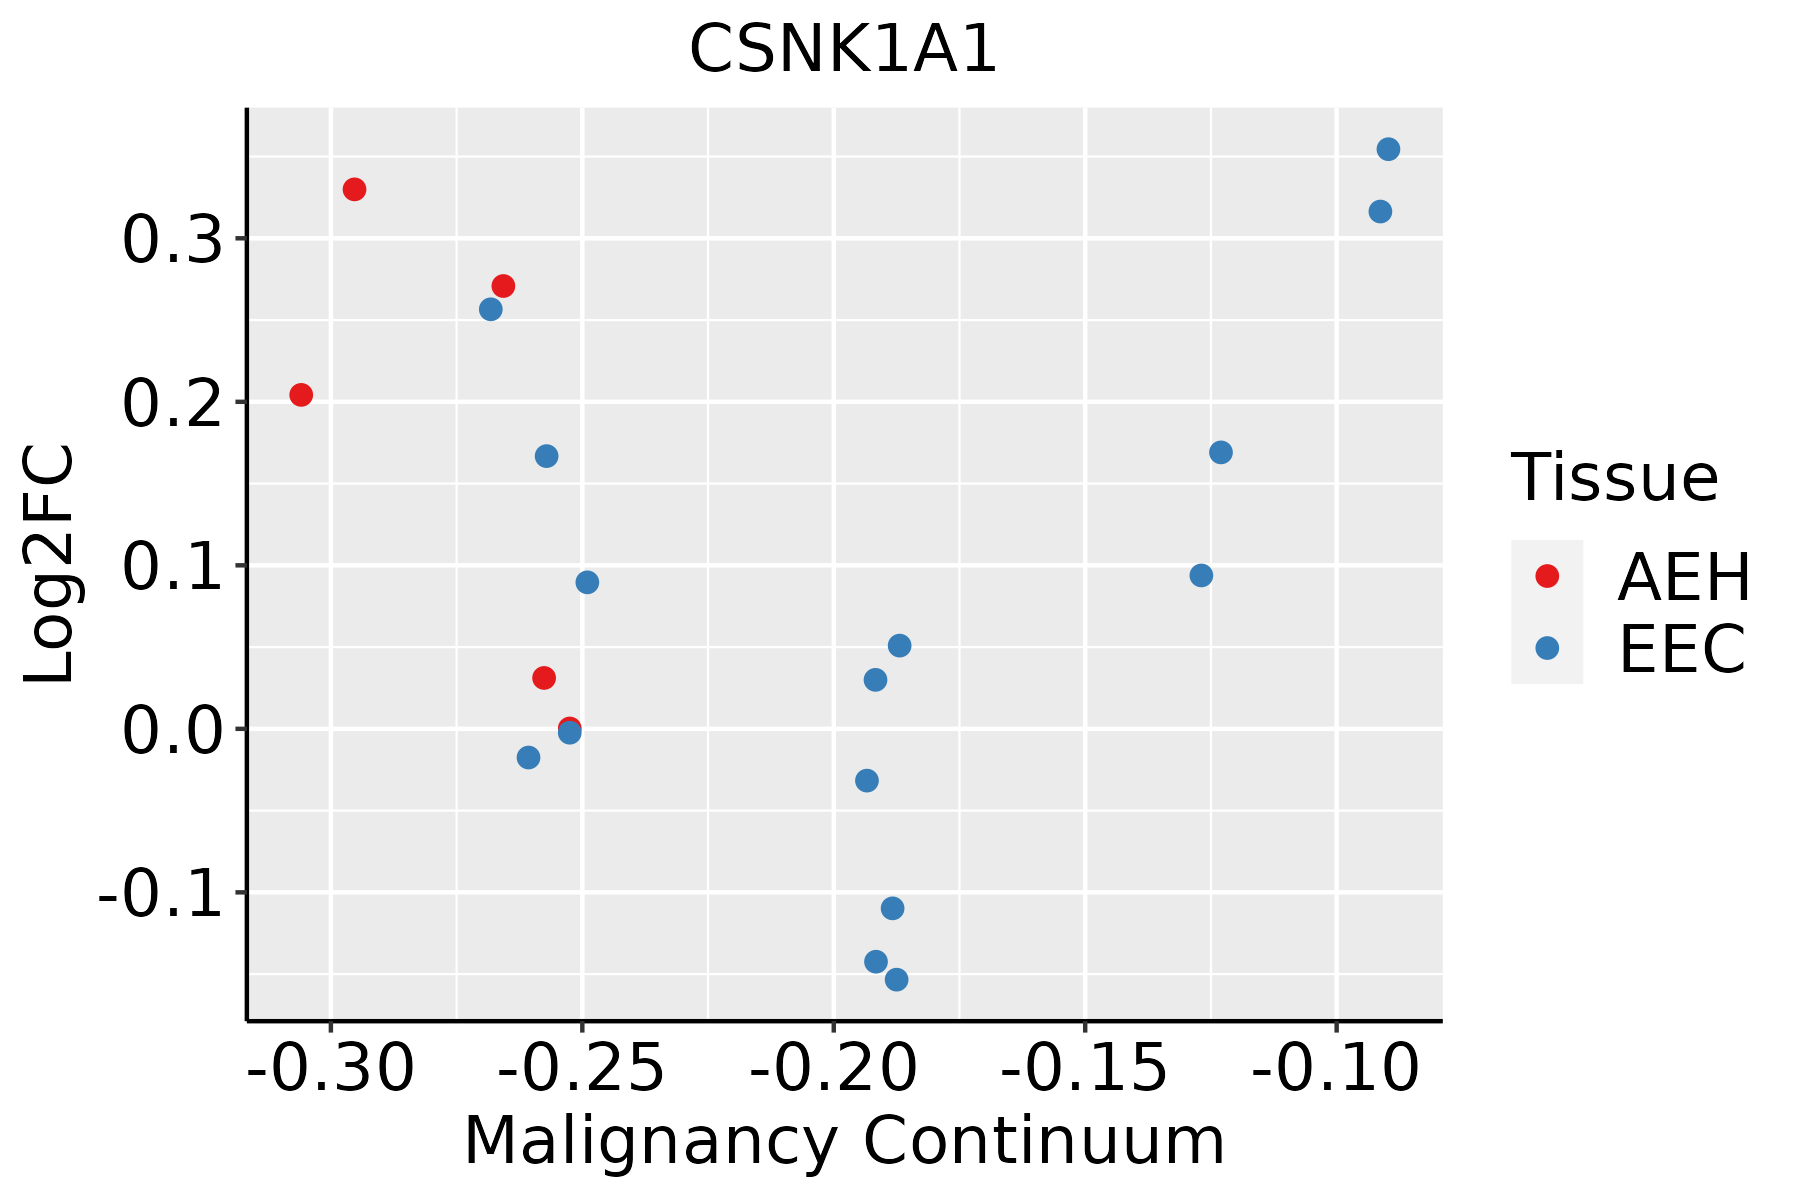 | AEH: Atypical endometrial hyperplasia |
| EEC: Endometrioid Cancer | ||
| Esophagus | 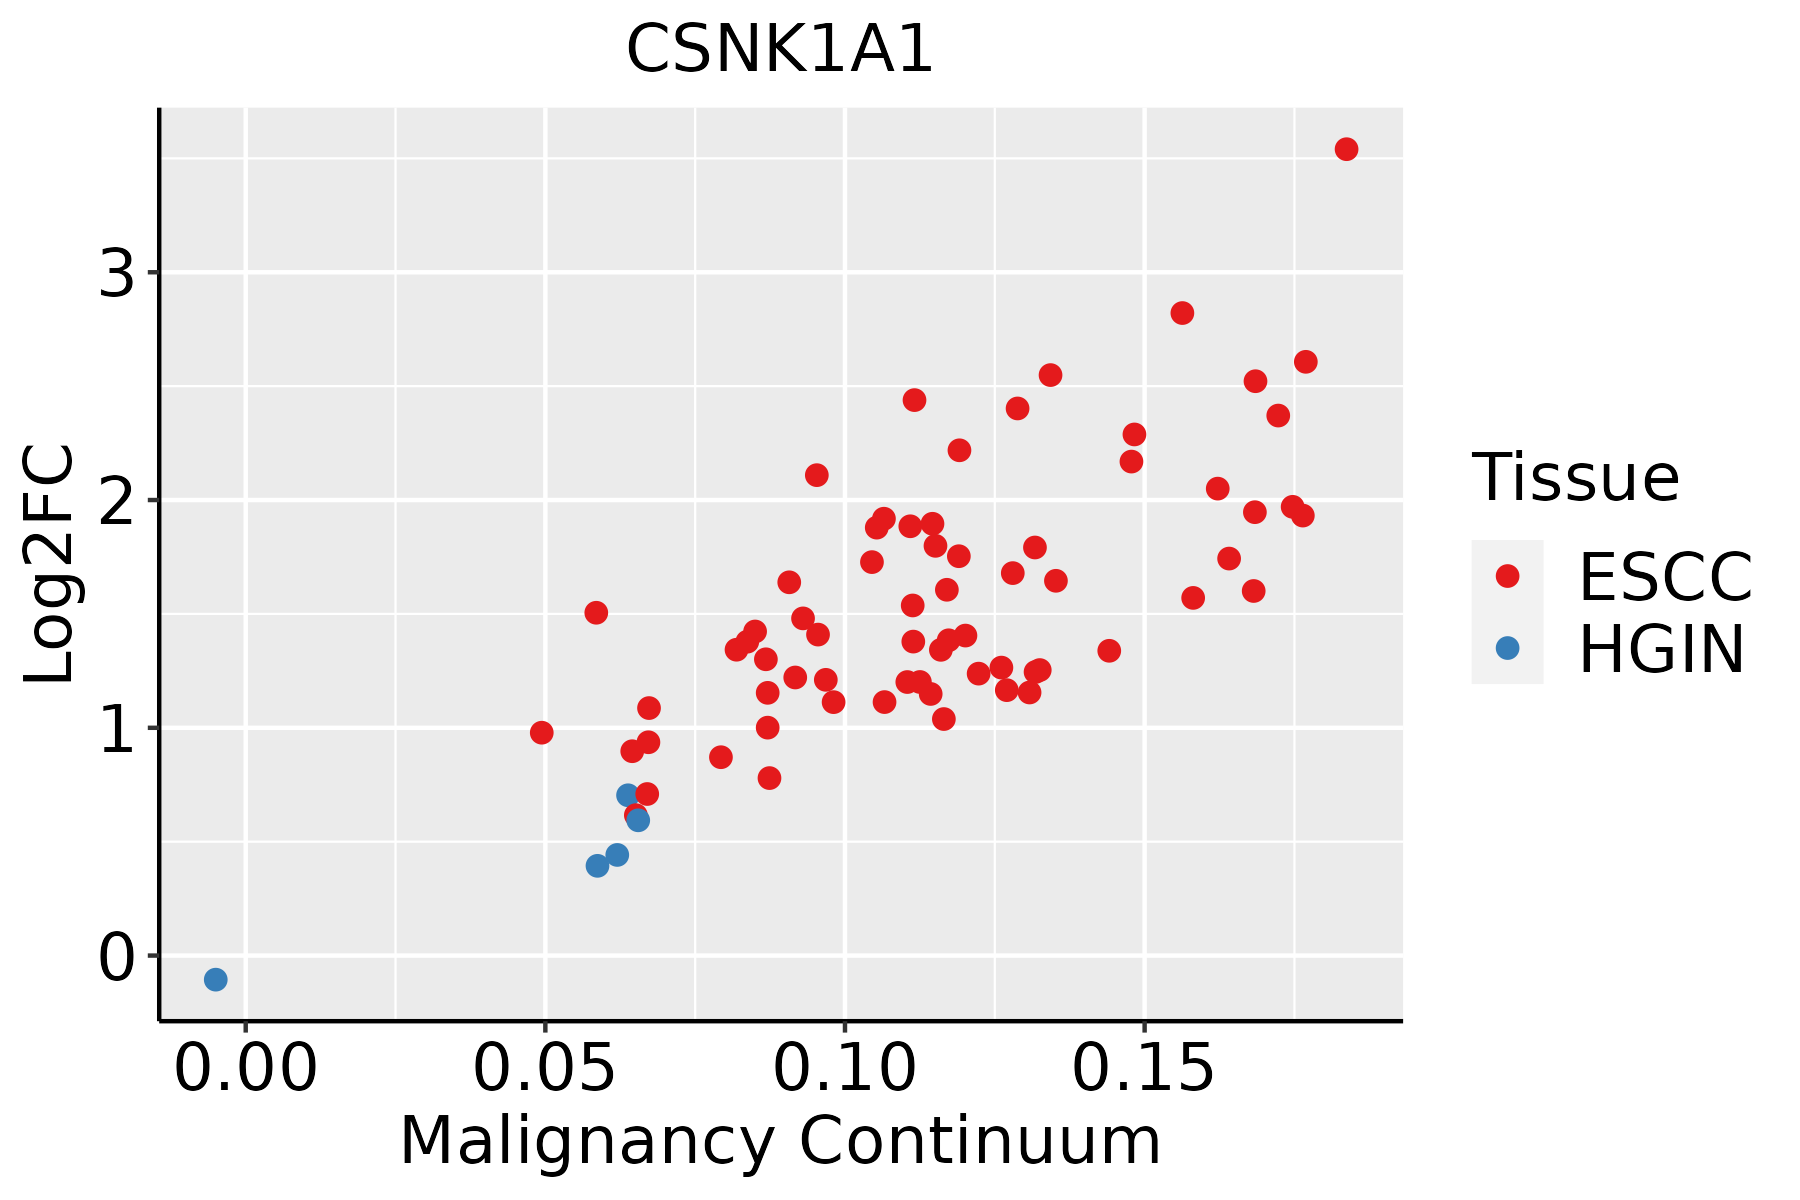 | ESCC: Esophageal squamous cell carcinoma |
| HGIN: High-grade intraepithelial neoplasias | ||
| LGIN: Low-grade intraepithelial neoplasias | ||
| GC | 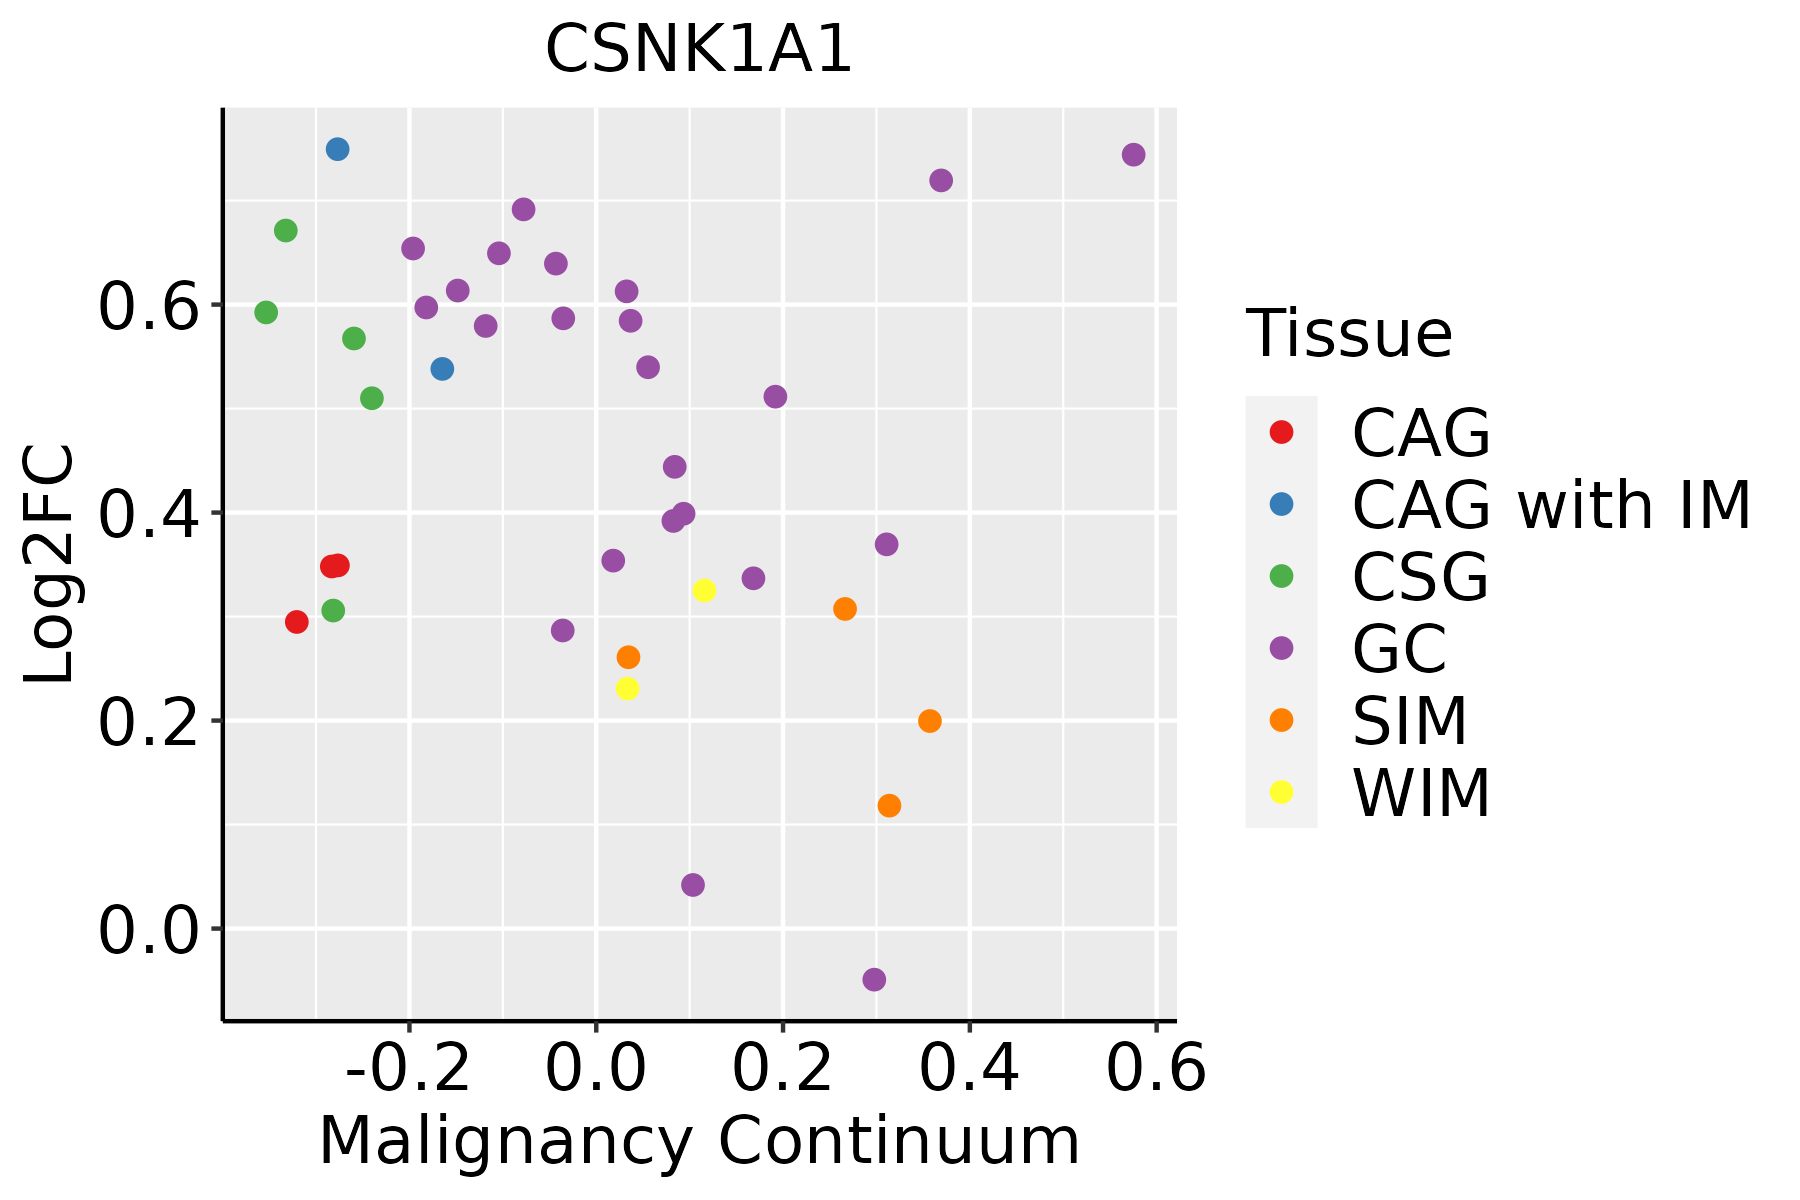 | CAG: Chronic atrophic gastritis |
| CAG with IM: Chronic atrophic gastritis with intestinal metaplasia | ||
| CSG: Chronic superficial gastritis | ||
| GC: Gastric cancer | ||
| SIM: Severe intestinal metaplasia | ||
| WIM: Wild intestinal metaplasia | ||
| Liver |  | HCC: Hepatocellular carcinoma |
| NAFLD: Non-alcoholic fatty liver disease | ||
| Lung | 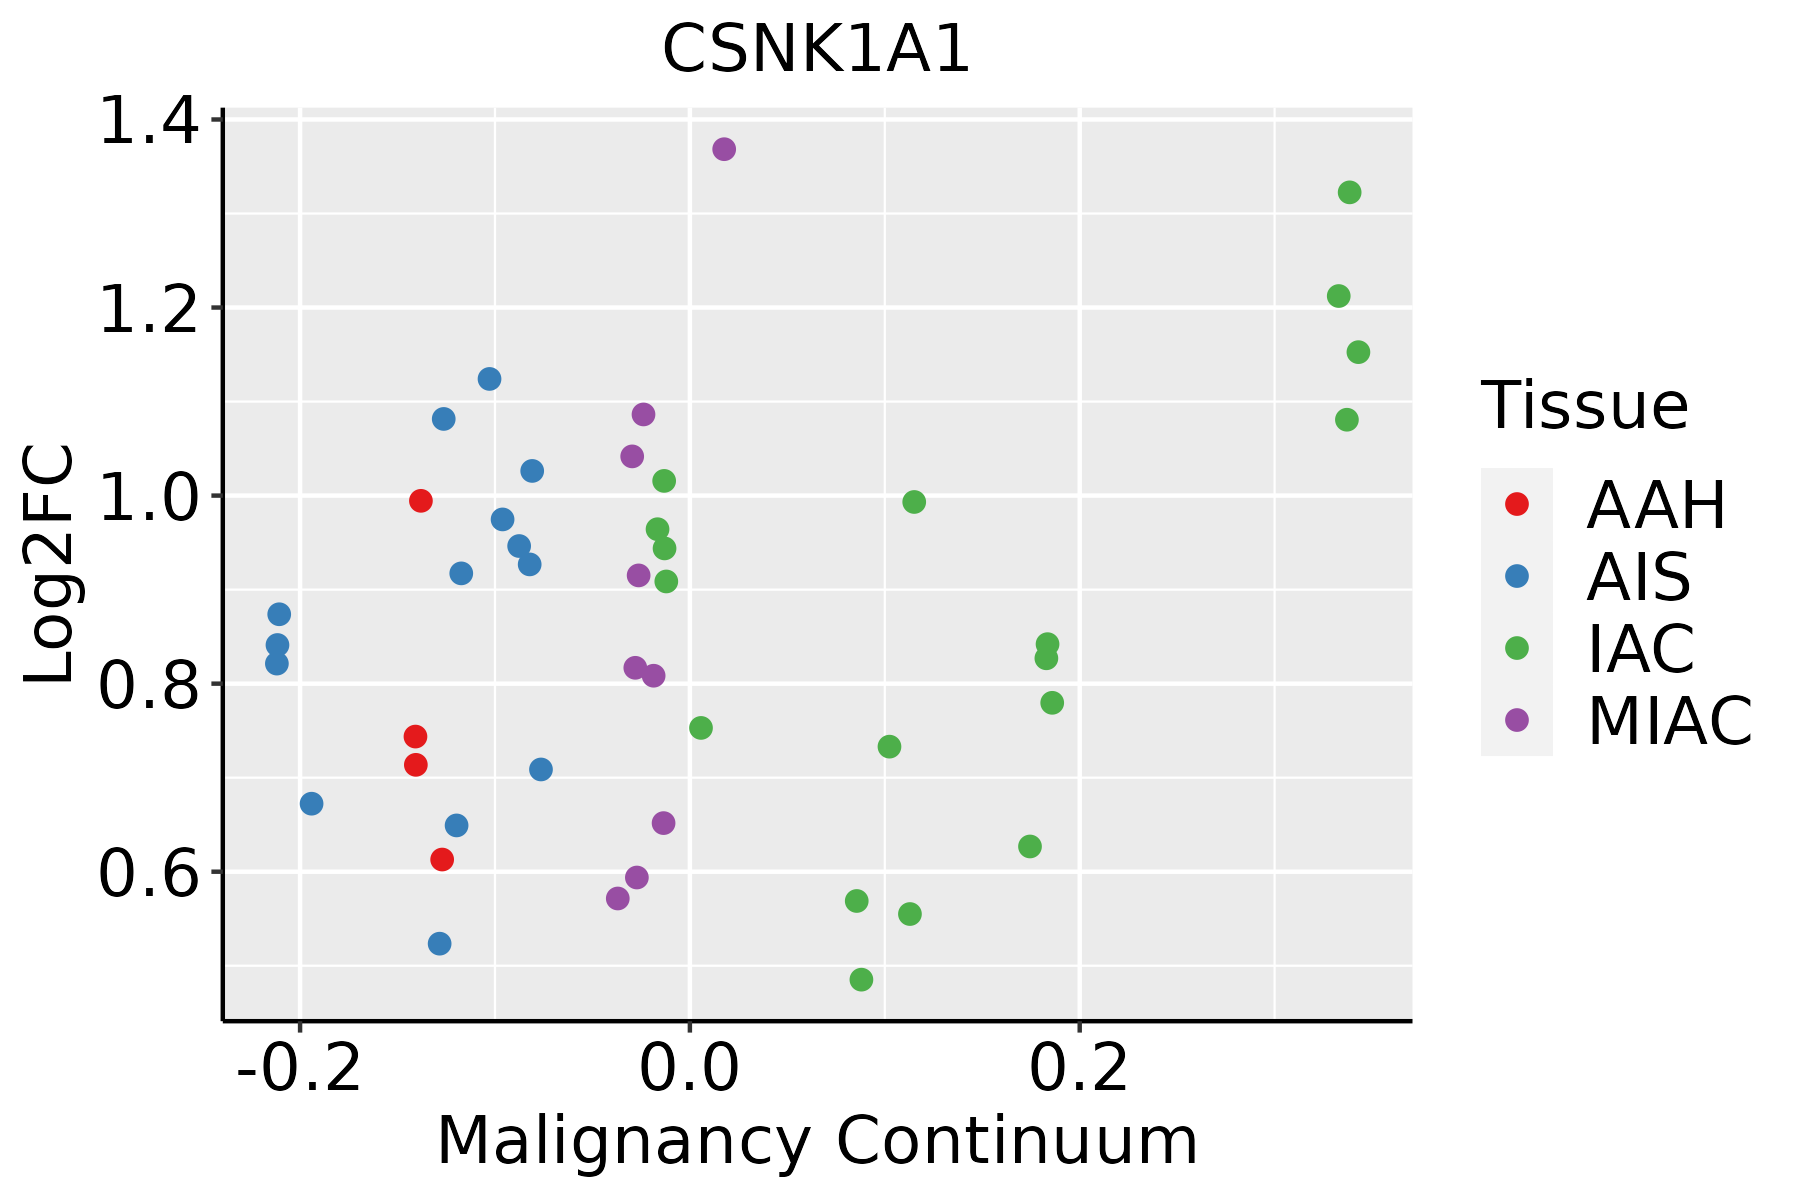 | AAH: Atypical adenomatous hyperplasia |
| AIS: Adenocarcinoma in situ | ||
| IAC: Invasive lung adenocarcinoma | ||
| MIA: Minimally invasive adenocarcinoma | ||
| Oral Cavity | 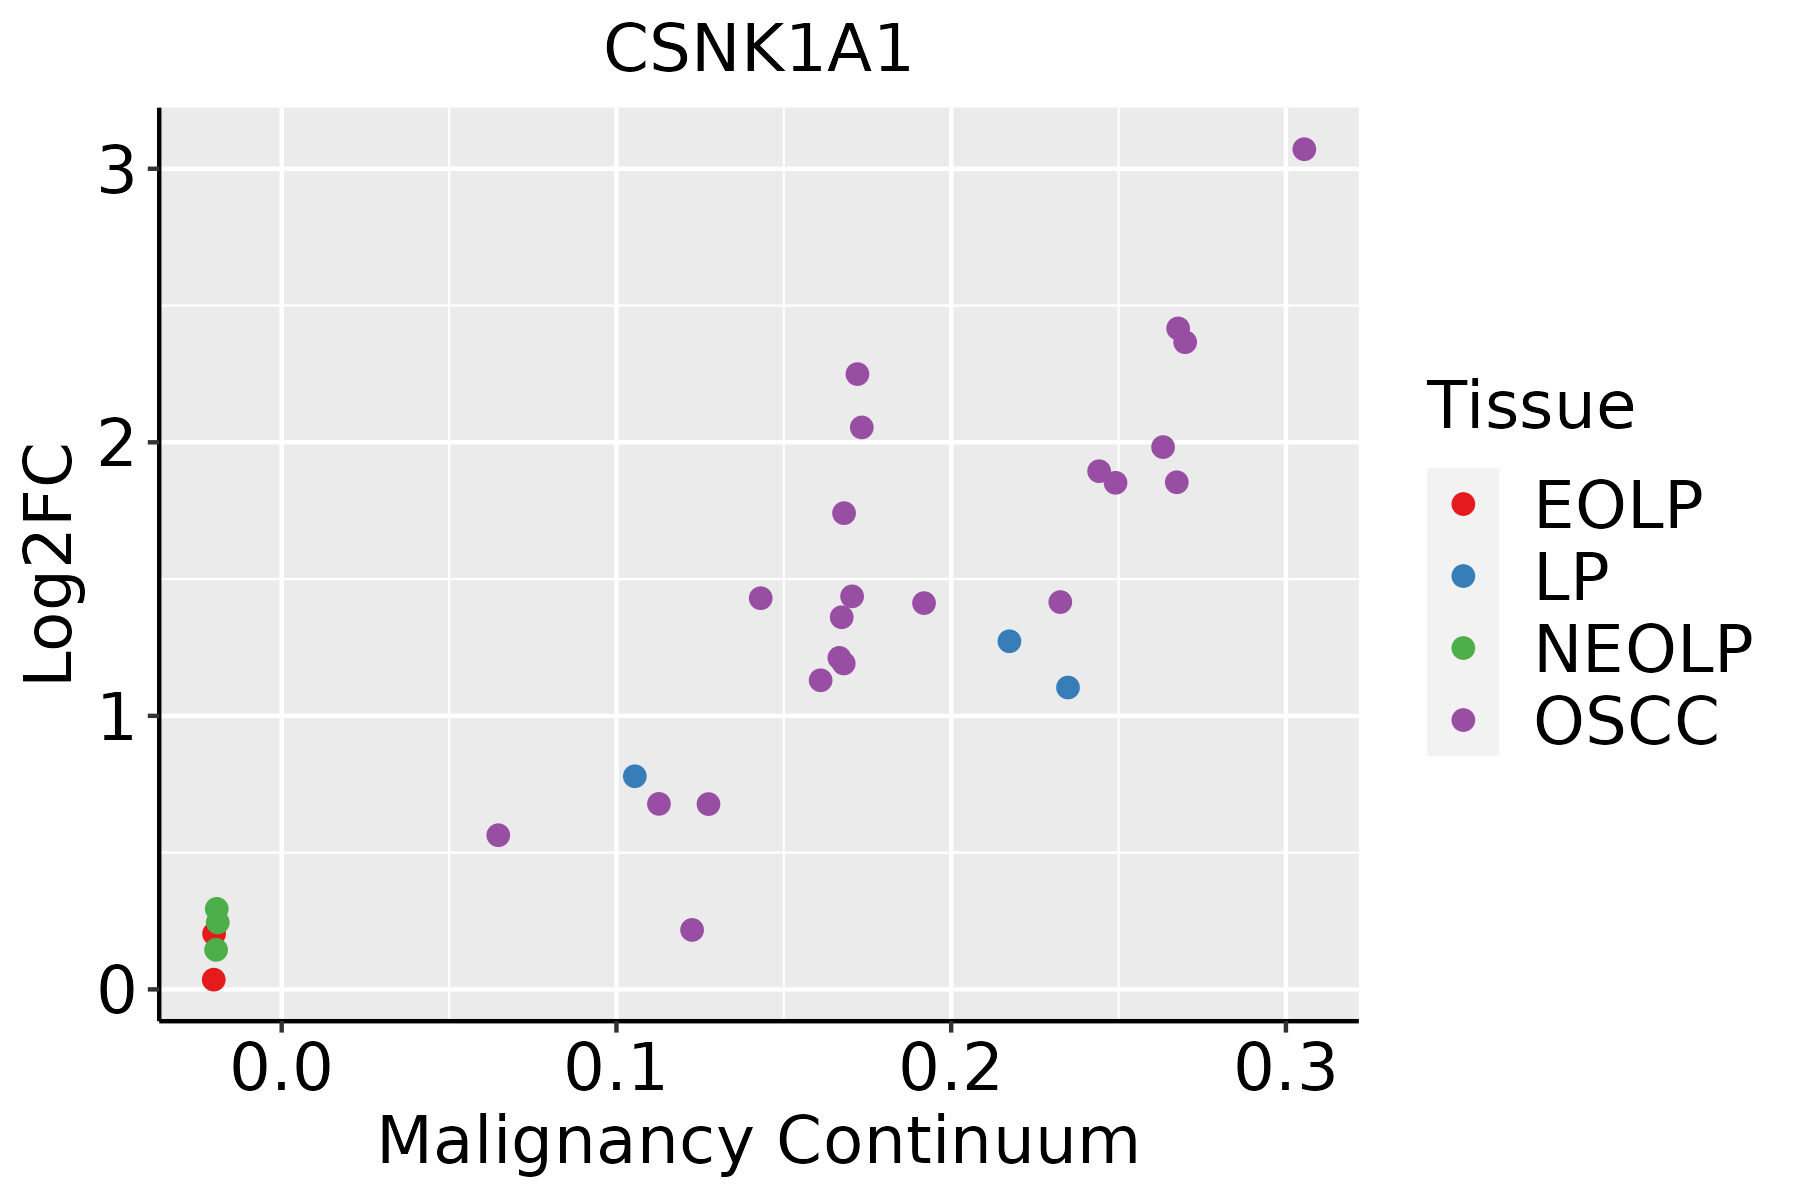 | EOLP: Erosive Oral lichen planus |
| LP: leukoplakia | ||
| NEOLP: Non-erosive oral lichen planus | ||
| OSCC: Oral squamous cell carcinoma | ||
| Prostate | 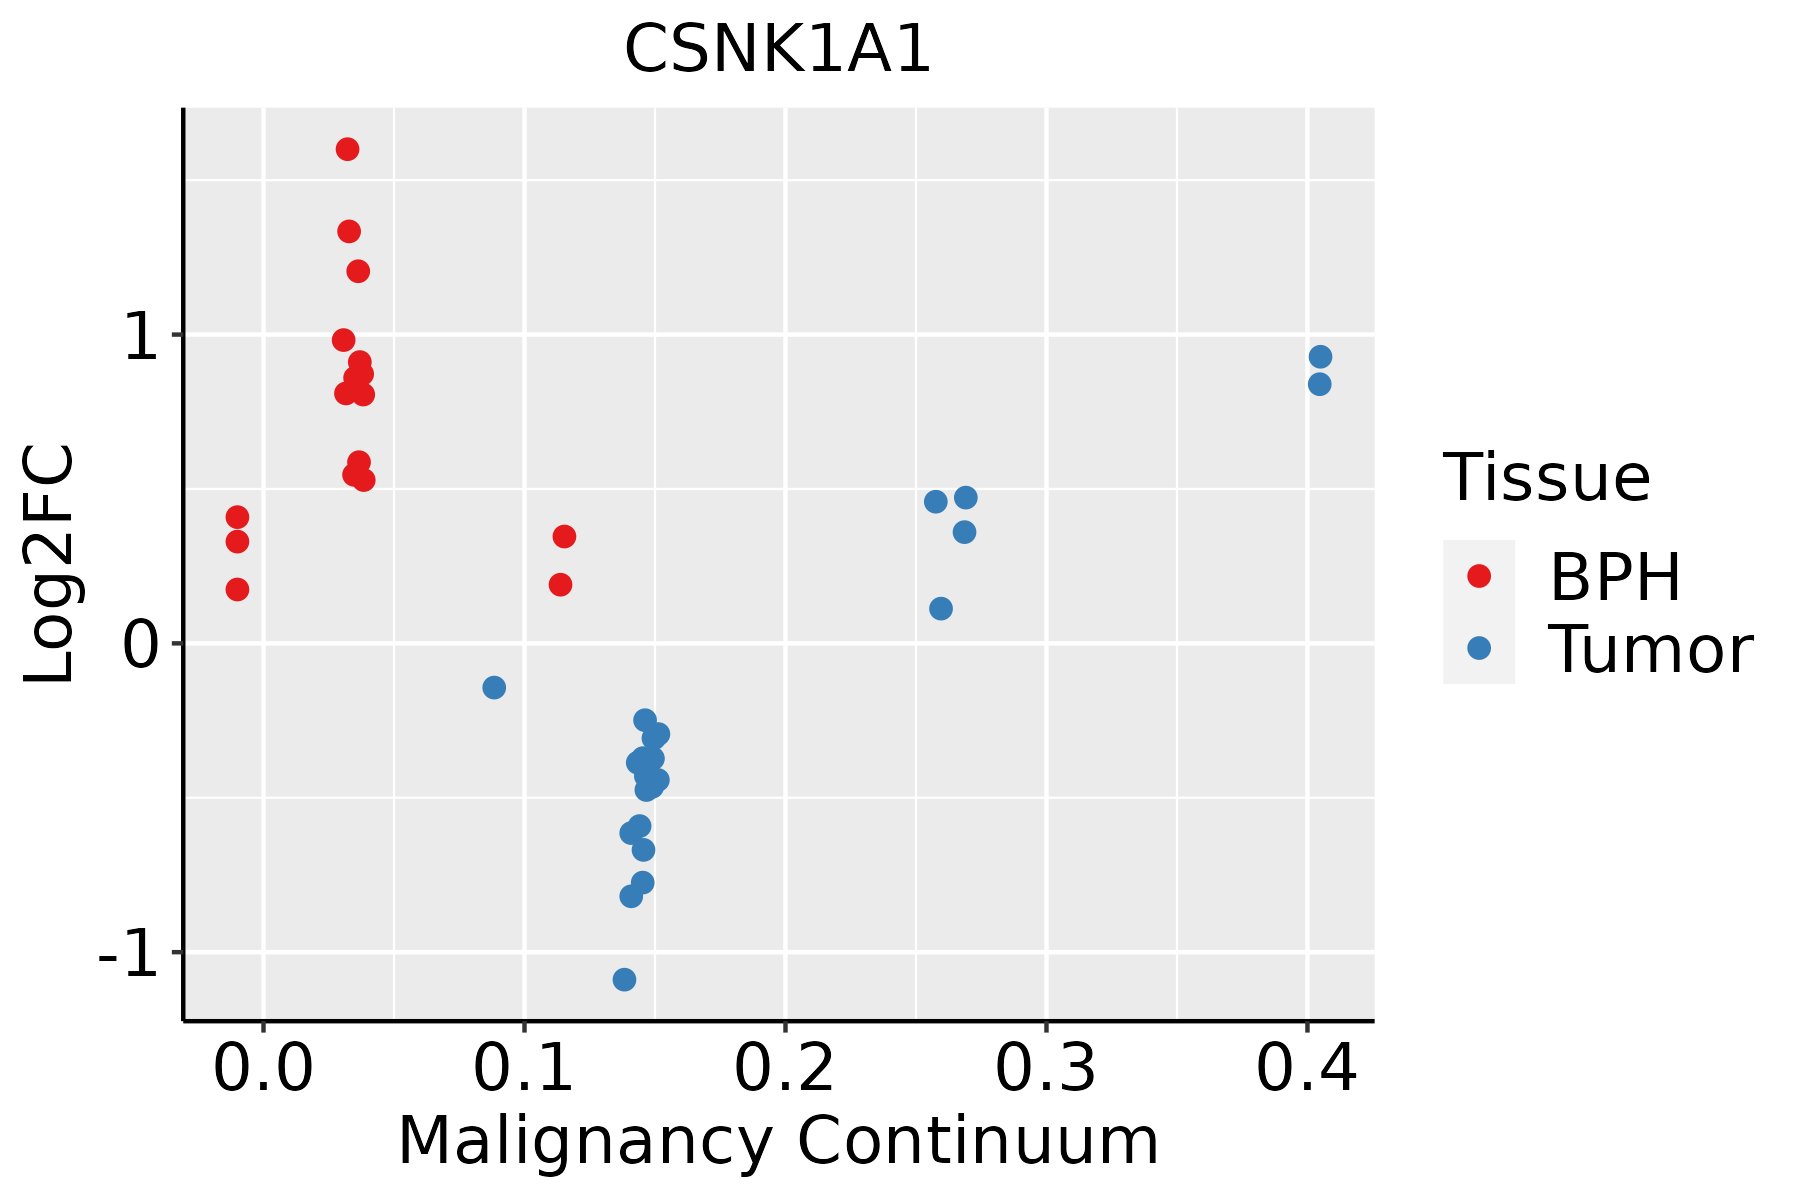 | BPH: Benign Prostatic Hyperplasia |
| Skin | 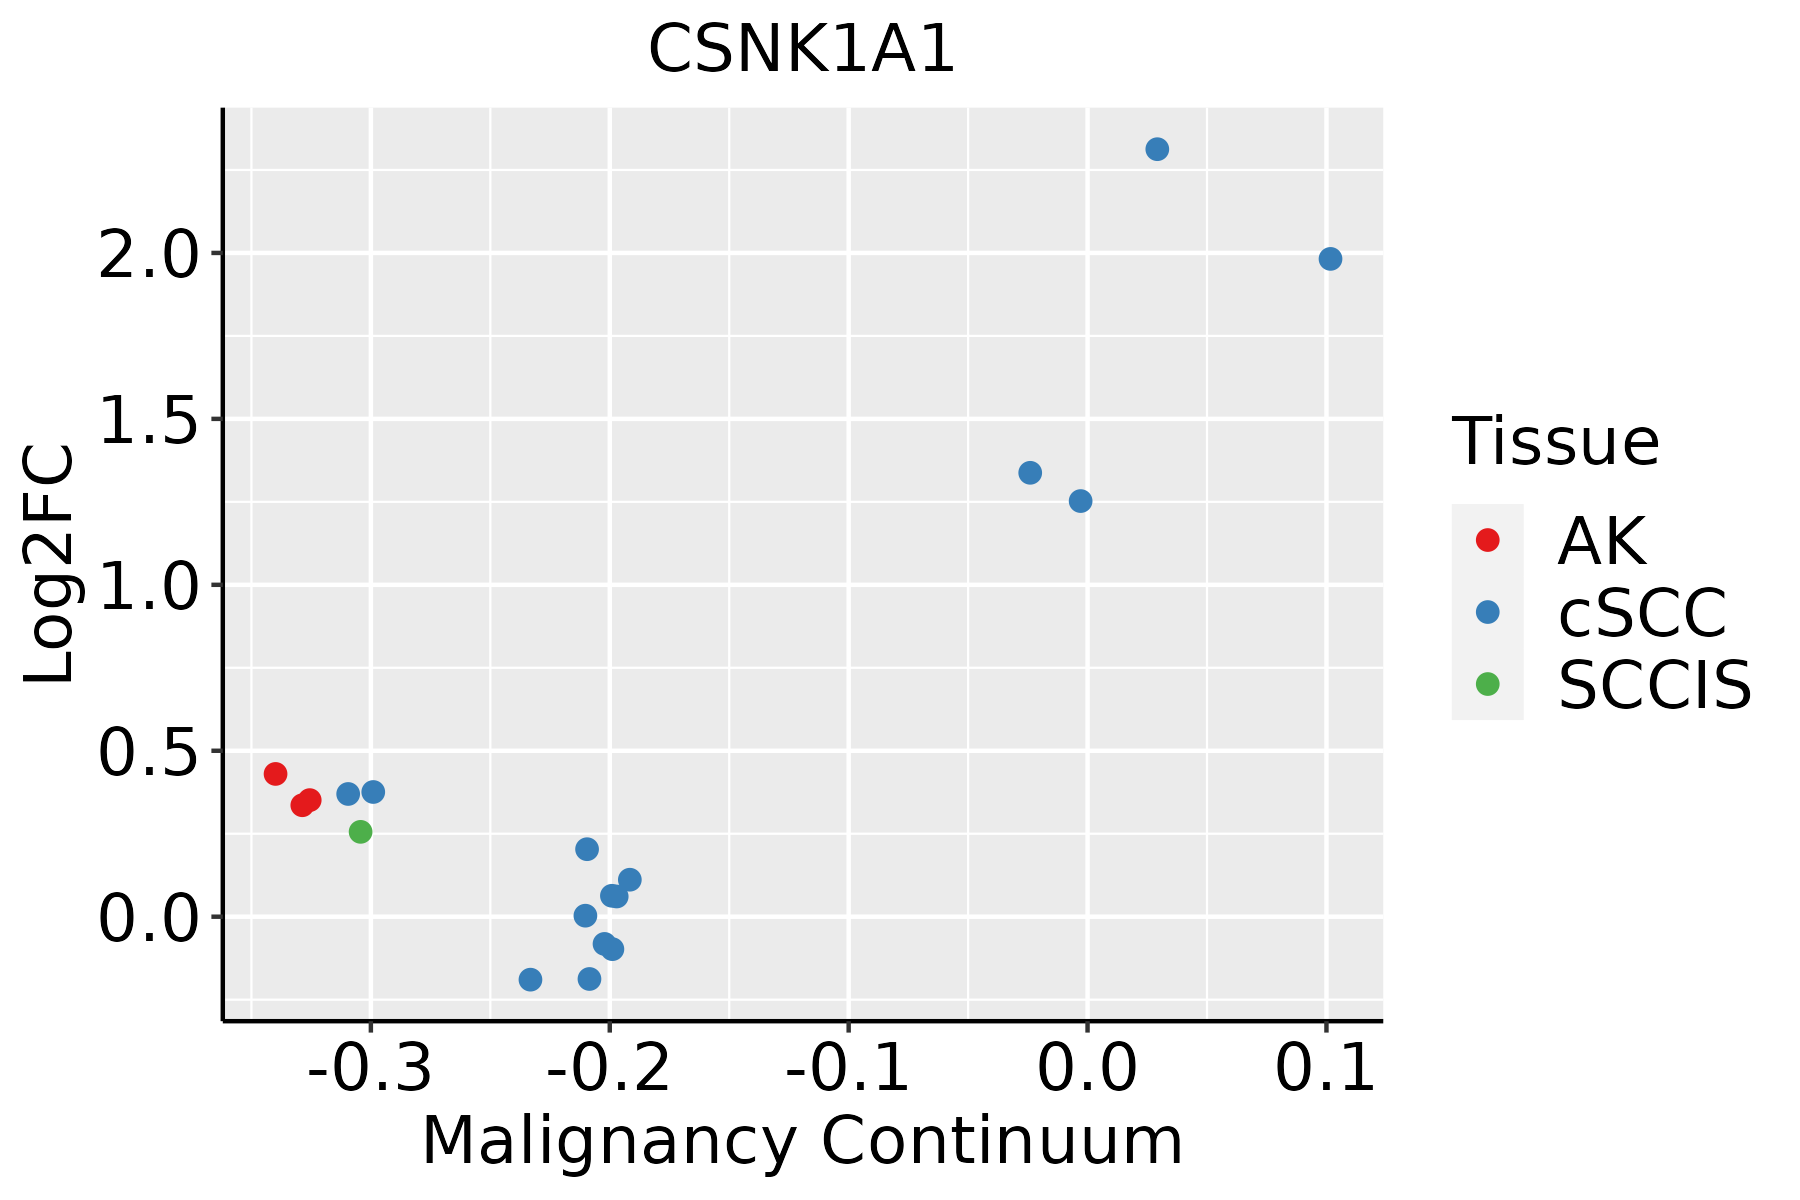 | AK: Actinic keratosis |
| cSCC: Cutaneous squamous cell carcinoma | ||
| SCCIS:squamous cell carcinoma in situ | ||
| Thyroid | 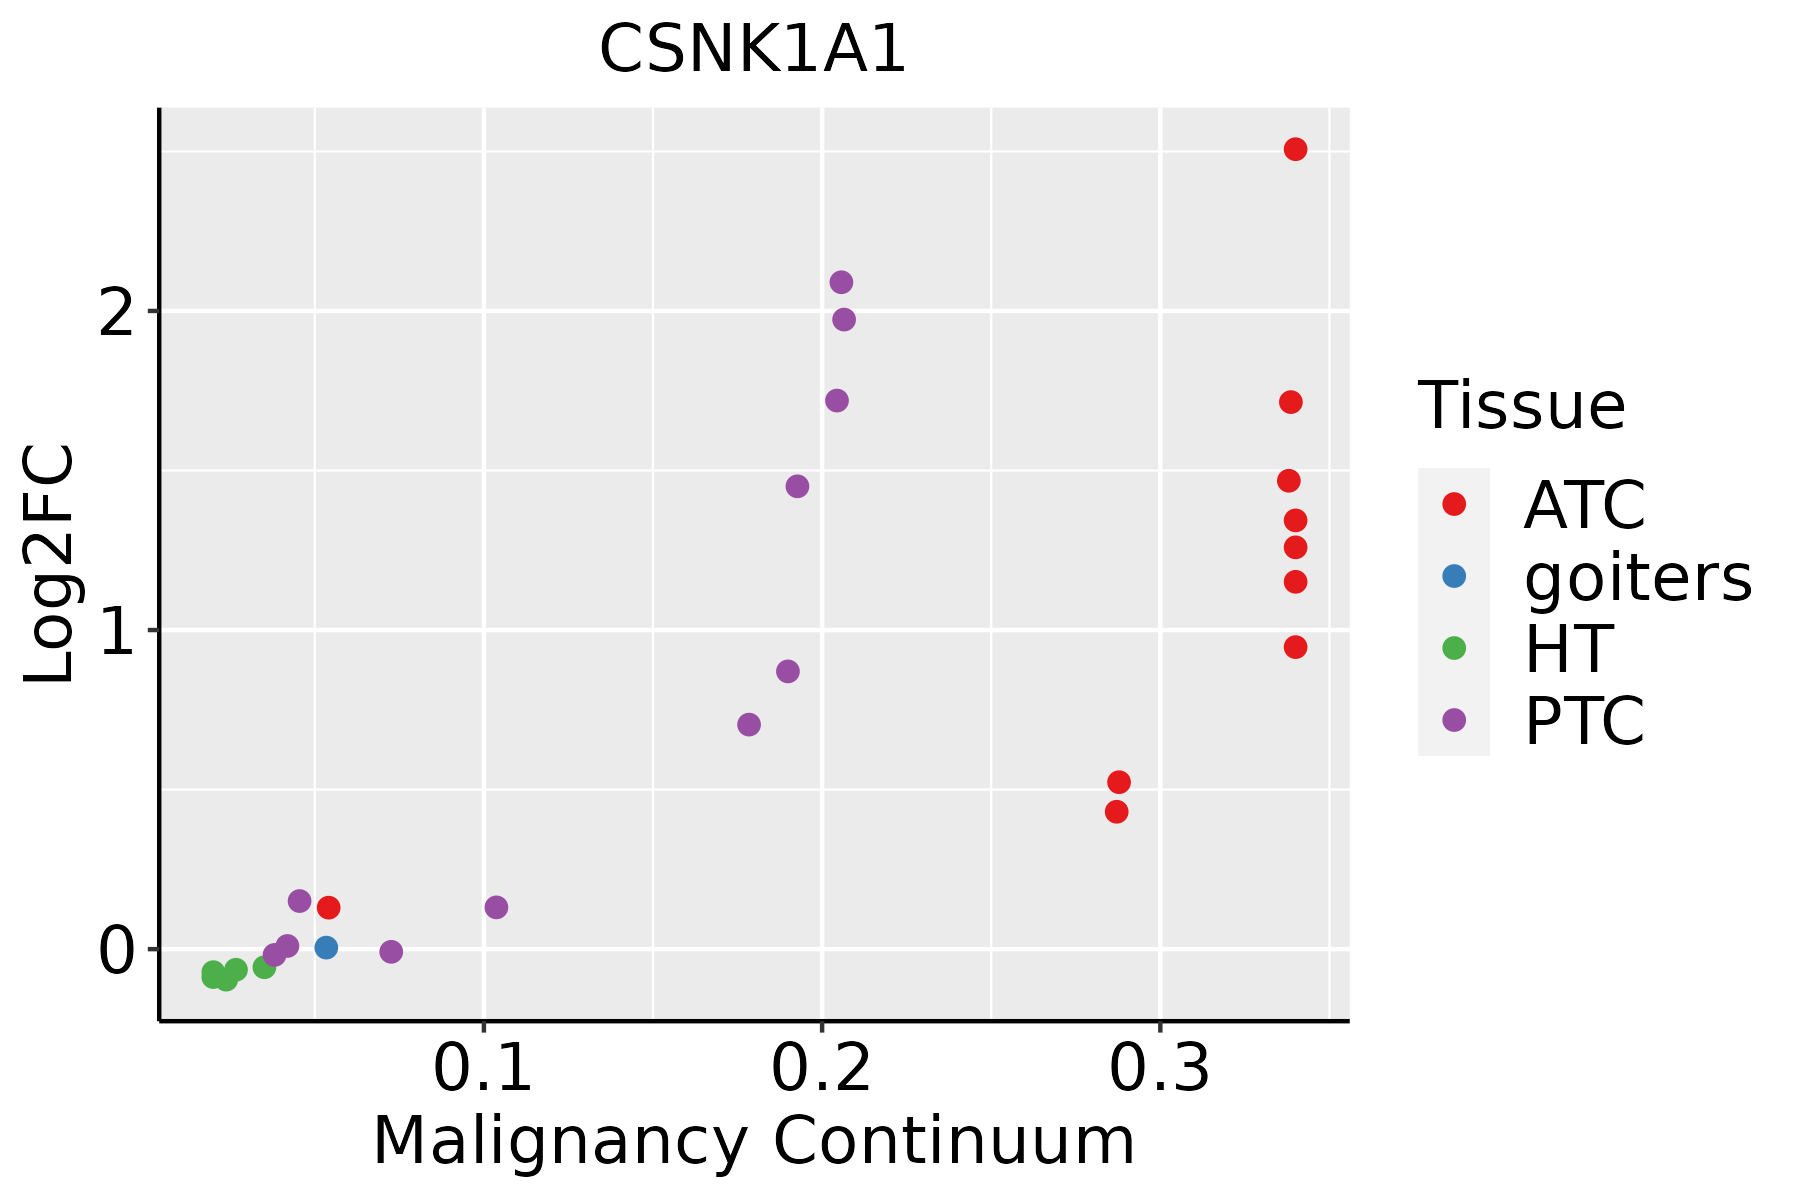 | ATC: Anaplastic thyroid cancer |
| HT: Hashimoto's thyroiditis | ||
| PTC: Papillary thyroid cancer |
| ∗log2FC in expression of this searched gene in stem-like cells from each diseased tissue sample relative to stem-like cells in normal samples in each tissue plotted against the malignancy continuum. Samples are colored based on if they are from different disease stage. |
Top |
Malignant transformation related pathway analysis |
| Find out the enriched GO biological processes and KEGG pathways involved in transition from healthy to precancer to cancer |
| Tissue | Disease Stage | Enriched GO biological Processes |
| Colorectum | AD |  |
| Colorectum | SER |  |
| Colorectum | MSS |  |
| Colorectum | MSI-H |  |
| Colorectum | FAP |  |
| ∗Top 15 enriched GO BP terms are showed in the bar plot of each disease state in each tissue. Each row represents a significant GO biological process which is colored according to the -log10(p.adjust). |
| Page: 1 2 3 4 5 6 7 8 9 |
| GO ID | Tissue | Disease Stage | Description | Gene Ratio | Bg Ratio | pvalue | p.adjust | Count |
| GO:00324348 | Lung | IAC | regulation of proteasomal ubiquitin-dependent protein catabolic process | 31/2061 | 134/18723 | 4.44e-05 | 1.05e-03 | 31 |
| GO:19018006 | Lung | IAC | positive regulation of proteasomal protein catabolic process | 27/2061 | 114/18723 | 8.78e-05 | 1.77e-03 | 27 |
| GO:00070303 | Lung | IAC | Golgi organization | 32/2061 | 157/18723 | 4.13e-04 | 6.22e-03 | 32 |
| GO:00301783 | Lung | IAC | negative regulation of Wnt signaling pathway | 32/2061 | 170/18723 | 1.68e-03 | 1.76e-02 | 32 |
| GO:004217613 | Lung | AIS | regulation of protein catabolic process | 92/1849 | 391/18723 | 1.34e-15 | 3.91e-12 | 92 |
| GO:000989613 | Lung | AIS | positive regulation of catabolic process | 103/1849 | 492/18723 | 9.59e-14 | 1.86e-10 | 103 |
| GO:004573213 | Lung | AIS | positive regulation of protein catabolic process | 60/1849 | 231/18723 | 1.47e-12 | 2.14e-09 | 60 |
| GO:003133113 | Lung | AIS | positive regulation of cellular catabolic process | 89/1849 | 427/18723 | 6.12e-12 | 4.46e-09 | 89 |
| GO:001605512 | Lung | AIS | Wnt signaling pathway | 91/1849 | 444/18723 | 9.38e-12 | 5.47e-09 | 91 |
| GO:019873812 | Lung | AIS | cell-cell signaling by wnt | 91/1849 | 446/18723 | 1.22e-11 | 6.13e-09 | 91 |
| GO:190336213 | Lung | AIS | regulation of cellular protein catabolic process | 62/1849 | 255/18723 | 1.37e-11 | 6.13e-09 | 62 |
| GO:003011112 | Lung | AIS | regulation of Wnt signaling pathway | 70/1849 | 328/18723 | 3.81e-10 | 8.87e-08 | 70 |
| GO:200005813 | Lung | AIS | regulation of ubiquitin-dependent protein catabolic process | 43/1849 | 164/18723 | 1.55e-09 | 2.91e-07 | 43 |
| GO:190336413 | Lung | AIS | positive regulation of cellular protein catabolic process | 41/1849 | 155/18723 | 2.79e-09 | 4.92e-07 | 41 |
| GO:190305013 | Lung | AIS | regulation of proteolysis involved in cellular protein catabolic process | 51/1849 | 221/18723 | 5.97e-09 | 9.87e-07 | 51 |
| GO:004586213 | Lung | AIS | positive regulation of proteolysis | 73/1849 | 372/18723 | 7.68e-09 | 1.21e-06 | 73 |
| GO:200006013 | Lung | AIS | positive regulation of ubiquitin-dependent protein catabolic process | 31/1849 | 107/18723 | 2.36e-08 | 3.12e-06 | 31 |
| GO:004316113 | Lung | AIS | proteasome-mediated ubiquitin-dependent protein catabolic process | 77/1849 | 412/18723 | 2.74e-08 | 3.47e-06 | 77 |
| GO:001049813 | Lung | AIS | proteasomal protein catabolic process | 87/1849 | 490/18723 | 4.15e-08 | 5.03e-06 | 87 |
| GO:006082812 | Lung | AIS | regulation of canonical Wnt signaling pathway | 52/1849 | 253/18723 | 2.40e-07 | 2.22e-05 | 52 |
| Page: 1 2 3 4 5 6 7 8 9 10 11 12 13 14 15 16 17 18 19 20 21 22 23 24 25 26 27 28 29 30 31 32 33 34 35 36 37 38 39 40 41 |
| Pathway ID | Tissue | Disease Stage | Description | Gene Ratio | Bg Ratio | pvalue | p.adjust | qvalue | Count |
| hsa0501016 | Breast | Precancer | Alzheimer disease | 103/684 | 384/8465 | 1.03e-29 | 4.66e-28 | 3.57e-28 | 103 |
| hsa0501017 | Breast | Precancer | Alzheimer disease | 103/684 | 384/8465 | 1.03e-29 | 4.66e-28 | 3.57e-28 | 103 |
| hsa0501023 | Breast | IDC | Alzheimer disease | 107/867 | 384/8465 | 1.70e-23 | 7.88e-22 | 5.90e-22 | 107 |
| hsa0502223 | Breast | IDC | Pathways of neurodegeneration - multiple diseases | 116/867 | 476/8465 | 3.63e-20 | 1.18e-18 | 8.82e-19 | 116 |
| hsa0501033 | Breast | IDC | Alzheimer disease | 107/867 | 384/8465 | 1.70e-23 | 7.88e-22 | 5.90e-22 | 107 |
| hsa0502233 | Breast | IDC | Pathways of neurodegeneration - multiple diseases | 116/867 | 476/8465 | 3.63e-20 | 1.18e-18 | 8.82e-19 | 116 |
| hsa0501043 | Breast | DCIS | Alzheimer disease | 105/846 | 384/8465 | 3.23e-23 | 1.49e-21 | 1.10e-21 | 105 |
| hsa0502243 | Breast | DCIS | Pathways of neurodegeneration - multiple diseases | 114/846 | 476/8465 | 4.74e-20 | 1.53e-18 | 1.13e-18 | 114 |
| hsa0501053 | Breast | DCIS | Alzheimer disease | 105/846 | 384/8465 | 3.23e-23 | 1.49e-21 | 1.10e-21 | 105 |
| hsa0502253 | Breast | DCIS | Pathways of neurodegeneration - multiple diseases | 114/846 | 476/8465 | 4.74e-20 | 1.53e-18 | 1.13e-18 | 114 |
| hsa05010 | Colorectum | AD | Alzheimer disease | 174/2092 | 384/8465 | 1.82e-19 | 9.26e-18 | 5.91e-18 | 174 |
| hsa05022 | Colorectum | AD | Pathways of neurodegeneration - multiple diseases | 201/2092 | 476/8465 | 4.54e-18 | 1.27e-16 | 8.09e-17 | 201 |
| hsa05225 | Colorectum | AD | Hepatocellular carcinoma | 59/2092 | 168/8465 | 1.50e-03 | 8.69e-03 | 5.54e-03 | 59 |
| hsa04310 | Colorectum | AD | Wnt signaling pathway | 56/2092 | 171/8465 | 1.03e-02 | 3.93e-02 | 2.51e-02 | 56 |
| hsa050101 | Colorectum | AD | Alzheimer disease | 174/2092 | 384/8465 | 1.82e-19 | 9.26e-18 | 5.91e-18 | 174 |
| hsa050221 | Colorectum | AD | Pathways of neurodegeneration - multiple diseases | 201/2092 | 476/8465 | 4.54e-18 | 1.27e-16 | 8.09e-17 | 201 |
| hsa052251 | Colorectum | AD | Hepatocellular carcinoma | 59/2092 | 168/8465 | 1.50e-03 | 8.69e-03 | 5.54e-03 | 59 |
| hsa043101 | Colorectum | AD | Wnt signaling pathway | 56/2092 | 171/8465 | 1.03e-02 | 3.93e-02 | 2.51e-02 | 56 |
| hsa050102 | Colorectum | SER | Alzheimer disease | 146/1580 | 384/8465 | 6.52e-20 | 2.40e-18 | 1.75e-18 | 146 |
| hsa050222 | Colorectum | SER | Pathways of neurodegeneration - multiple diseases | 168/1580 | 476/8465 | 6.23e-19 | 2.07e-17 | 1.50e-17 | 168 |
| Page: 1 2 3 4 5 6 7 8 9 |
Top |
Cell-cell communication analysis |
| Identification of potential cell-cell interactions between two cell types and their ligand-receptor pairs for different disease states |
| Ligand | Receptor | LRpair | Pathway | Tissue | Disease Stage |
| Page: 1 |
Top |
Single-cell gene regulatory network inference analysis |
| Find out the significant the regulons (TFs) and the target genes of each regulon across cell types for different disease states |
| TF | Cell Type | Tissue | Disease Stage | Target Gene | RSS | Regulon Activity |
| ∗The dot plots of a searched regulon are shown for all cell subpopulations in each disease state of each tissue based on the regulon specific score inferred using pySCENIC and by calculating the average expression. |
| Page: 1 |
Top |
Somatic mutation of malignant transformation related genes |
| Annotation of somatic variants for genes involved in malignant transformation |
| Hugo Symbol | Variant Class | Variant Classification | dbSNP RS | HGVSc | HGVSp | HGVSp Short | SWISSPROT | BIOTYPE | SIFT | PolyPhen | Tumor Sample Barcode | Tissue | Histology | Sex | Age | Stage | Therapy Types | Drugs | Outcome |
| CSNK1A1 | SNV | Missense_Mutation | c.178N>A | p.Glu60Lys | p.E60K | P48729 | protein_coding | deleterious_low_confidence(0.02) | probably_damaging(0.956) | TCGA-AC-A23H-01 | Breast | breast invasive carcinoma | Female | >=65 | I/II | Unknown | Unknown | PD | |
| CSNK1A1 | insertion | Nonsense_Mutation | novel | c.33_34insCTTGTTAAACACGTCCCATAAATGTCCCTTAGTCGAG | p.Ile12LeufsTer7 | p.I12Lfs*7 | P48729 | protein_coding | TCGA-A8-A06U-01 | Breast | breast invasive carcinoma | Female | >=65 | I/II | Unknown | Unknown | SD | ||
| CSNK1A1 | insertion | In_Frame_Ins | novel | c.576_577insCCA | p.Tyr192_Arg193insPro | p.Y192_R193insP | P48729 | protein_coding | TCGA-AO-A128-01 | Breast | breast invasive carcinoma | Female | <65 | I/II | Chemotherapy | doxorubicin | SD | ||
| CSNK1A1 | deletion | Frame_Shift_Del | novel | c.166delN | p.Gln56SerfsTer33 | p.Q56Sfs*33 | P48729 | protein_coding | TCGA-EW-A2FV-01 | Breast | breast invasive carcinoma | Female | <65 | III/IV | Chemotherapy | docetaxel | SD | ||
| CSNK1A1 | SNV | Missense_Mutation | c.62G>T | p.Arg21Leu | p.R21L | P48729 | protein_coding | deleterious_low_confidence(0) | probably_damaging(0.91) | TCGA-AA-3713-01 | Colorectum | colon adenocarcinoma | Male | >=65 | III/IV | Chemotherapy | 5-fluorouracil | PR | |
| CSNK1A1 | SNV | Missense_Mutation | c.929G>A | p.Arg310His | p.R310H | P48729 | protein_coding | deleterious_low_confidence(0) | benign(0.062) | TCGA-AA-3864-01 | Colorectum | colon adenocarcinoma | Male | >=65 | I/II | Unknown | Unknown | SD | |
| CSNK1A1 | SNV | Missense_Mutation | rs865943998 | c.854C>T | p.Ala285Val | p.A285V | P48729 | protein_coding | tolerated_low_confidence(0.13) | benign(0.261) | TCGA-AA-A022-01 | Colorectum | colon adenocarcinoma | Female | >=65 | I/II | Unknown | Unknown | SD |
| CSNK1A1 | SNV | Missense_Mutation | novel | c.812N>T | p.Thr271Met | p.T271M | P48729 | protein_coding | deleterious_low_confidence(0) | possibly_damaging(0.493) | TCGA-A5-A0G1-01 | Endometrium | uterine corpus endometrioid carcinoma | Female | >=65 | I/II | Unknown | Unknown | SD |
| CSNK1A1 | SNV | Missense_Mutation | c.292N>A | p.Glu98Lys | p.E98K | P48729 | protein_coding | deleterious_low_confidence(0) | probably_damaging(0.975) | TCGA-AJ-A3EL-01 | Endometrium | uterine corpus endometrioid carcinoma | Female | <65 | I/II | Unknown | Unknown | SD | |
| CSNK1A1 | SNV | Missense_Mutation | novel | c.874N>T | p.Arg292Cys | p.R292C | P48729 | protein_coding | deleterious_low_confidence(0) | benign(0.062) | TCGA-AX-A06F-01 | Endometrium | uterine corpus endometrioid carcinoma | Female | <65 | III/IV | Chemotherapy | carboplatin | SD |
| Page: 1 2 3 4 |
Top |
Related drugs of malignant transformation related genes |
| Identification of chemicals and drugs interact with genes involved in malignant transfromation |
| (DGIdb 4.0) |
| Entrez ID | Symbol | Category | Interaction Types | Drug Claim Name | Drug Name | PMIDs |
| 1452 | CSNK1A1 | KINASE, SERINE THREONINE KINASE, DRUGGABLE GENOME, ENZYME | SP-600125 | SP-600125 | ||
| 1452 | CSNK1A1 | KINASE, SERINE THREONINE KINASE, DRUGGABLE GENOME, ENZYME | inhibitor | 178102608 | IC261 | |
| 1452 | CSNK1A1 | KINASE, SERINE THREONINE KINASE, DRUGGABLE GENOME, ENZYME | AZD-1775 | ADAVOSERTIB | ||
| 1452 | CSNK1A1 | KINASE, SERINE THREONINE KINASE, DRUGGABLE GENOME, ENZYME | DNDI1417467 | CHEMBL1997335 | ||
| 1452 | CSNK1A1 | KINASE, SERINE THREONINE KINASE, DRUGGABLE GENOME, ENZYME | SB-220025 | SB-220025 | ||
| 1452 | CSNK1A1 | KINASE, SERINE THREONINE KINASE, DRUGGABLE GENOME, ENZYME | inhibitor | 178102563 | ||
| 1452 | CSNK1A1 | KINASE, SERINE THREONINE KINASE, DRUGGABLE GENOME, ENZYME | 681640 | CHEMBL379975 | ||
| 1452 | CSNK1A1 | KINASE, SERINE THREONINE KINASE, DRUGGABLE GENOME, ENZYME | AG-1879 | CHEMBL406845 | ||
| 1452 | CSNK1A1 | KINASE, SERINE THREONINE KINASE, DRUGGABLE GENOME, ENZYME | PHA-767491 | CHEMBL225519 | ||
| 1452 | CSNK1A1 | KINASE, SERINE THREONINE KINASE, DRUGGABLE GENOME, ENZYME | TAK-715 | TAK-715 |
| Page: 1 2 |

Copyright 2023-Present -The University of Texas Health Science Center at Houston |