
|
|||||
|
 | |
| |
| |
| |
| |
| |
|
Gene: CDC42EP4 |
Gene summary for CDC42EP4 |
| Gene information | Species | Human | Gene symbol | CDC42EP4 | Gene ID | 23580 |
| Gene name | CDC42 effector protein 4 | |
| Gene Alias | BORG4 | |
| Cytomap | 17q25.1 | |
| Gene Type | protein-coding | GO ID | GO:0000902 | UniProtAcc | B2R6D8 |
Top |
Malignant transformation analysis |
| Identification of the aberrant gene expression in precancerous and cancerous lesions by comparing the gene expression of stem-like cells in diseased tissues with normal stem cells |
| Entrez ID | Symbol | Replicates | Species | Organ | Tissue | Adj P-value | Log2FC | Malignancy |
| 23580 | CDC42EP4 | HTA11_2487_2000001011 | Human | Colorectum | SER | 3.45e-08 | 5.27e-01 | -0.1808 |
| 23580 | CDC42EP4 | HTA11_1938_2000001011 | Human | Colorectum | AD | 6.96e-06 | 4.91e-01 | -0.0811 |
| 23580 | CDC42EP4 | HTA11_347_2000001011 | Human | Colorectum | AD | 1.82e-12 | 4.89e-01 | -0.1954 |
| 23580 | CDC42EP4 | HTA11_411_2000001011 | Human | Colorectum | SER | 2.27e-03 | 7.71e-01 | -0.2602 |
| 23580 | CDC42EP4 | HTA11_2112_2000001011 | Human | Colorectum | SER | 1.80e-02 | 6.41e-01 | -0.2196 |
| 23580 | CDC42EP4 | HTA11_3361_2000001011 | Human | Colorectum | AD | 1.07e-02 | 4.39e-01 | -0.1207 |
| 23580 | CDC42EP4 | HTA11_83_2000001011 | Human | Colorectum | SER | 3.28e-02 | 2.74e-01 | -0.1526 |
| 23580 | CDC42EP4 | HTA11_696_2000001011 | Human | Colorectum | AD | 6.18e-15 | 3.90e-01 | -0.1464 |
| 23580 | CDC42EP4 | HTA11_866_2000001011 | Human | Colorectum | AD | 1.87e-09 | 2.92e-01 | -0.1001 |
| 23580 | CDC42EP4 | HTA11_1391_2000001011 | Human | Colorectum | AD | 1.69e-07 | 5.95e-01 | -0.059 |
| 23580 | CDC42EP4 | HTA11_546_2000001011 | Human | Colorectum | AD | 4.02e-06 | 5.50e-01 | -0.0842 |
| 23580 | CDC42EP4 | HTA11_866_3004761011 | Human | Colorectum | AD | 4.91e-03 | 2.97e-01 | 0.096 |
| 23580 | CDC42EP4 | HTA11_7696_3000711011 | Human | Colorectum | AD | 7.14e-08 | 2.72e-01 | 0.0674 |
| 23580 | CDC42EP4 | HTA11_99999970781_79442 | Human | Colorectum | MSS | 1.53e-05 | 2.31e-01 | 0.294 |
| 23580 | CDC42EP4 | HTA11_99999965062_69753 | Human | Colorectum | MSI-H | 1.04e-02 | 8.67e-01 | 0.3487 |
| 23580 | CDC42EP4 | HTA11_99999965104_69814 | Human | Colorectum | MSS | 1.19e-07 | 2.76e-01 | 0.281 |
| 23580 | CDC42EP4 | HTA11_99999971662_82457 | Human | Colorectum | MSS | 4.72e-10 | 3.41e-01 | 0.3859 |
| 23580 | CDC42EP4 | HTA11_99999974143_84620 | Human | Colorectum | MSS | 1.46e-04 | 1.93e-01 | 0.3005 |
| 23580 | CDC42EP4 | LZE5T | Human | Esophagus | ESCC | 4.74e-05 | 2.07e-01 | 0.0514 |
| 23580 | CDC42EP4 | LZE7T | Human | Esophagus | ESCC | 2.05e-07 | 3.63e-01 | 0.0667 |
| Page: 1 2 3 4 5 6 7 |
| Tissue | Expression Dynamics | Abbreviation |
| Colorectum (GSE201348) |  | FAP: Familial adenomatous polyposis |
| CRC: Colorectal cancer | ||
| Colorectum (HTA11) |  | AD: Adenomas |
| SER: Sessile serrated lesions | ||
| MSI-H: Microsatellite-high colorectal cancer | ||
| MSS: Microsatellite stable colorectal cancer | ||
| Esophagus |  | ESCC: Esophageal squamous cell carcinoma |
| HGIN: High-grade intraepithelial neoplasias | ||
| LGIN: Low-grade intraepithelial neoplasias | ||
| Liver |  | HCC: Hepatocellular carcinoma |
| NAFLD: Non-alcoholic fatty liver disease | ||
| Oral Cavity |  | EOLP: Erosive Oral lichen planus |
| LP: leukoplakia | ||
| NEOLP: Non-erosive oral lichen planus | ||
| OSCC: Oral squamous cell carcinoma | ||
| Prostate | 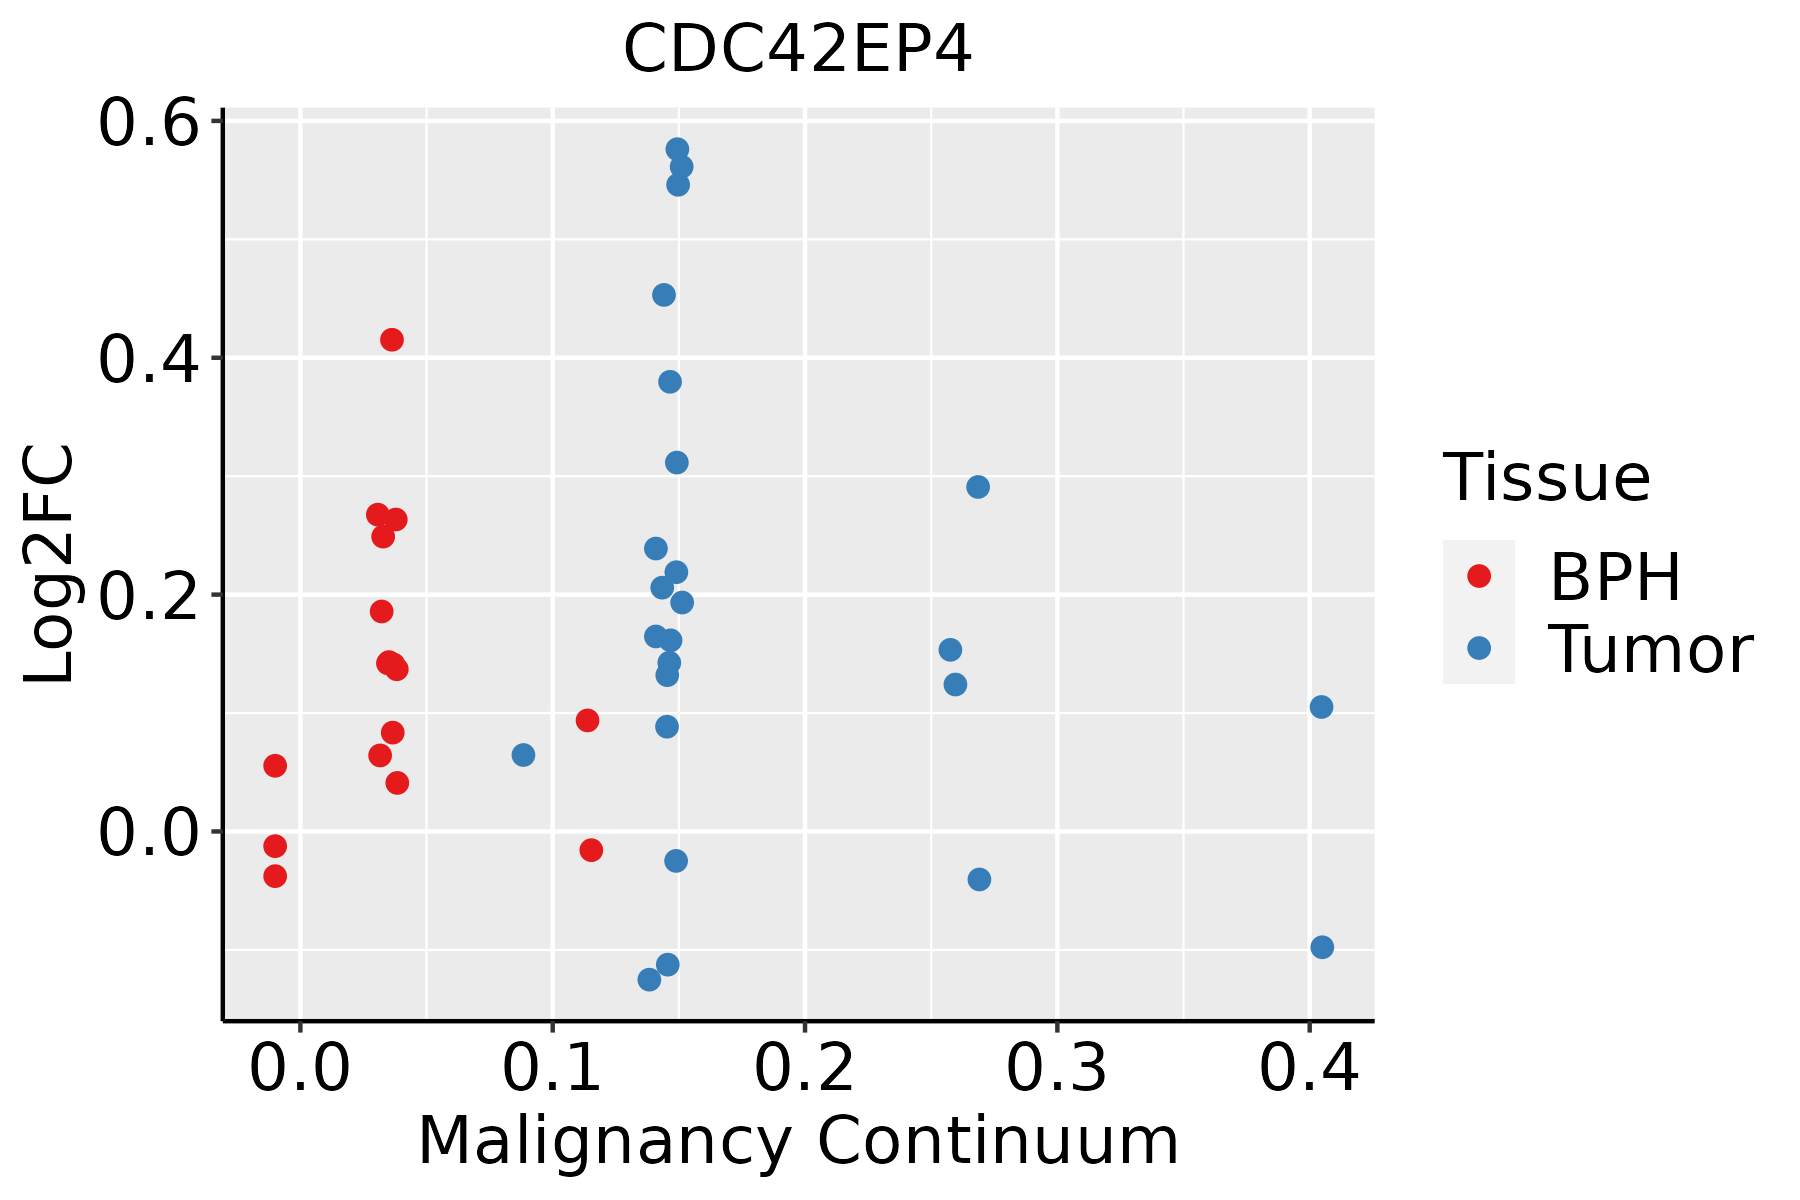 | BPH: Benign Prostatic Hyperplasia |
| Skin | 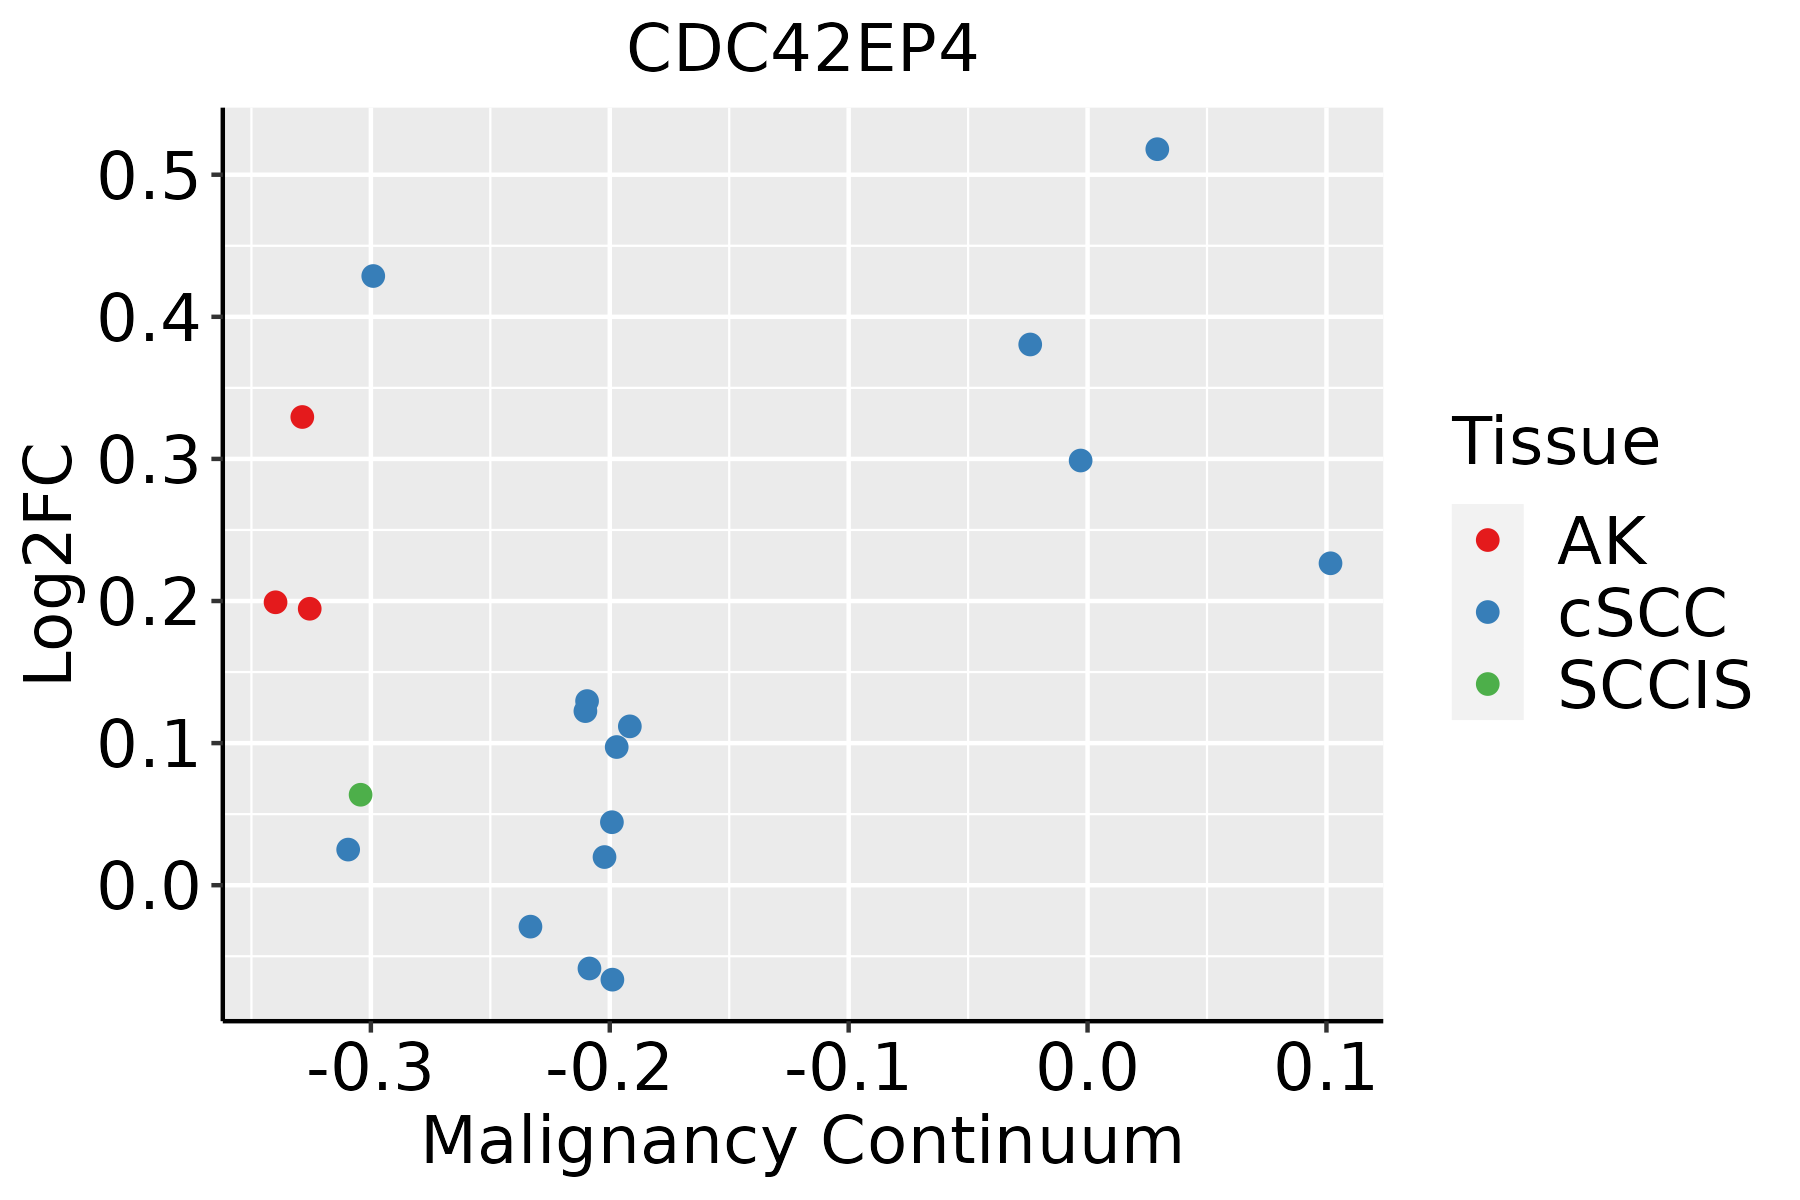 | AK: Actinic keratosis |
| cSCC: Cutaneous squamous cell carcinoma | ||
| SCCIS:squamous cell carcinoma in situ | ||
| Thyroid | 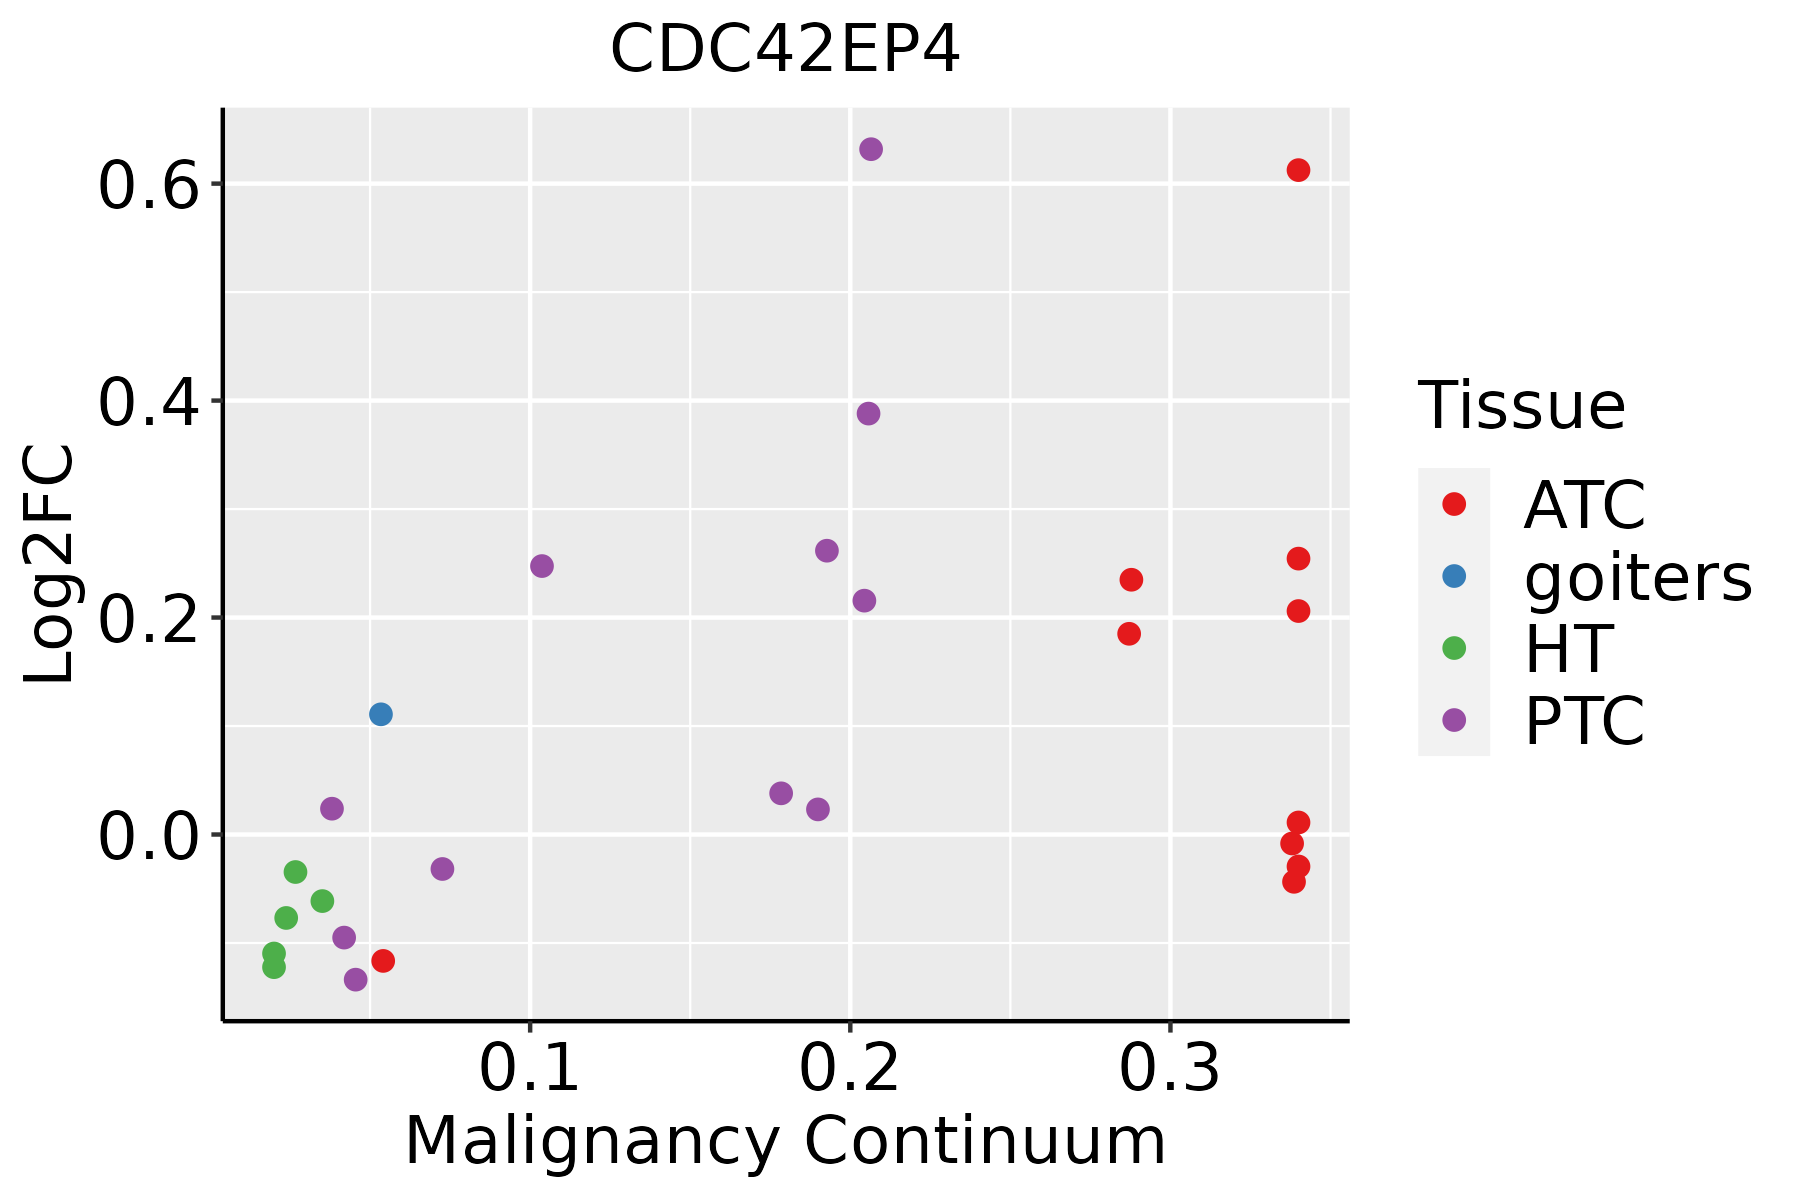 | ATC: Anaplastic thyroid cancer |
| HT: Hashimoto's thyroiditis | ||
| PTC: Papillary thyroid cancer |
| ∗log2FC in expression of this searched gene in stem-like cells from each diseased tissue sample relative to stem-like cells in normal samples in each tissue plotted against the malignancy continuum. Samples are colored based on if they are from different disease stage. |
Top |
Malignant transformation related pathway analysis |
| Find out the enriched GO biological processes and KEGG pathways involved in transition from healthy to precancer to cancer |
| Tissue | Disease Stage | Enriched GO biological Processes |
| Colorectum | AD |  |
| Colorectum | SER |  |
| Colorectum | MSS |  |
| Colorectum | MSI-H |  |
| Colorectum | FAP |  |
| ∗Top 15 enriched GO BP terms are showed in the bar plot of each disease state in each tissue. Each row represents a significant GO biological process which is colored according to the -log10(p.adjust). |
| Page: 1 2 3 4 5 6 7 8 9 |
| GO ID | Tissue | Disease Stage | Description | Gene Ratio | Bg Ratio | pvalue | p.adjust | Count |
| GO:0032956113 | Thyroid | PTC | regulation of actin cytoskeleton organization | 182/5968 | 358/18723 | 4.64e-14 | 2.79e-12 | 182 |
| GO:0032970113 | Thyroid | PTC | regulation of actin filament-based process | 197/5968 | 397/18723 | 8.91e-14 | 4.89e-12 | 197 |
| GO:0051258113 | Thyroid | PTC | protein polymerization | 154/5968 | 297/18723 | 5.35e-13 | 2.66e-11 | 154 |
| GO:0110053112 | Thyroid | PTC | regulation of actin filament organization | 146/5968 | 278/18723 | 5.87e-13 | 2.85e-11 | 146 |
| GO:1902905113 | Thyroid | PTC | positive regulation of supramolecular fiber organization | 114/5968 | 209/18723 | 8.48e-12 | 3.57e-10 | 114 |
| GO:005149526 | Thyroid | PTC | positive regulation of cytoskeleton organization | 121/5968 | 226/18723 | 1.04e-11 | 4.27e-10 | 121 |
| GO:0031346110 | Thyroid | PTC | positive regulation of cell projection organization | 173/5968 | 353/18723 | 1.09e-11 | 4.40e-10 | 173 |
| GO:000815426 | Thyroid | PTC | actin polymerization or depolymerization | 117/5968 | 218/18723 | 1.85e-11 | 7.21e-10 | 117 |
| GO:0032271113 | Thyroid | PTC | regulation of protein polymerization | 123/5968 | 233/18723 | 2.45e-11 | 9.38e-10 | 123 |
| GO:0032535112 | Thyroid | PTC | regulation of cellular component size | 181/5968 | 383/18723 | 1.70e-10 | 5.64e-09 | 181 |
| GO:000726519 | Thyroid | PTC | Ras protein signal transduction | 162/5968 | 337/18723 | 3.16e-10 | 1.02e-08 | 162 |
| GO:0031334113 | Thyroid | PTC | positive regulation of protein-containing complex assembly | 121/5968 | 237/18723 | 5.70e-10 | 1.81e-08 | 121 |
| GO:0008360111 | Thyroid | PTC | regulation of cell shape | 86/5968 | 154/18723 | 6.22e-10 | 1.95e-08 | 86 |
| GO:000806423 | Thyroid | PTC | regulation of actin polymerization or depolymerization | 98/5968 | 188/18723 | 6.00e-09 | 1.53e-07 | 98 |
| GO:003004125 | Thyroid | PTC | actin filament polymerization | 99/5968 | 191/18723 | 7.40e-09 | 1.85e-07 | 99 |
| GO:003083220 | Thyroid | PTC | regulation of actin filament length | 98/5968 | 189/18723 | 8.58e-09 | 2.10e-07 | 98 |
| GO:003227327 | Thyroid | PTC | positive regulation of protein polymerization | 75/5968 | 138/18723 | 3.65e-08 | 8.02e-07 | 75 |
| GO:003083326 | Thyroid | PTC | regulation of actin filament polymerization | 88/5968 | 172/18723 | 1.07e-07 | 2.11e-06 | 88 |
| GO:0120032111 | Thyroid | PTC | regulation of plasma membrane bounded cell projection assembly | 92/5968 | 186/18723 | 4.12e-07 | 6.83e-06 | 92 |
| GO:006049120 | Thyroid | PTC | regulation of cell projection assembly | 92/5968 | 188/18723 | 7.55e-07 | 1.18e-05 | 92 |
| Page: 1 2 3 4 5 6 7 8 9 10 11 12 13 14 15 16 17 18 19 20 21 22 |
| Pathway ID | Tissue | Disease Stage | Description | Gene Ratio | Bg Ratio | pvalue | p.adjust | qvalue | Count |
| Page: 1 |
Top |
Cell-cell communication analysis |
| Identification of potential cell-cell interactions between two cell types and their ligand-receptor pairs for different disease states |
| Ligand | Receptor | LRpair | Pathway | Tissue | Disease Stage |
| Page: 1 |
Top |
Single-cell gene regulatory network inference analysis |
| Find out the significant the regulons (TFs) and the target genes of each regulon across cell types for different disease states |
| TF | Cell Type | Tissue | Disease Stage | Target Gene | RSS | Regulon Activity |
| ∗The dot plots of a searched regulon are shown for all cell subpopulations in each disease state of each tissue based on the regulon specific score inferred using pySCENIC and by calculating the average expression. |
| Page: 1 |
Top |
Somatic mutation of malignant transformation related genes |
| Annotation of somatic variants for genes involved in malignant transformation |
| Hugo Symbol | Variant Class | Variant Classification | dbSNP RS | HGVSc | HGVSp | HGVSp Short | SWISSPROT | BIOTYPE | SIFT | PolyPhen | Tumor Sample Barcode | Tissue | Histology | Sex | Age | Stage | Therapy Types | Drugs | Outcome |
| CDC42EP4 | SNV | Missense_Mutation | c.463G>C | p.Glu155Gln | p.E155Q | Q9H3Q1 | protein_coding | tolerated(0.26) | benign(0.003) | TCGA-D8-A27G-01 | Breast | breast invasive carcinoma | Female | >=65 | I/II | Unknown | Unknown | SD | |
| CDC42EP4 | deletion | Frame_Shift_Del | novel | c.443delA | p.Asn148MetfsTer40 | p.N148Mfs*40 | Q9H3Q1 | protein_coding | TCGA-EW-A2FV-01 | Breast | breast invasive carcinoma | Female | <65 | III/IV | Chemotherapy | docetaxel | SD | ||
| CDC42EP4 | SNV | Missense_Mutation | c.871N>T | p.Pro291Ser | p.P291S | Q9H3Q1 | protein_coding | tolerated(0.16) | benign(0.321) | TCGA-C5-A901-01 | Cervix | cervical & endocervical cancer | Female | <65 | I/II | Unknown | Unknown | SD | |
| CDC42EP4 | SNV | Missense_Mutation | c.944C>T | p.Ser315Leu | p.S315L | Q9H3Q1 | protein_coding | deleterious(0) | probably_damaging(0.922) | TCGA-IR-A3LL-01 | Cervix | cervical & endocervical cancer | Female | <65 | I/II | Chemotherapy | cisplatin | CR | |
| CDC42EP4 | SNV | Missense_Mutation | rs776312011 | c.326C>T | p.Ser109Leu | p.S109L | Q9H3Q1 | protein_coding | deleterious(0) | probably_damaging(0.996) | TCGA-MA-AA41-01 | Cervix | cervical & endocervical cancer | Female | <65 | I/II | Unknown | Unknown | SD |
| CDC42EP4 | deletion | Frame_Shift_Del | novel | c.873delC | p.Ser292AlafsTer90 | p.S292Afs*90 | Q9H3Q1 | protein_coding | TCGA-VS-A9U6-01 | Cervix | cervical & endocervical cancer | Female | <65 | I/II | Chemotherapy | cisplatin | PD | ||
| CDC42EP4 | SNV | Missense_Mutation | rs758557269 | c.136G>A | p.Ala46Thr | p.A46T | Q9H3Q1 | protein_coding | deleterious(0) | probably_damaging(0.999) | TCGA-AA-3949-01 | Colorectum | colon adenocarcinoma | Female | >=65 | III/IV | Unknown | Unknown | SD |
| CDC42EP4 | SNV | Missense_Mutation | rs375486831 | c.508N>A | p.Ala170Thr | p.A170T | Q9H3Q1 | protein_coding | tolerated(0.31) | benign(0) | TCGA-CM-6162-01 | Colorectum | colon adenocarcinoma | Female | <65 | III/IV | Chemotherapy | oxaliplatin | SD |
| CDC42EP4 | SNV | Missense_Mutation | c.577N>A | p.Val193Met | p.V193M | Q9H3Q1 | protein_coding | tolerated(0.38) | benign(0) | TCGA-G4-6586-01 | Colorectum | colon adenocarcinoma | Female | >=65 | I/II | Unknown | Unknown | SD | |
| CDC42EP4 | SNV | Missense_Mutation | c.992C>T | p.Ala331Val | p.A331V | Q9H3Q1 | protein_coding | tolerated(0.16) | benign(0) | TCGA-QG-A5YV-01 | Colorectum | colon adenocarcinoma | Female | <65 | III/IV | Chemotherapy | xeloda | CR |
| Page: 1 2 3 4 |
Top |
Related drugs of malignant transformation related genes |
| Identification of chemicals and drugs interact with genes involved in malignant transfromation |
| (DGIdb 4.0) |
| Entrez ID | Symbol | Category | Interaction Types | Drug Claim Name | Drug Name | PMIDs |
| Page: 1 |

Copyright 2023-Present -The University of Texas Health Science Center at Houston |