| Tissue | Expression Dynamics | Abbreviation |
| Breast |  | IDC: Invasive ductal carcinoma |
| DCIS: Ductal carcinoma in situ |
| Precancer(BRCA1-mut): Precancerous lesion from BRCA1 mutation carriers |
| Colorectum (GSE201348) |  | FAP: Familial adenomatous polyposis |
| CRC: Colorectal cancer |
| Colorectum (HTA11) |  | AD: Adenomas |
| SER: Sessile serrated lesions |
| MSI-H: Microsatellite-high colorectal cancer |
| MSS: Microsatellite stable colorectal cancer |
| Esophagus |  | ESCC: Esophageal squamous cell carcinoma |
| HGIN: High-grade intraepithelial neoplasias |
| LGIN: Low-grade intraepithelial neoplasias |
| Liver |  | HCC: Hepatocellular carcinoma |
| NAFLD: Non-alcoholic fatty liver disease |
| Oral Cavity |  | EOLP: Erosive Oral lichen planus |
| LP: leukoplakia |
| NEOLP: Non-erosive oral lichen planus |
| OSCC: Oral squamous cell carcinoma |
| Prostate |  | BPH: Benign Prostatic Hyperplasia |
| Skin | 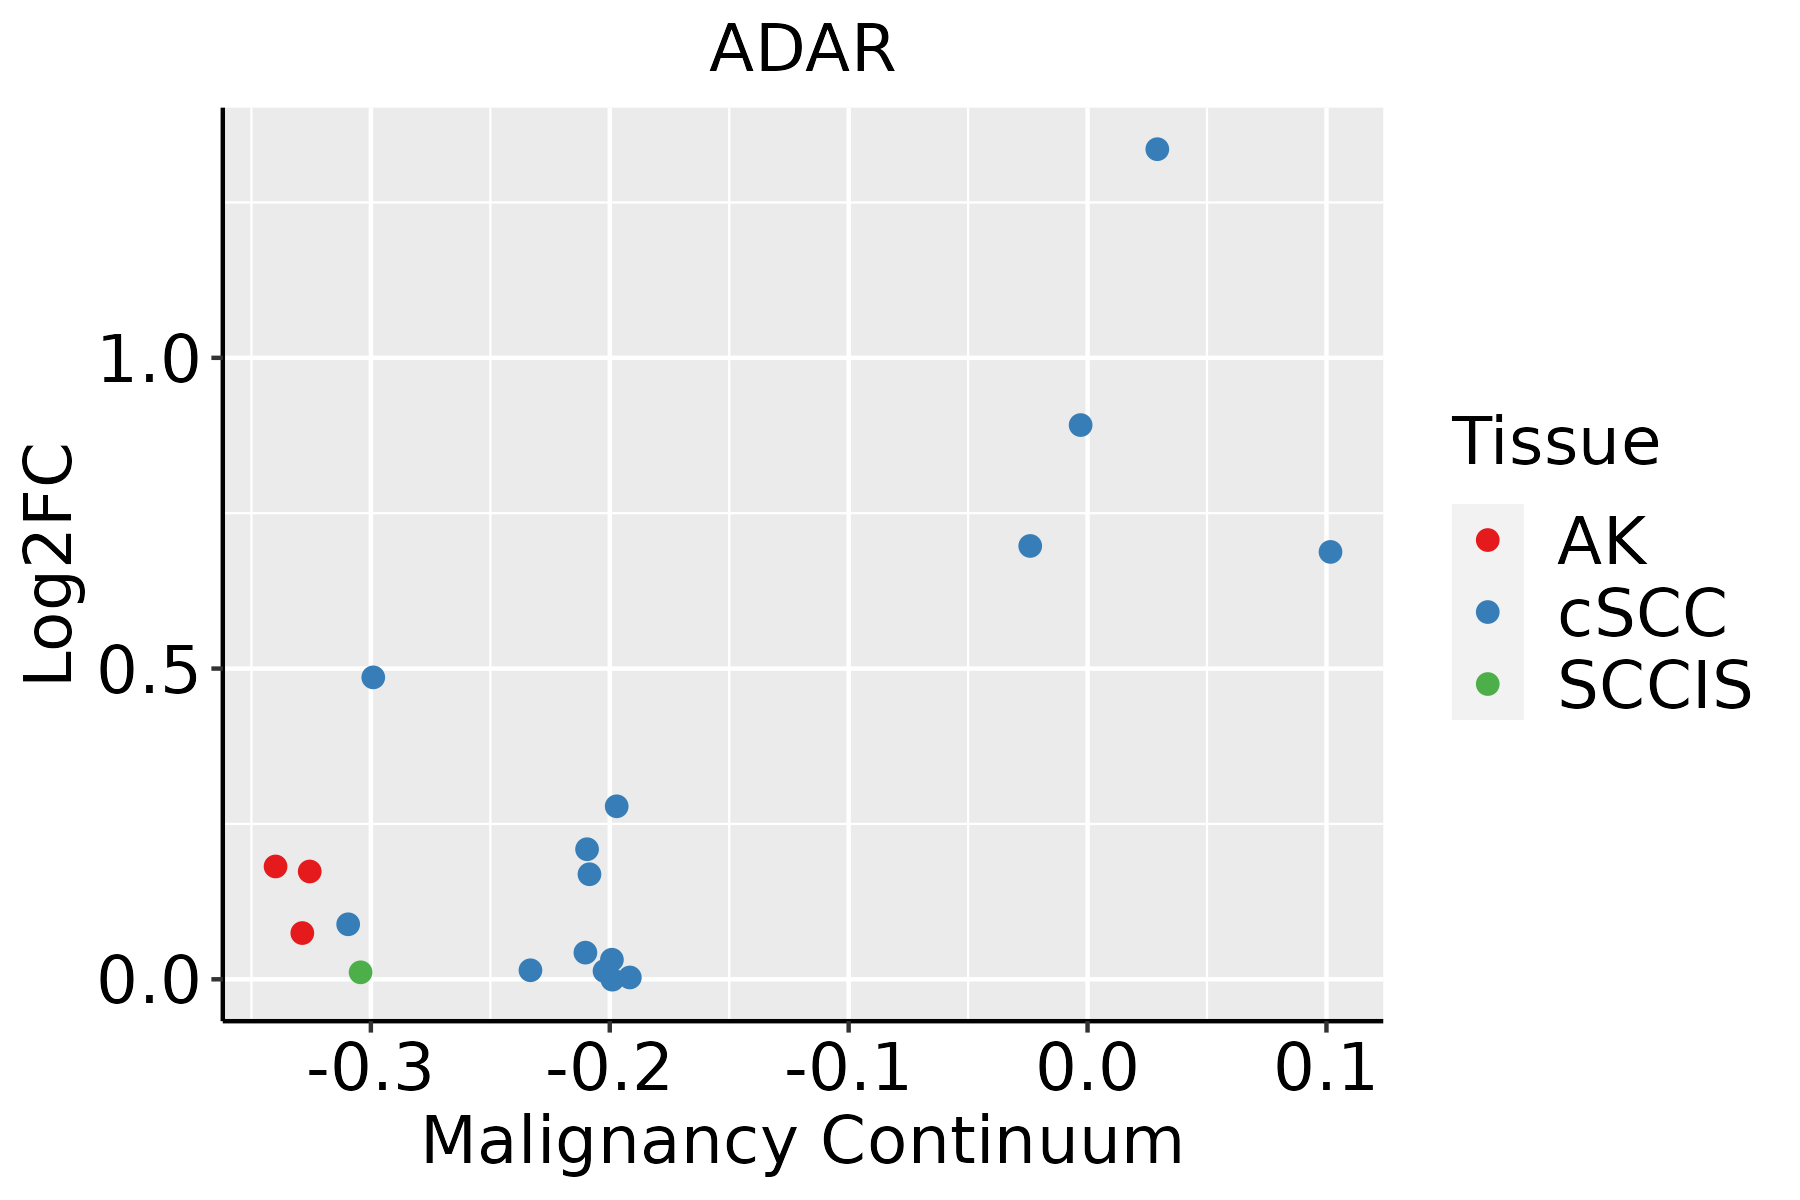 | AK: Actinic keratosis |
| cSCC: Cutaneous squamous cell carcinoma |
| SCCIS:squamous cell carcinoma in situ |
| Thyroid | 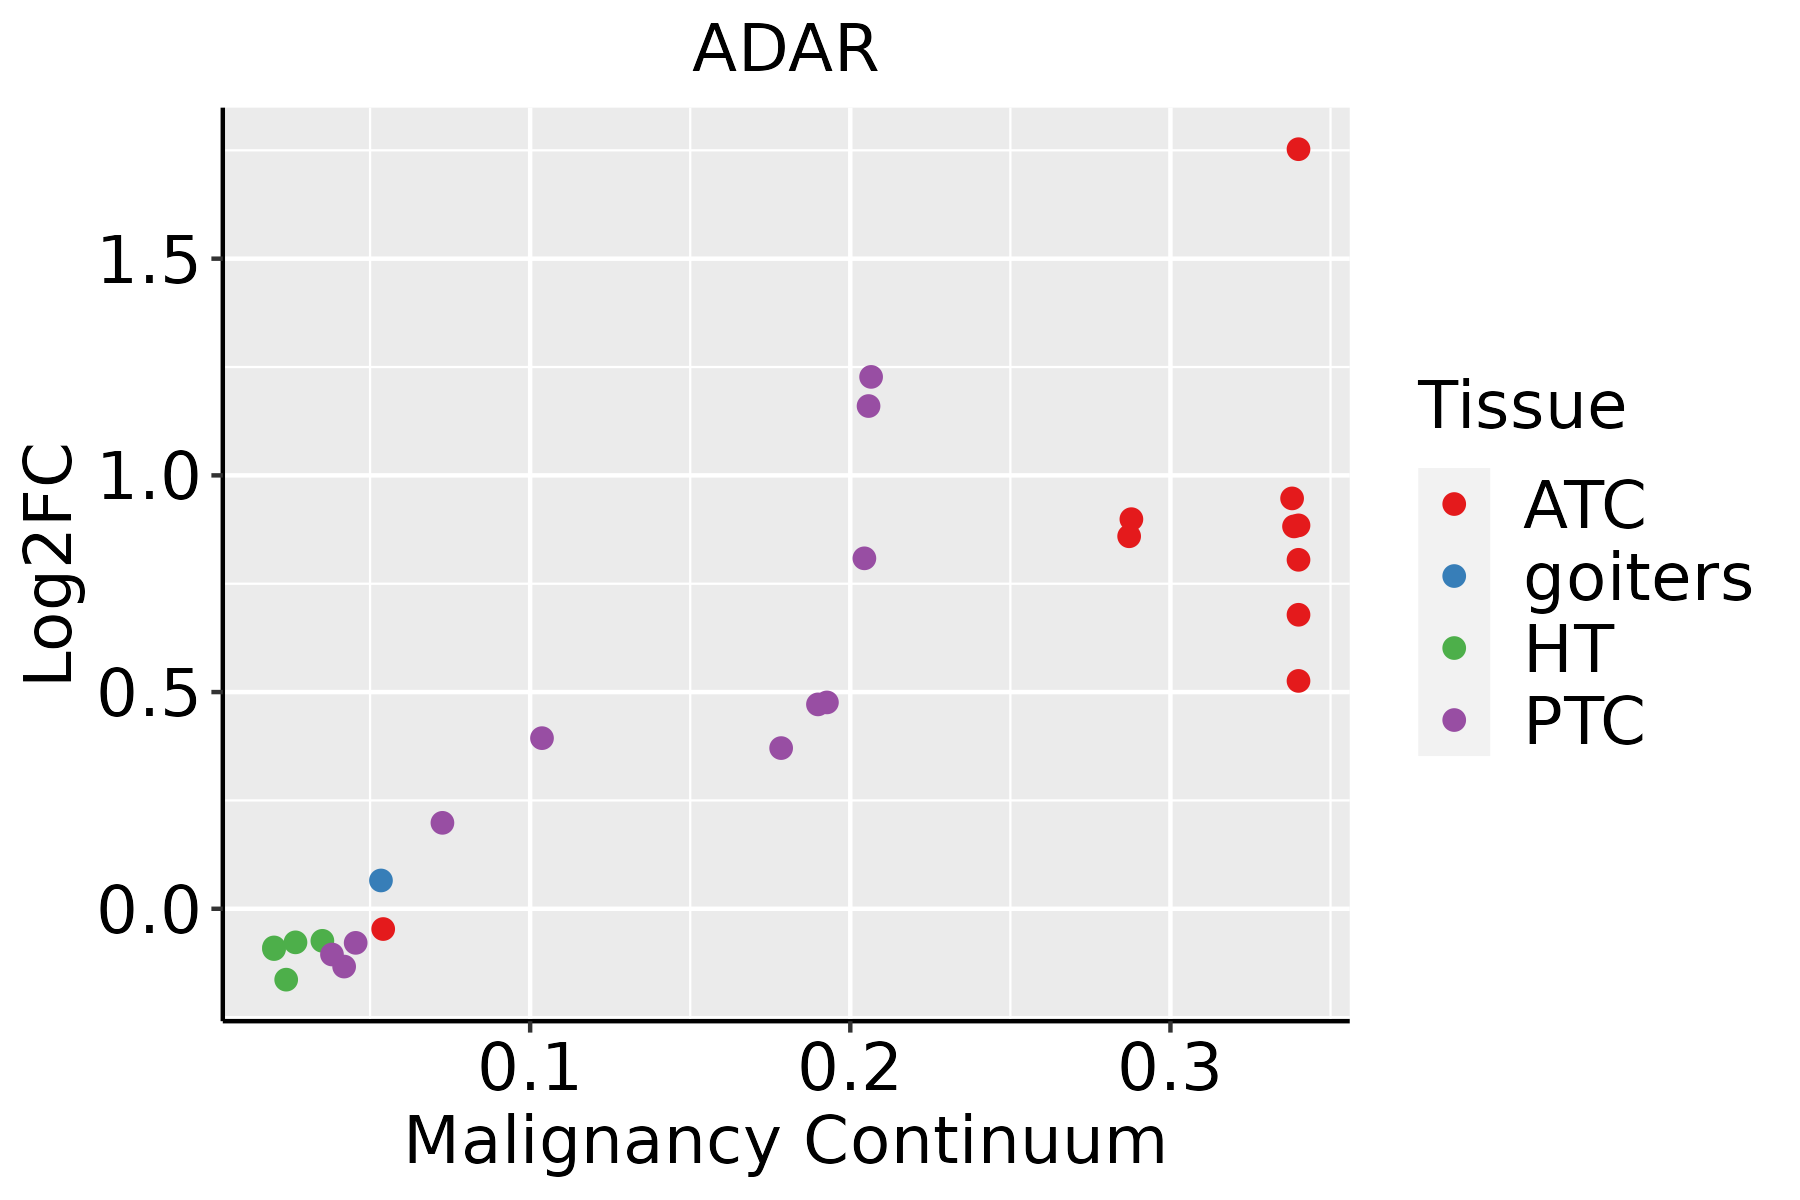 | ATC: Anaplastic thyroid cancer |
| HT: Hashimoto's thyroiditis |
| PTC: Papillary thyroid cancer |
| GO ID | Tissue | Disease Stage | Description | Gene Ratio | Bg Ratio | pvalue | p.adjust | Count |
| GO:00310541 | Liver | HCC | pre-miRNA processing | 13/7958 | 14/18723 | 1.25e-04 | 1.03e-03 | 13 |
| GO:006096621 | Liver | HCC | regulation of gene silencing by RNA | 35/7958 | 53/18723 | 4.59e-04 | 3.04e-03 | 35 |
| GO:006014721 | Liver | HCC | regulation of posttranscriptional gene silencing | 34/7958 | 52/18723 | 7.24e-04 | 4.42e-03 | 34 |
| GO:0060338 | Liver | HCC | regulation of type I interferon-mediated signaling pathway | 24/7958 | 36/18723 | 2.95e-03 | 1.38e-02 | 24 |
| GO:00450881 | Liver | HCC | regulation of innate immune response | 113/7958 | 218/18723 | 3.27e-03 | 1.50e-02 | 113 |
| GO:00458241 | Liver | HCC | negative regulation of innate immune response | 42/7958 | 71/18723 | 3.41e-03 | 1.55e-02 | 42 |
| GO:0050777 | Liver | HCC | negative regulation of immune response | 101/7958 | 194/18723 | 4.40e-03 | 1.90e-02 | 101 |
| GO:0002200 | Liver | HCC | somatic diversification of immune receptors | 44/7958 | 77/18723 | 6.70e-03 | 2.72e-02 | 44 |
| GO:000164911 | Liver | HCC | osteoblast differentiation | 115/7958 | 229/18723 | 1.08e-02 | 3.99e-02 | 115 |
| GO:0016246 | Liver | HCC | RNA interference | 10/7958 | 13/18723 | 1.28e-02 | 4.61e-02 | 10 |
| GO:002261320 | Oral cavity | OSCC | ribonucleoprotein complex biogenesis | 333/7305 | 463/18723 | 8.28e-48 | 5.24e-44 | 333 |
| GO:001603220 | Oral cavity | OSCC | viral process | 274/7305 | 415/18723 | 2.42e-29 | 1.70e-26 | 274 |
| GO:00344709 | Oral cavity | OSCC | ncRNA processing | 263/7305 | 395/18723 | 4.38e-29 | 2.78e-26 | 263 |
| GO:00346605 | Oral cavity | OSCC | ncRNA metabolic process | 296/7305 | 485/18723 | 2.94e-23 | 6.65e-21 | 296 |
| GO:001905820 | Oral cavity | OSCC | viral life cycle | 208/7305 | 317/18723 | 4.59e-22 | 1.00e-19 | 208 |
| GO:007182620 | Oral cavity | OSCC | ribonucleoprotein complex subunit organization | 152/7305 | 227/18723 | 1.05e-17 | 1.01e-15 | 152 |
| GO:002261820 | Oral cavity | OSCC | ribonucleoprotein complex assembly | 146/7305 | 220/18723 | 1.53e-16 | 1.23e-14 | 146 |
| GO:001907920 | Oral cavity | OSCC | viral genome replication | 95/7305 | 131/18723 | 6.35e-15 | 4.02e-13 | 95 |
| GO:000961515 | Oral cavity | OSCC | response to virus | 215/7305 | 367/18723 | 1.63e-14 | 9.41e-13 | 215 |
| GO:005134820 | Oral cavity | OSCC | negative regulation of transferase activity | 165/7305 | 268/18723 | 5.02e-14 | 2.74e-12 | 165 |
| Pathway ID | Tissue | Disease Stage | Description | Gene Ratio | Bg Ratio | pvalue | p.adjust | qvalue | Count |
| hsa0517144 | Breast | DCIS | Coronavirus disease - COVID-19 | 86/846 | 232/8465 | 2.42e-29 | 1.56e-27 | 1.15e-27 | 86 |
| hsa0517154 | Breast | DCIS | Coronavirus disease - COVID-19 | 86/846 | 232/8465 | 2.42e-29 | 1.56e-27 | 1.15e-27 | 86 |
| hsa05171 | Colorectum | AD | Coronavirus disease - COVID-19 | 113/2092 | 232/8465 | 9.90e-16 | 2.55e-14 | 1.63e-14 | 113 |
| hsa051711 | Colorectum | AD | Coronavirus disease - COVID-19 | 113/2092 | 232/8465 | 9.90e-16 | 2.55e-14 | 1.63e-14 | 113 |
| hsa051718 | Colorectum | FAP | Coronavirus disease - COVID-19 | 78/1404 | 232/8465 | 9.94e-11 | 1.11e-08 | 6.73e-09 | 78 |
| hsa051719 | Colorectum | FAP | Coronavirus disease - COVID-19 | 78/1404 | 232/8465 | 9.94e-11 | 1.11e-08 | 6.73e-09 | 78 |
| hsa0517139 | Esophagus | HGIN | Coronavirus disease - COVID-19 | 105/1383 | 232/8465 | 7.84e-26 | 5.11e-24 | 4.06e-24 | 105 |
| hsa0516420 | Esophagus | HGIN | Influenza A | 42/1383 | 171/8465 | 3.41e-03 | 2.54e-02 | 2.02e-02 | 42 |
| hsa05171115 | Esophagus | HGIN | Coronavirus disease - COVID-19 | 105/1383 | 232/8465 | 7.84e-26 | 5.11e-24 | 4.06e-24 | 105 |
| hsa05164110 | Esophagus | HGIN | Influenza A | 42/1383 | 171/8465 | 3.41e-03 | 2.54e-02 | 2.02e-02 | 42 |
| hsa0516425 | Esophagus | ESCC | Influenza A | 122/4205 | 171/8465 | 5.01e-09 | 4.79e-08 | 2.45e-08 | 122 |
| hsa0516435 | Esophagus | ESCC | Influenza A | 122/4205 | 171/8465 | 5.01e-09 | 4.79e-08 | 2.45e-08 | 122 |
| hsa0517122 | Liver | Cirrhotic | Coronavirus disease - COVID-19 | 136/2530 | 232/8465 | 3.28e-20 | 1.82e-18 | 1.12e-18 | 136 |
| hsa0516410 | Liver | Cirrhotic | Influenza A | 66/2530 | 171/8465 | 8.56e-03 | 2.91e-02 | 1.79e-02 | 66 |
| hsa0517132 | Liver | Cirrhotic | Coronavirus disease - COVID-19 | 136/2530 | 232/8465 | 3.28e-20 | 1.82e-18 | 1.12e-18 | 136 |
| hsa0516411 | Liver | Cirrhotic | Influenza A | 66/2530 | 171/8465 | 8.56e-03 | 2.91e-02 | 1.79e-02 | 66 |
| hsa0517142 | Liver | HCC | Coronavirus disease - COVID-19 | 167/4020 | 232/8465 | 1.50e-14 | 4.19e-13 | 2.33e-13 | 167 |
| hsa0516421 | Liver | HCC | Influenza A | 101/4020 | 171/8465 | 1.41e-03 | 5.07e-03 | 2.82e-03 | 101 |
| hsa0517152 | Liver | HCC | Coronavirus disease - COVID-19 | 167/4020 | 232/8465 | 1.50e-14 | 4.19e-13 | 2.33e-13 | 167 |
| hsa0516431 | Liver | HCC | Influenza A | 101/4020 | 171/8465 | 1.41e-03 | 5.07e-03 | 2.82e-03 | 101 |
| Hugo Symbol | Variant Class | Variant Classification | dbSNP RS | HGVSc | HGVSp | HGVSp Short | SWISSPROT | BIOTYPE | SIFT | PolyPhen | Tumor Sample Barcode | Tissue | Histology | Sex | Age | Stage | Therapy Types | Drugs | Outcome |
| ADAR | SNV | Missense_Mutation | novel | c.2821N>C | p.Glu941Gln | p.E941Q | P55265 | protein_coding | deleterious(0.01) | probably_damaging(0.996) | TCGA-5L-AAT1-01 | Breast | breast invasive carcinoma | Female | <65 | III/IV | Hormone Therapy | letrozol | SD |
| ADAR | SNV | Missense_Mutation | novel | c.32N>T | p.Gly11Val | p.G11V | P55265 | protein_coding | tolerated_low_confidence(0.09) | benign(0.011) | TCGA-5L-AAT1-01 | Breast | breast invasive carcinoma | Female | <65 | III/IV | Hormone Therapy | letrozol | SD |
| ADAR | SNV | Missense_Mutation | | c.310N>T | p.Leu104Phe | p.L104F | P55265 | protein_coding | tolerated(0.68) | benign(0.001) | TCGA-A8-A07R-01 | Breast | breast invasive carcinoma | Female | >=65 | III/IV | Ancillary | zoledronic | SD |
| ADAR | SNV | Missense_Mutation | | c.2893C>A | p.Pro965Thr | p.P965T | P55265 | protein_coding | deleterious(0) | probably_damaging(0.999) | TCGA-AC-A23H-01 | Breast | breast invasive carcinoma | Female | >=65 | I/II | Unknown | Unknown | PD |
| ADAR | SNV | Missense_Mutation | | c.2693C>G | p.Ser898Cys | p.S898C | P55265 | protein_coding | deleterious(0) | probably_damaging(0.956) | TCGA-AC-A23H-01 | Breast | breast invasive carcinoma | Female | >=65 | I/II | Unknown | Unknown | PD |
| ADAR | SNV | Missense_Mutation | novel | c.3477G>T | p.Lys1159Asn | p.K1159N | P55265 | protein_coding | deleterious(0.02) | probably_damaging(0.998) | TCGA-AN-A046-01 | Breast | breast invasive carcinoma | Female | >=65 | I/II | Unknown | Unknown | SD |
| ADAR | SNV | Missense_Mutation | | c.3331N>C | p.Ile1111Leu | p.I1111L | P55265 | protein_coding | deleterious(0) | benign(0.006) | TCGA-AR-A24R-01 | Breast | breast invasive carcinoma | Female | <65 | III/IV | Chemotherapy | cytoxan | SD |
| ADAR | insertion | In_Frame_Ins | novel | c.2202_2203insTGTGGGCAGCTGCAACACACTGGTAAGTAT | p.Tyr734_Ala735insCysGlyGlnLeuGlnHisThrGlyLysTyr | p.Y734_A735insCGQLQHTGKY | P55265 | protein_coding | | | TCGA-A2-A0CP-01 | Breast | breast invasive carcinoma | Female | <65 | I/II | Chemotherapy | cytoxan | SD |
| ADAR | insertion | In_Frame_Ins | novel | c.480_481insGCCCTCCTT | p.Asp160_Leu161insAlaLeuLeu | p.D160_L161insALL | P55265 | protein_coding | | | TCGA-AO-A0JB-01 | Breast | breast invasive carcinoma | Female | <65 | III/IV | Chemotherapy | cyclophosphamide | SD |
| ADAR | insertion | Frame_Shift_Ins | novel | c.2972_2973insGGGTAAGGAGACAGGAGAGCGCAGTGAGGACCAAGCCTCTG | p.Phe992GlyfsTer76 | p.F992Gfs*76 | P55265 | protein_coding | | | TCGA-BH-A0H7-01 | Breast | breast invasive carcinoma | Female | >=65 | III/IV | Chemotherapy | doxorubicin | SD |


