
|
|||||
|
 | |
| |
| |
| |
| |
| |
|
Gene: ZDHHC8 |
Gene summary for ZDHHC8 |
| Gene information | Species | Human | Gene symbol | ZDHHC8 | Gene ID | 29801 |
| Gene name | zinc finger DHHC-type palmitoyltransferase 8 | |
| Gene Alias | DHHC8 | |
| Cytomap | 22q11.21 | |
| Gene Type | protein-coding | GO ID | GO:0006464 | UniProtAcc | Q9ULC8 |
Top |
Malignant transformation analysis |
| Identification of the aberrant gene expression in precancerous and cancerous lesions by comparing the gene expression of stem-like cells in diseased tissues with normal stem cells |
| Entrez ID | Symbol | Replicates | Species | Organ | Tissue | Adj P-value | Log2FC | Malignancy |
| 29801 | ZDHHC8 | LZE21T | Human | Esophagus | ESCC | 1.83e-03 | 1.36e-01 | 0.0655 |
| 29801 | ZDHHC8 | P1T-E | Human | Esophagus | ESCC | 5.25e-03 | 9.42e-02 | 0.0875 |
| 29801 | ZDHHC8 | P2T-E | Human | Esophagus | ESCC | 7.79e-03 | -1.13e-02 | 0.1177 |
| 29801 | ZDHHC8 | P5T-E | Human | Esophagus | ESCC | 7.59e-08 | 6.24e-02 | 0.1327 |
| 29801 | ZDHHC8 | P8T-E | Human | Esophagus | ESCC | 7.05e-07 | 4.42e-02 | 0.0889 |
| 29801 | ZDHHC8 | P9T-E | Human | Esophagus | ESCC | 3.68e-02 | -5.12e-03 | 0.1131 |
| 29801 | ZDHHC8 | P10T-E | Human | Esophagus | ESCC | 3.11e-18 | 5.18e-01 | 0.116 |
| 29801 | ZDHHC8 | P12T-E | Human | Esophagus | ESCC | 8.86e-06 | 3.94e-02 | 0.1122 |
| 29801 | ZDHHC8 | P15T-E | Human | Esophagus | ESCC | 2.67e-12 | 6.95e-02 | 0.1149 |
| 29801 | ZDHHC8 | P16T-E | Human | Esophagus | ESCC | 3.00e-03 | 2.79e-02 | 0.1153 |
| 29801 | ZDHHC8 | P20T-E | Human | Esophagus | ESCC | 1.15e-08 | 5.00e-02 | 0.1124 |
| 29801 | ZDHHC8 | P21T-E | Human | Esophagus | ESCC | 6.55e-21 | 5.08e-01 | 0.1617 |
| 29801 | ZDHHC8 | P22T-E | Human | Esophagus | ESCC | 1.34e-09 | 1.03e-01 | 0.1236 |
| 29801 | ZDHHC8 | P23T-E | Human | Esophagus | ESCC | 6.30e-08 | 5.53e-02 | 0.108 |
| 29801 | ZDHHC8 | P24T-E | Human | Esophagus | ESCC | 1.71e-06 | 5.86e-02 | 0.1287 |
| 29801 | ZDHHC8 | P26T-E | Human | Esophagus | ESCC | 1.01e-05 | 3.90e-02 | 0.1276 |
| 29801 | ZDHHC8 | P27T-E | Human | Esophagus | ESCC | 1.37e-05 | 2.50e-02 | 0.1055 |
| 29801 | ZDHHC8 | P28T-E | Human | Esophagus | ESCC | 5.98e-07 | 2.92e-02 | 0.1149 |
| 29801 | ZDHHC8 | P30T-E | Human | Esophagus | ESCC | 1.16e-05 | 1.97e-01 | 0.137 |
| 29801 | ZDHHC8 | P31T-E | Human | Esophagus | ESCC | 3.72e-15 | 1.27e-01 | 0.1251 |
| Page: 1 2 3 |
| Tissue | Expression Dynamics | Abbreviation |
| Esophagus | 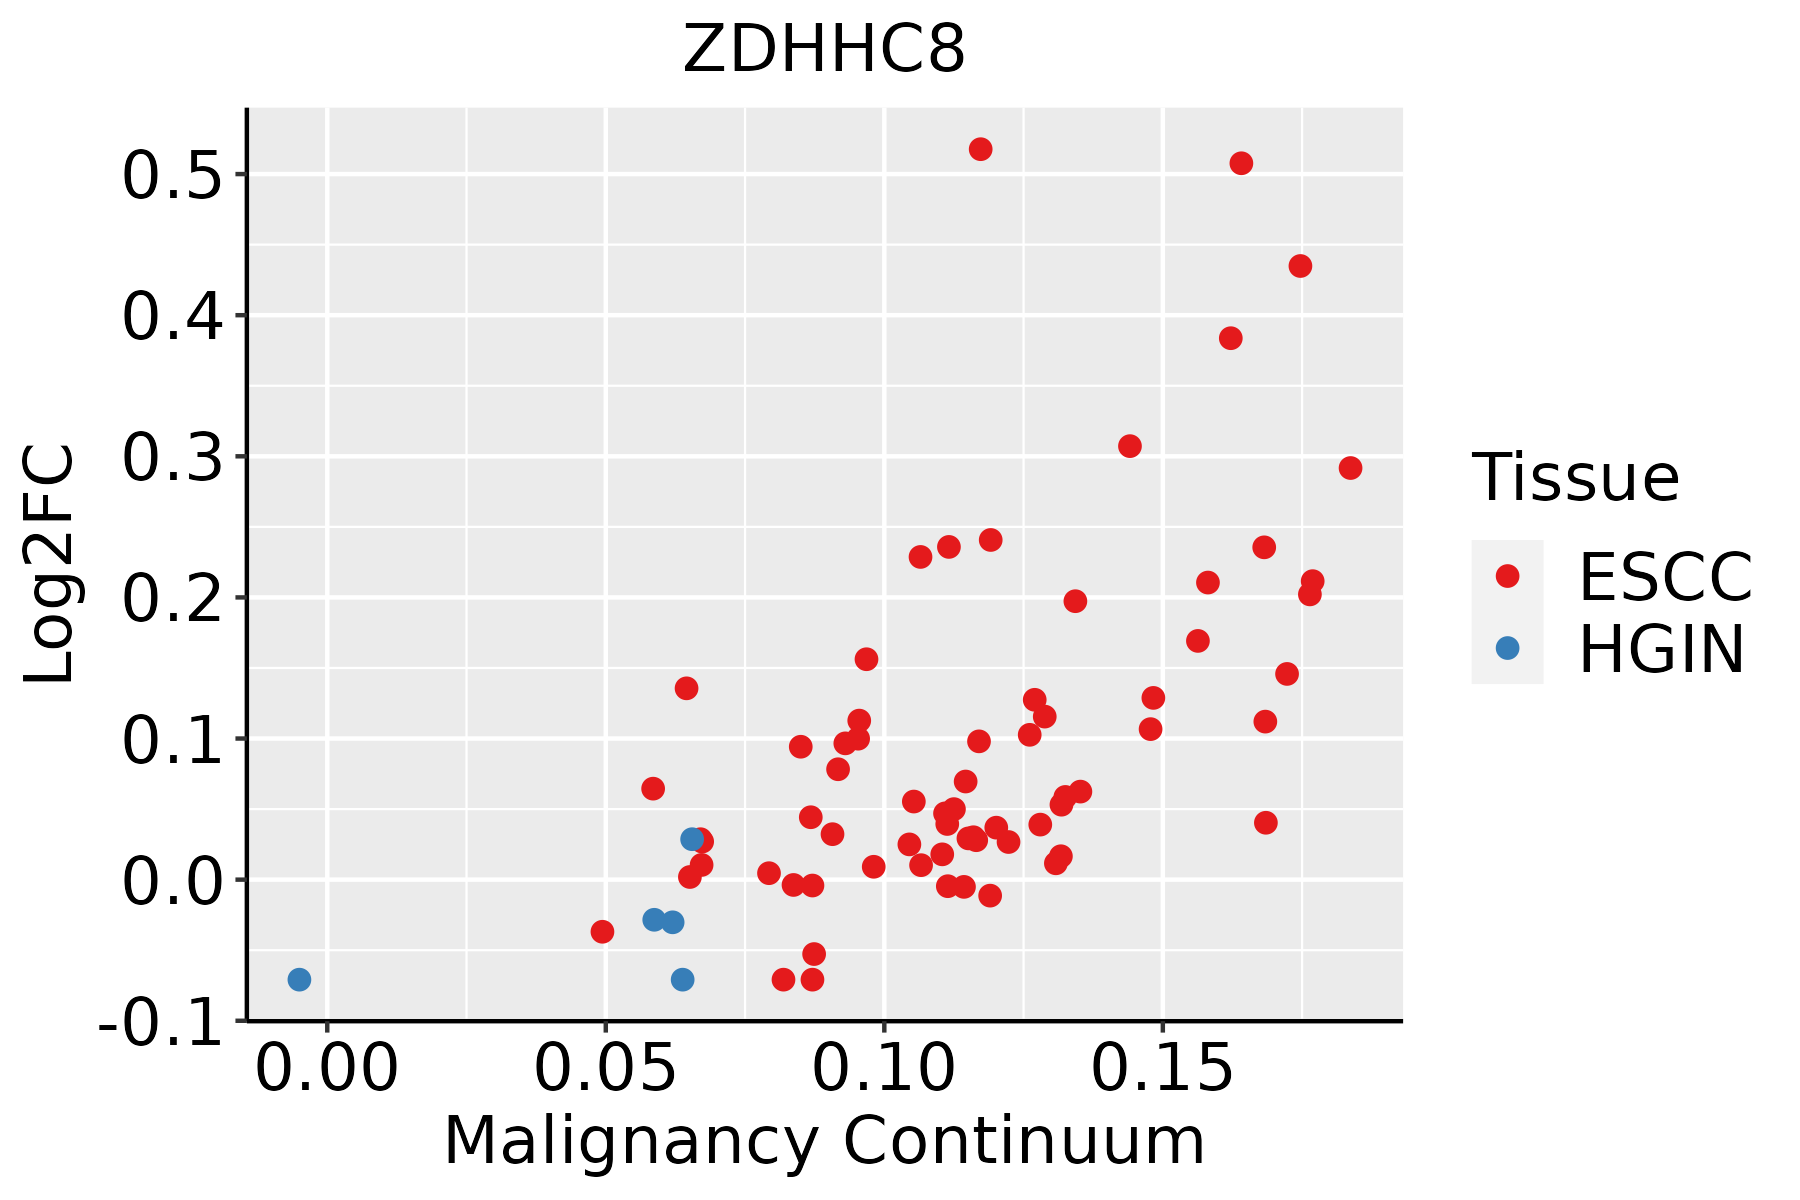 | ESCC: Esophageal squamous cell carcinoma |
| HGIN: High-grade intraepithelial neoplasias | ||
| LGIN: Low-grade intraepithelial neoplasias | ||
| Oral Cavity | 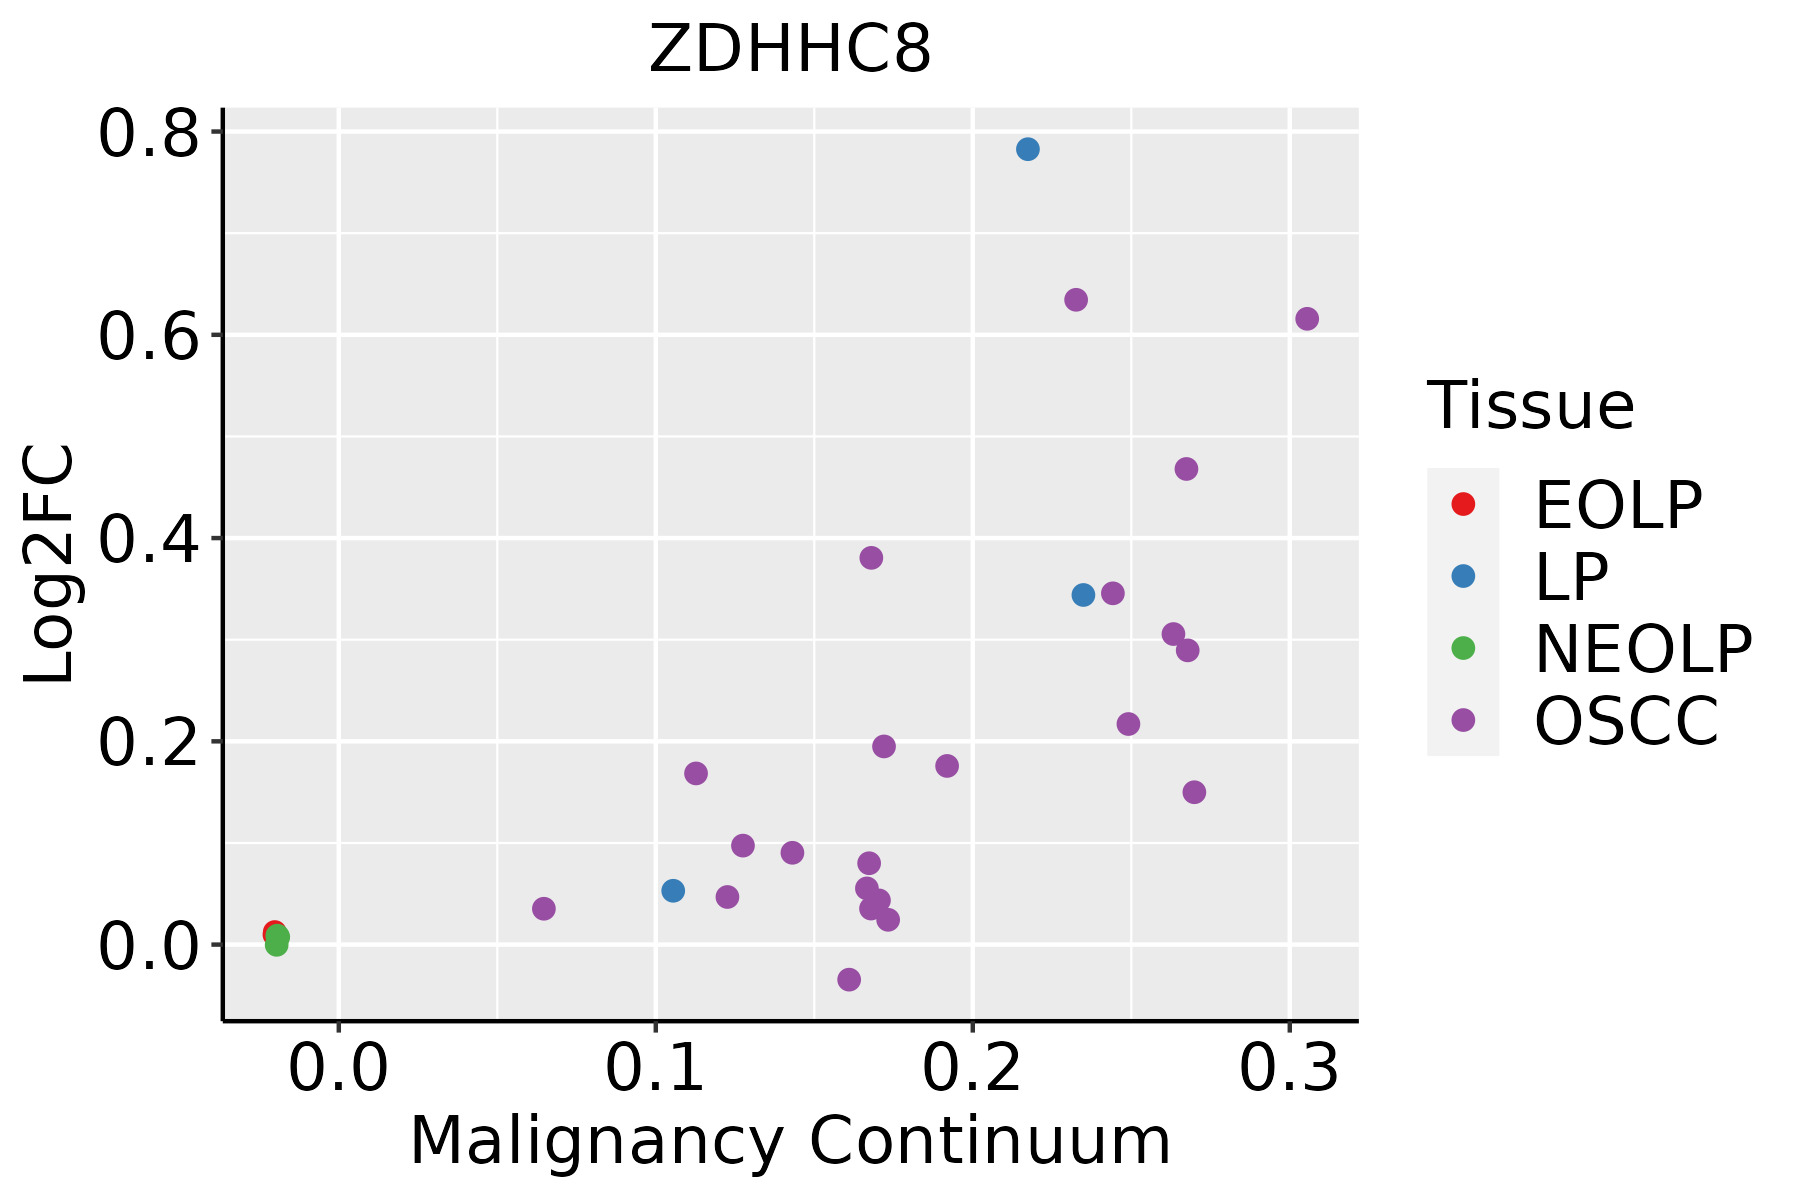 | EOLP: Erosive Oral lichen planus |
| LP: leukoplakia | ||
| NEOLP: Non-erosive oral lichen planus | ||
| OSCC: Oral squamous cell carcinoma |
| ∗log2FC in expression of this searched gene in stem-like cells from each diseased tissue sample relative to stem-like cells in normal samples in each tissue plotted against the malignancy continuum. Samples are colored based on if they are from different disease stage. |
Top |
Malignant transformation related pathway analysis |
| Find out the enriched GO biological processes and KEGG pathways involved in transition from healthy to precancer to cancer |
| Tissue | Disease Stage | Enriched GO biological Processes |
| Colorectum | AD |  |
| Colorectum | SER |  |
| Colorectum | MSS |  |
| Colorectum | MSI-H |  |
| Colorectum | FAP |  |
| ∗Top 15 enriched GO BP terms are showed in the bar plot of each disease state in each tissue. Each row represents a significant GO biological process which is colored according to the -log10(p.adjust). |
| Page: 1 2 3 4 5 6 7 8 9 |
| GO ID | Tissue | Disease Stage | Description | Gene Ratio | Bg Ratio | pvalue | p.adjust | Count |
| GO:190547716 | Oral cavity | OSCC | positive regulation of protein localization to membrane | 65/7305 | 106/18723 | 2.69e-06 | 3.32e-05 | 65 |
| GO:00421572 | Oral cavity | OSCC | lipoprotein metabolic process | 77/7305 | 135/18723 | 1.61e-05 | 1.60e-04 | 77 |
| GO:00064972 | Oral cavity | OSCC | protein lipidation | 56/7305 | 92/18723 | 1.77e-05 | 1.72e-04 | 56 |
| GO:00421582 | Oral cavity | OSCC | lipoprotein biosynthetic process | 57/7305 | 96/18723 | 4.17e-05 | 3.61e-04 | 57 |
| GO:190437716 | Oral cavity | OSCC | positive regulation of protein localization to cell periphery | 43/7305 | 69/18723 | 7.43e-05 | 5.81e-04 | 43 |
| GO:190307815 | Oral cavity | OSCC | positive regulation of protein localization to plasma membrane | 39/7305 | 62/18723 | 1.19e-04 | 8.54e-04 | 39 |
| GO:1903829110 | Oral cavity | LP | positive regulation of cellular protein localization | 127/4623 | 276/18723 | 7.52e-15 | 9.81e-13 | 127 |
| GO:007265919 | Oral cavity | LP | protein localization to plasma membrane | 119/4623 | 284/18723 | 1.11e-10 | 6.44e-09 | 119 |
| GO:199077817 | Oral cavity | LP | protein localization to cell periphery | 133/4623 | 333/18723 | 4.42e-10 | 2.21e-08 | 133 |
| GO:190547517 | Oral cavity | LP | regulation of protein localization to membrane | 74/4623 | 175/18723 | 2.26e-07 | 6.81e-06 | 74 |
| GO:190307618 | Oral cavity | LP | regulation of protein localization to plasma membrane | 48/4623 | 104/18723 | 1.51e-06 | 3.62e-05 | 48 |
| GO:004354312 | Oral cavity | LP | protein acylation | 93/4623 | 243/18723 | 1.65e-06 | 3.86e-05 | 93 |
| GO:190437517 | Oral cavity | LP | regulation of protein localization to cell periphery | 55/4623 | 125/18723 | 1.77e-06 | 4.11e-05 | 55 |
| GO:004215711 | Oral cavity | LP | lipoprotein metabolic process | 57/4623 | 135/18723 | 5.59e-06 | 1.11e-04 | 57 |
| GO:000649711 | Oral cavity | LP | protein lipidation | 40/4623 | 92/18723 | 6.04e-05 | 8.20e-04 | 40 |
| GO:004215811 | Oral cavity | LP | lipoprotein biosynthetic process | 41/4623 | 96/18723 | 8.04e-05 | 1.04e-03 | 41 |
| GO:190547717 | Oral cavity | LP | positive regulation of protein localization to membrane | 43/4623 | 106/18723 | 2.23e-04 | 2.41e-03 | 43 |
| GO:190437717 | Oral cavity | LP | positive regulation of protein localization to cell periphery | 29/4623 | 69/18723 | 1.15e-03 | 9.40e-03 | 29 |
| GO:190307816 | Oral cavity | LP | positive regulation of protein localization to plasma membrane | 26/4623 | 62/18723 | 2.11e-03 | 1.54e-02 | 26 |
| GO:0018198 | Oral cavity | LP | peptidyl-cysteine modification | 20/4623 | 49/18723 | 9.35e-03 | 4.98e-02 | 20 |
| Page: 1 2 |
| Pathway ID | Tissue | Disease Stage | Description | Gene Ratio | Bg Ratio | pvalue | p.adjust | qvalue | Count |
| Page: 1 |
Top |
Cell-cell communication analysis |
| Identification of potential cell-cell interactions between two cell types and their ligand-receptor pairs for different disease states |
| Ligand | Receptor | LRpair | Pathway | Tissue | Disease Stage |
| Page: 1 |
Top |
Single-cell gene regulatory network inference analysis |
| Find out the significant the regulons (TFs) and the target genes of each regulon across cell types for different disease states |
| TF | Cell Type | Tissue | Disease Stage | Target Gene | RSS | Regulon Activity |
| ∗The dot plots of a searched regulon are shown for all cell subpopulations in each disease state of each tissue based on the regulon specific score inferred using pySCENIC and by calculating the average expression. |
| Page: 1 |
Top |
Somatic mutation of malignant transformation related genes |
| Annotation of somatic variants for genes involved in malignant transformation |
| Hugo Symbol | Variant Class | Variant Classification | dbSNP RS | HGVSc | HGVSp | HGVSp Short | SWISSPROT | BIOTYPE | SIFT | PolyPhen | Tumor Sample Barcode | Tissue | Histology | Sex | Age | Stage | Therapy Types | Drugs | Outcome |
| ZDHHC8 | SNV | Missense_Mutation | c.997N>G | p.Pro333Ala | p.P333A | Q9ULC8 | protein_coding | tolerated(0.54) | benign(0.026) | TCGA-OL-A5RW-01 | Breast | breast invasive carcinoma | Female | <65 | I/II | Chemotherapy | adriamycin | CR | |
| ZDHHC8 | deletion | Frame_Shift_Del | novel | c.642delG | p.Arg215AlafsTer7 | p.R215Afs*7 | Q9ULC8 | protein_coding | TCGA-EW-A2FV-01 | Breast | breast invasive carcinoma | Female | <65 | III/IV | Chemotherapy | docetaxel | SD | ||
| ZDHHC8 | SNV | Missense_Mutation | rs771938147 | c.1001N>A | p.Arg334His | p.R334H | Q9ULC8 | protein_coding | tolerated(0.14) | possibly_damaging(0.862) | TCGA-2W-A8YY-01 | Cervix | cervical & endocervical cancer | Female | <65 | I/II | Chemotherapy | cisplatin | CR |
| ZDHHC8 | SNV | Missense_Mutation | novel | c.752G>A | p.Arg251Gln | p.R251Q | Q9ULC8 | protein_coding | deleterious(0) | probably_damaging(0.991) | TCGA-EA-A410-01 | Cervix | cervical & endocervical cancer | Female | <65 | I/II | Unknown | Unknown | SD |
| ZDHHC8 | SNV | Missense_Mutation | c.526N>A | p.Glu176Lys | p.E176K | Q9ULC8 | protein_coding | tolerated(0.07) | benign(0.219) | TCGA-IR-A3LI-01 | Cervix | cervical & endocervical cancer | Female | <65 | I/II | Chemotherapy | cisplatin | CR | |
| ZDHHC8 | SNV | Missense_Mutation | c.1035N>C | p.Gln345His | p.Q345H | Q9ULC8 | protein_coding | tolerated(0.07) | possibly_damaging(0.796) | TCGA-IR-A3LK-01 | Cervix | cervical & endocervical cancer | Female | >=65 | I/II | Chemotherapy | cisplatin | PD | |
| ZDHHC8 | SNV | Missense_Mutation | rs199762958 | c.2105N>T | p.Pro702Leu | p.P702L | Q9ULC8 | protein_coding | deleterious_low_confidence(0.02) | benign(0.026) | TCGA-VS-A8QA-01 | Cervix | cervical & endocervical cancer | Female | <65 | I/II | Unknown | Unknown | SD |
| ZDHHC8 | SNV | Missense_Mutation | novel | c.1552C>T | p.Pro518Ser | p.P518S | Q9ULC8 | protein_coding | tolerated(0.26) | benign(0.013) | TCGA-A6-6653-01 | Colorectum | colon adenocarcinoma | Male | >=65 | I/II | Unknown | Unknown | SD |
| ZDHHC8 | SNV | Missense_Mutation | rs372406851 | c.1354C>T | p.Arg452Cys | p.R452C | Q9ULC8 | protein_coding | deleterious(0.05) | possibly_damaging(0.84) | TCGA-A6-6654-01 | Colorectum | colon adenocarcinoma | Female | >=65 | III/IV | Chemotherapy | oxaliplatin | SD |
| ZDHHC8 | SNV | Missense_Mutation | rs140830467 | c.1460N>T | p.Ser487Leu | p.S487L | Q9ULC8 | protein_coding | deleterious(0.02) | probably_damaging(0.983) | TCGA-AD-6895-01 | Colorectum | colon adenocarcinoma | Male | >=65 | III/IV | Unknown | Unknown | SD |
| Page: 1 2 3 4 5 6 7 |
Top |
Related drugs of malignant transformation related genes |
| Identification of chemicals and drugs interact with genes involved in malignant transfromation |
| (DGIdb 4.0) |
| Entrez ID | Symbol | Category | Interaction Types | Drug Claim Name | Drug Name | PMIDs |
| Page: 1 |

Copyright 2023-Present -The University of Texas Health Science Center at Houston |