
|
|||||
|
 | |
| |
| |
| |
| |
| |
|
Gene: YWHAG |
Gene summary for YWHAG |
| Gene information | Species | Human | Gene symbol | YWHAG | Gene ID | 7532 |
| Gene name | tyrosine 3-monooxygenase/tryptophan 5-monooxygenase activation protein gamma | |
| Gene Alias | 14-3-3GAMMA | |
| Cytomap | 7q11.23 | |
| Gene Type | protein-coding | GO ID | GO:0001932 | UniProtAcc | P61981 |
Top |
Malignant transformation analysis |
| Identification of the aberrant gene expression in precancerous and cancerous lesions by comparing the gene expression of stem-like cells in diseased tissues with normal stem cells |
| Entrez ID | Symbol | Replicates | Species | Organ | Tissue | Adj P-value | Log2FC | Malignancy |
| 7532 | YWHAG | LZE4T | Human | Esophagus | ESCC | 6.84e-03 | 5.28e-01 | 0.0811 |
| 7532 | YWHAG | LZE8T | Human | Esophagus | ESCC | 1.61e-08 | 9.01e-02 | 0.067 |
| 7532 | YWHAG | LZE20T | Human | Esophagus | ESCC | 7.76e-14 | -1.15e-02 | 0.0662 |
| 7532 | YWHAG | LZE24T | Human | Esophagus | ESCC | 1.99e-03 | 5.73e-01 | 0.0596 |
| 7532 | YWHAG | P2T-E | Human | Esophagus | ESCC | 1.53e-12 | 2.96e-01 | 0.1177 |
| 7532 | YWHAG | P4T-E | Human | Esophagus | ESCC | 8.56e-18 | 8.05e-01 | 0.1323 |
| 7532 | YWHAG | P5T-E | Human | Esophagus | ESCC | 3.55e-17 | 6.42e-01 | 0.1327 |
| 7532 | YWHAG | P8T-E | Human | Esophagus | ESCC | 2.49e-04 | 6.03e-03 | 0.0889 |
| 7532 | YWHAG | P9T-E | Human | Esophagus | ESCC | 2.45e-14 | 4.22e-01 | 0.1131 |
| 7532 | YWHAG | P10T-E | Human | Esophagus | ESCC | 3.15e-17 | 6.41e-01 | 0.116 |
| 7532 | YWHAG | P11T-E | Human | Esophagus | ESCC | 1.70e-07 | 1.04e+00 | 0.1426 |
| 7532 | YWHAG | P12T-E | Human | Esophagus | ESCC | 2.10e-32 | 1.11e+00 | 0.1122 |
| 7532 | YWHAG | P15T-E | Human | Esophagus | ESCC | 1.20e-18 | 9.37e-01 | 0.1149 |
| 7532 | YWHAG | P16T-E | Human | Esophagus | ESCC | 7.48e-43 | 1.71e+00 | 0.1153 |
| 7532 | YWHAG | P19T-E | Human | Esophagus | ESCC | 7.87e-05 | 1.17e+00 | 0.1662 |
| 7532 | YWHAG | P20T-E | Human | Esophagus | ESCC | 3.67e-12 | 8.10e-01 | 0.1124 |
| 7532 | YWHAG | P21T-E | Human | Esophagus | ESCC | 8.93e-23 | 1.03e+00 | 0.1617 |
| 7532 | YWHAG | P22T-E | Human | Esophagus | ESCC | 3.39e-13 | 4.94e-01 | 0.1236 |
| 7532 | YWHAG | P23T-E | Human | Esophagus | ESCC | 3.62e-11 | 6.94e-01 | 0.108 |
| 7532 | YWHAG | P24T-E | Human | Esophagus | ESCC | 5.71e-07 | 5.33e-01 | 0.1287 |
| Page: 1 2 3 4 5 6 7 |
| Tissue | Expression Dynamics | Abbreviation |
| Esophagus |  | ESCC: Esophageal squamous cell carcinoma |
| HGIN: High-grade intraepithelial neoplasias | ||
| LGIN: Low-grade intraepithelial neoplasias | ||
| Liver | 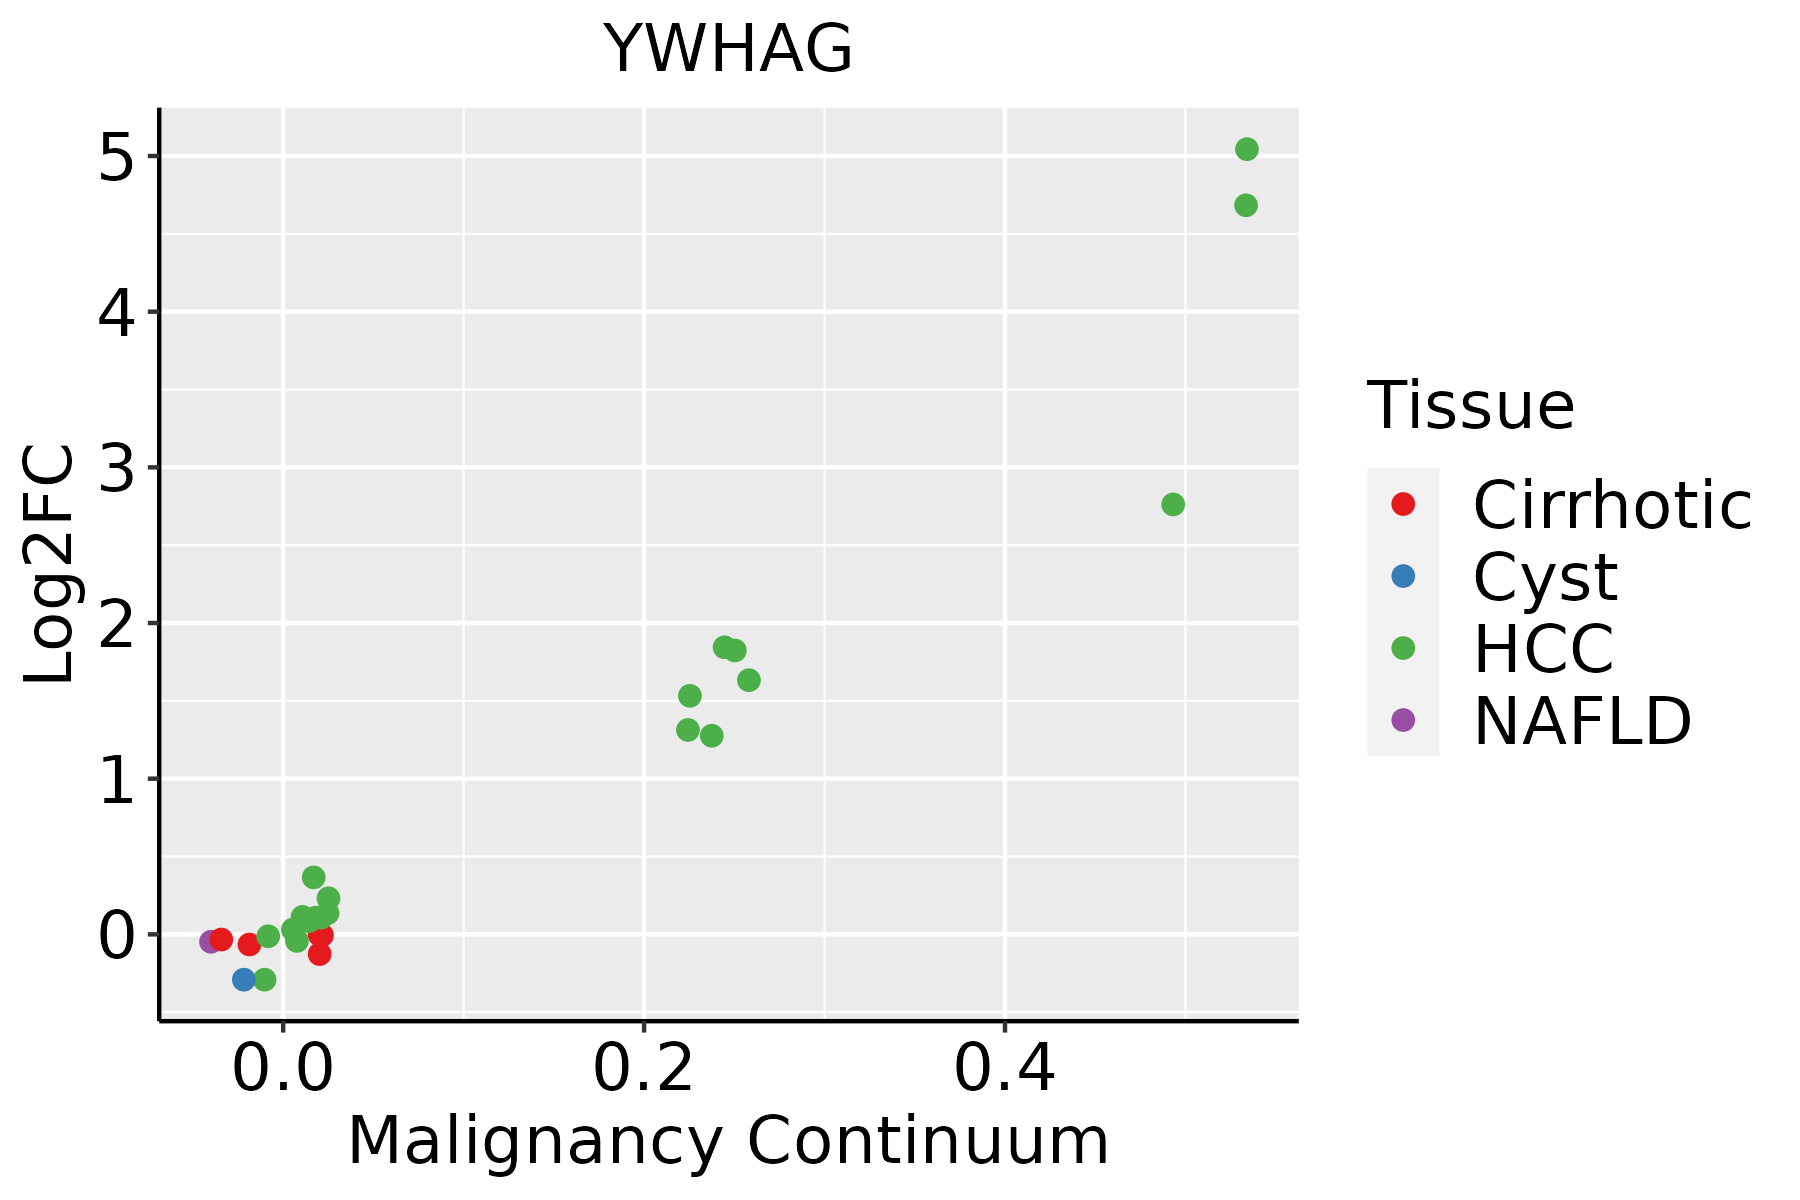 | HCC: Hepatocellular carcinoma |
| NAFLD: Non-alcoholic fatty liver disease | ||
| Lung | 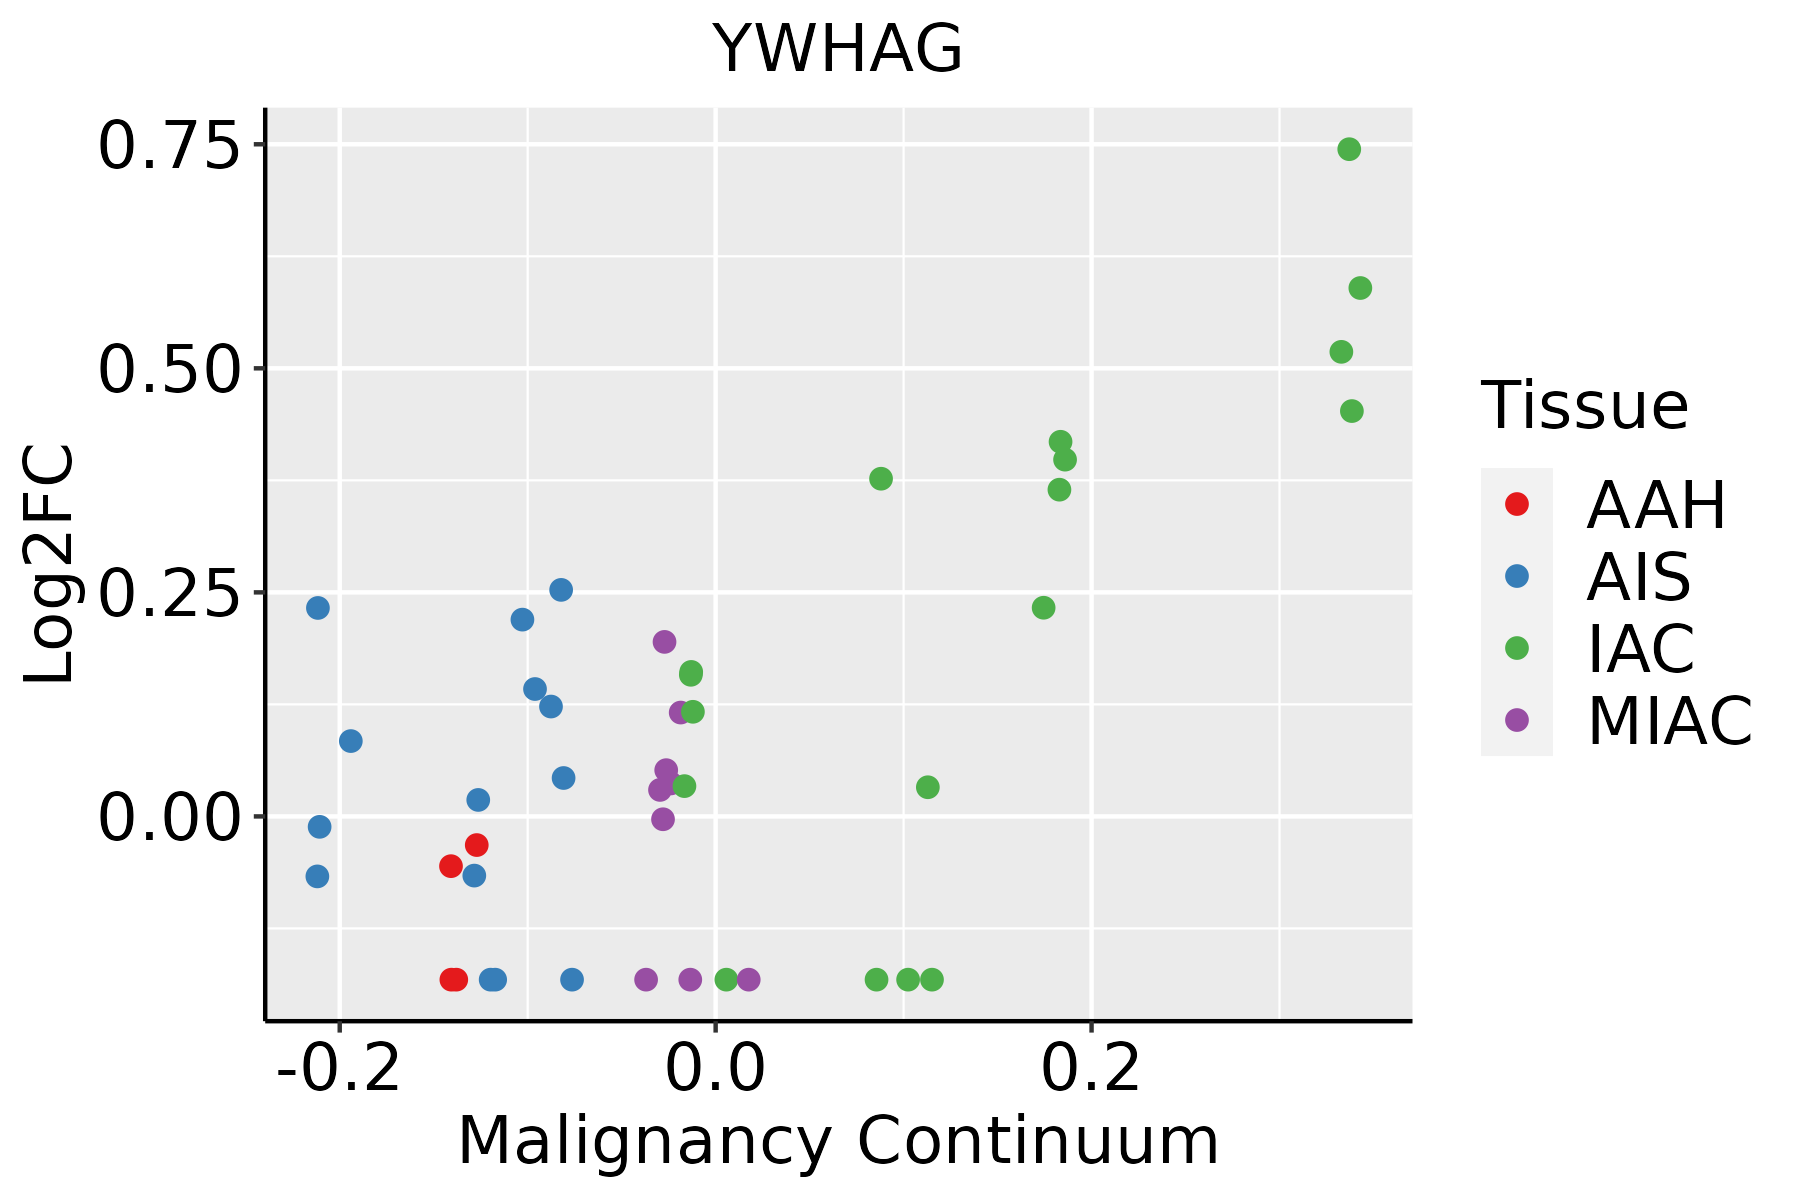 | AAH: Atypical adenomatous hyperplasia |
| AIS: Adenocarcinoma in situ | ||
| IAC: Invasive lung adenocarcinoma | ||
| MIA: Minimally invasive adenocarcinoma | ||
| Oral Cavity |  | EOLP: Erosive Oral lichen planus |
| LP: leukoplakia | ||
| NEOLP: Non-erosive oral lichen planus | ||
| OSCC: Oral squamous cell carcinoma | ||
| Prostate | 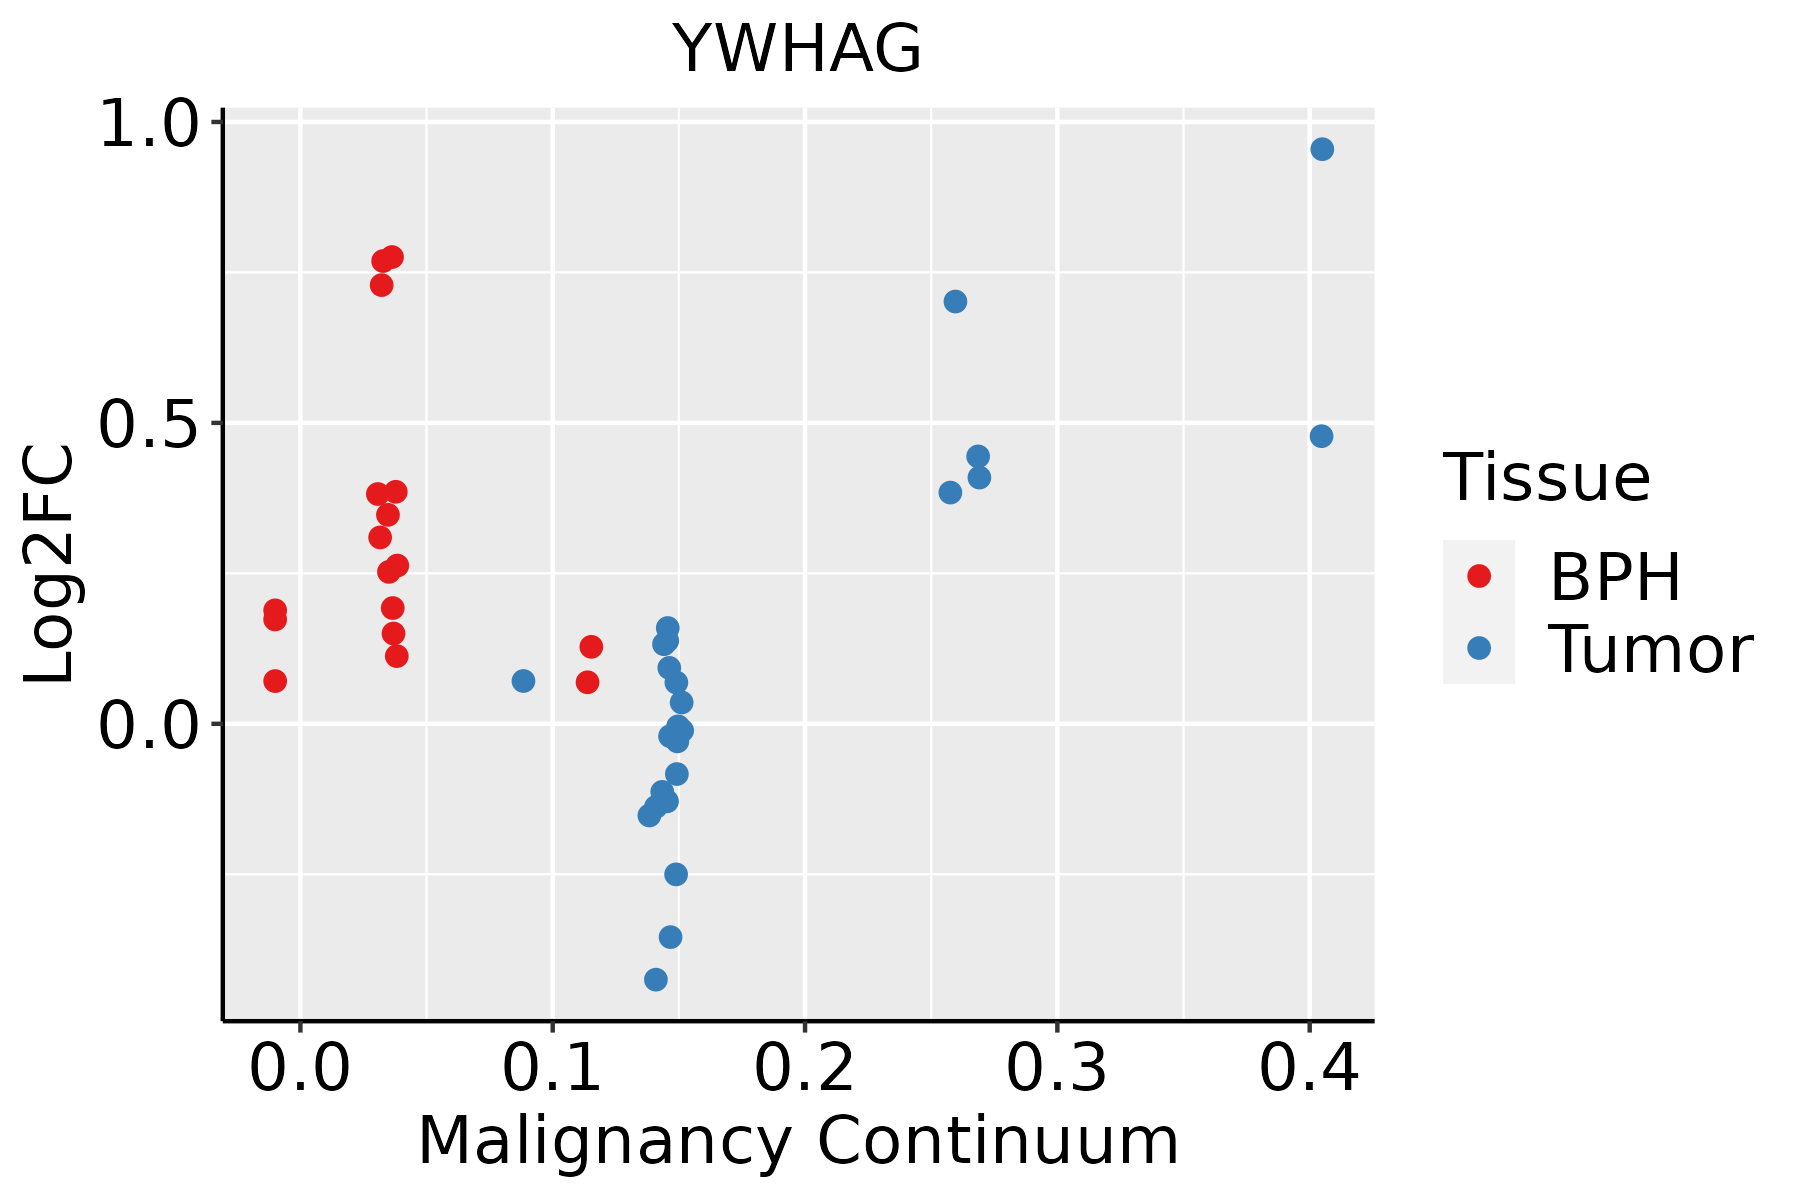 | BPH: Benign Prostatic Hyperplasia |
| Skin | 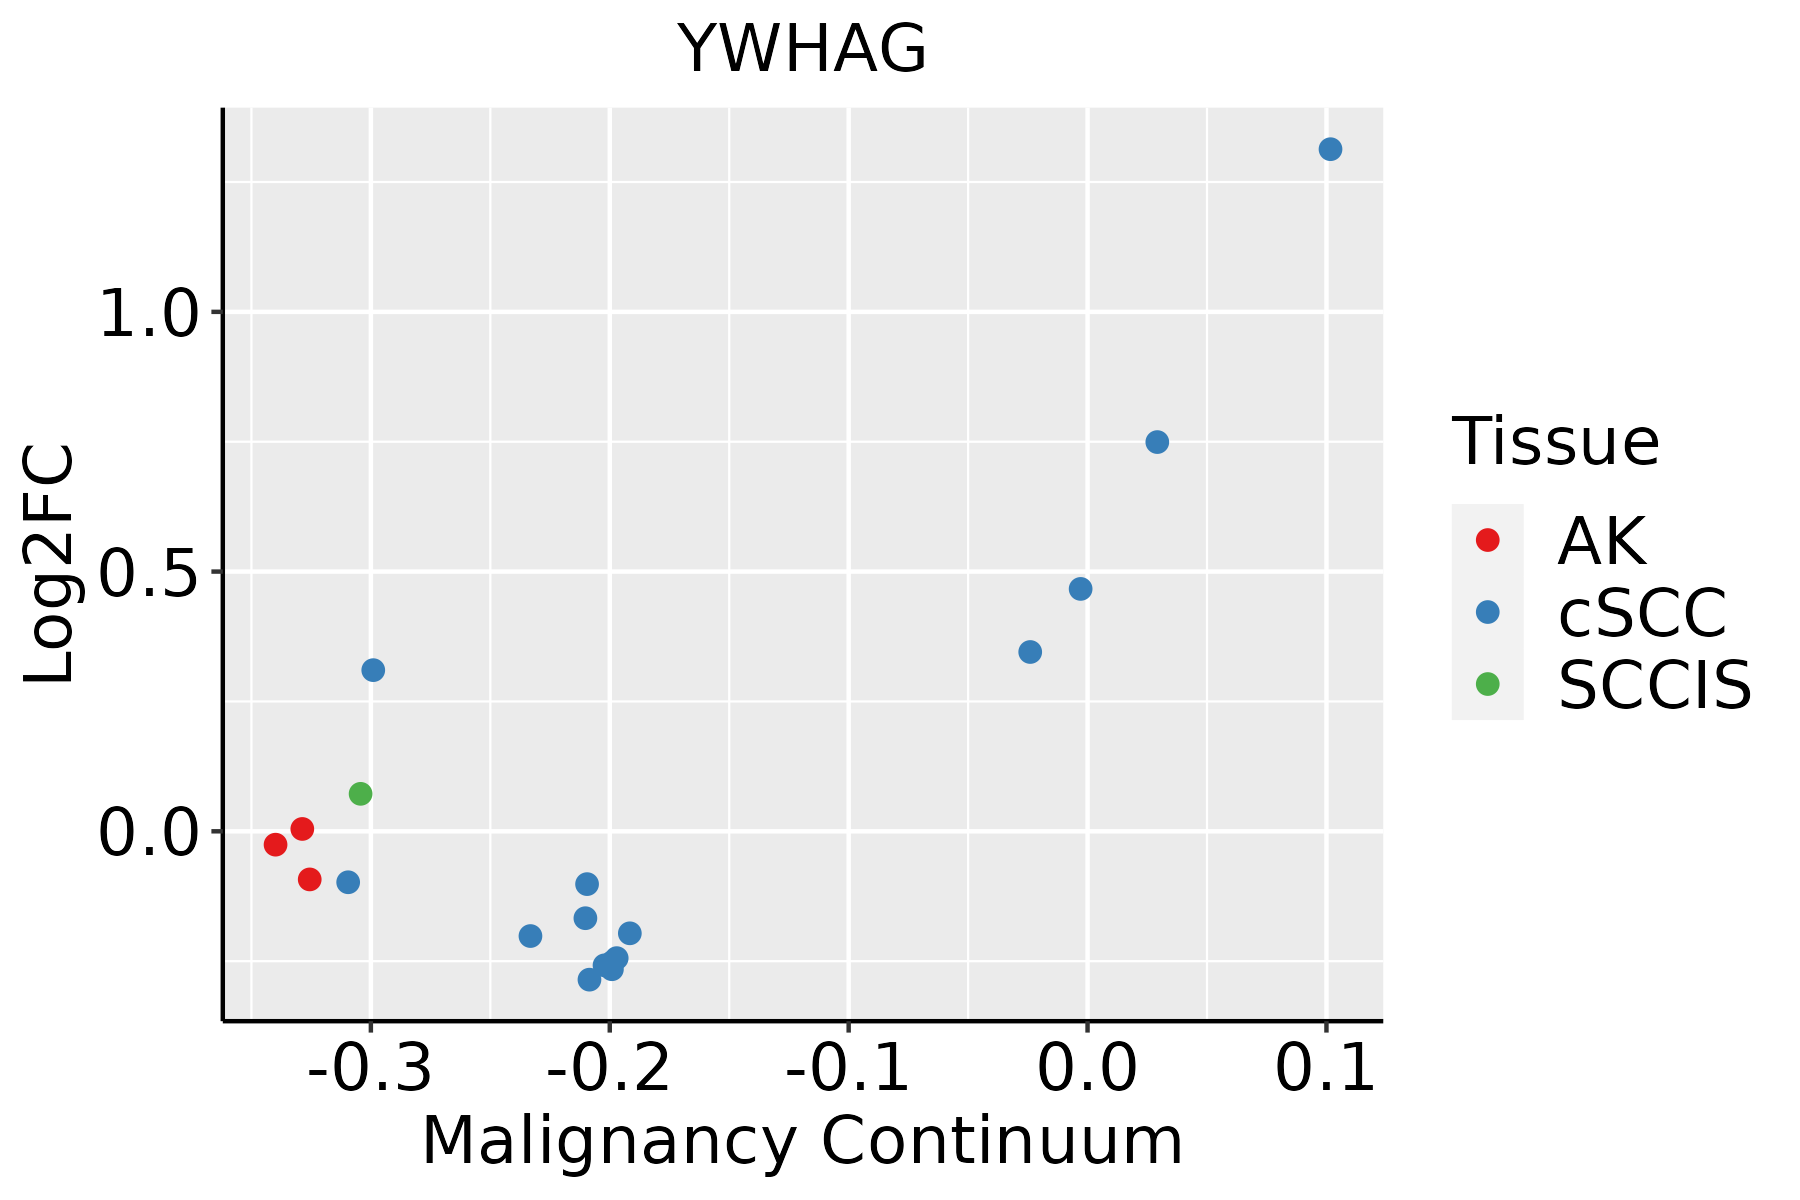 | AK: Actinic keratosis |
| cSCC: Cutaneous squamous cell carcinoma | ||
| SCCIS:squamous cell carcinoma in situ | ||
| Thyroid |  | ATC: Anaplastic thyroid cancer |
| HT: Hashimoto's thyroiditis | ||
| PTC: Papillary thyroid cancer |
| ∗log2FC in expression of this searched gene in stem-like cells from each diseased tissue sample relative to stem-like cells in normal samples in each tissue plotted against the malignancy continuum. Samples are colored based on if they are from different disease stage. |
Top |
Malignant transformation related pathway analysis |
| Find out the enriched GO biological processes and KEGG pathways involved in transition from healthy to precancer to cancer |
| Tissue | Disease Stage | Enriched GO biological Processes |
| Colorectum | AD |  |
| Colorectum | SER |  |
| Colorectum | MSS |  |
| Colorectum | MSI-H |  |
| Colorectum | FAP |  |
| ∗Top 15 enriched GO BP terms are showed in the bar plot of each disease state in each tissue. Each row represents a significant GO biological process which is colored according to the -log10(p.adjust). |
| Page: 1 2 3 4 5 6 7 8 9 |
| GO ID | Tissue | Disease Stage | Description | Gene Ratio | Bg Ratio | pvalue | p.adjust | Count |
| GO:004232612 | Liver | Cirrhotic | negative regulation of phosphorylation | 135/4634 | 385/18723 | 3.17e-06 | 5.58e-05 | 135 |
| GO:003286811 | Liver | Cirrhotic | response to insulin | 95/4634 | 264/18723 | 2.77e-05 | 3.54e-04 | 95 |
| GO:000193312 | Liver | Cirrhotic | negative regulation of protein phosphorylation | 117/4634 | 342/18723 | 4.84e-05 | 5.59e-04 | 117 |
| GO:005134812 | Liver | Cirrhotic | negative regulation of transferase activity | 93/4634 | 268/18723 | 1.55e-04 | 1.47e-03 | 93 |
| GO:003367312 | Liver | Cirrhotic | negative regulation of kinase activity | 78/4634 | 237/18723 | 2.73e-03 | 1.59e-02 | 78 |
| GO:00064697 | Liver | Cirrhotic | negative regulation of protein kinase activity | 68/4634 | 212/18723 | 9.35e-03 | 4.29e-02 | 68 |
| GO:000660512 | Liver | HCC | protein targeting | 219/7958 | 314/18723 | 7.74e-23 | 1.49e-20 | 219 |
| GO:003286821 | Liver | HCC | response to insulin | 172/7958 | 264/18723 | 7.14e-14 | 4.23e-12 | 172 |
| GO:003286921 | Liver | HCC | cellular response to insulin stimulus | 137/7958 | 203/18723 | 4.69e-13 | 2.44e-11 | 137 |
| GO:004343422 | Liver | HCC | response to peptide hormone | 247/7958 | 414/18723 | 9.55e-13 | 4.77e-11 | 247 |
| GO:001056322 | Liver | HCC | negative regulation of phosphorus metabolic process | 259/7958 | 442/18723 | 4.29e-12 | 1.92e-10 | 259 |
| GO:004593622 | Liver | HCC | negative regulation of phosphate metabolic process | 258/7958 | 441/18723 | 6.00e-12 | 2.60e-10 | 258 |
| GO:007137521 | Liver | HCC | cellular response to peptide hormone stimulus | 179/7958 | 290/18723 | 2.54e-11 | 9.88e-10 | 179 |
| GO:004232622 | Liver | HCC | negative regulation of phosphorylation | 227/7958 | 385/18723 | 3.98e-11 | 1.52e-09 | 227 |
| GO:005134822 | Liver | HCC | negative regulation of transferase activity | 166/7958 | 268/18723 | 8.97e-11 | 3.18e-09 | 166 |
| GO:190165321 | Liver | HCC | cellular response to peptide | 211/7958 | 359/18723 | 2.86e-10 | 9.63e-09 | 211 |
| GO:003367322 | Liver | HCC | negative regulation of kinase activity | 144/7958 | 237/18723 | 9.76e-09 | 2.45e-07 | 144 |
| GO:000193322 | Liver | HCC | negative regulation of protein phosphorylation | 196/7958 | 342/18723 | 1.95e-08 | 4.63e-07 | 196 |
| GO:000646912 | Liver | HCC | negative regulation of protein kinase activity | 126/7958 | 212/18723 | 4.55e-07 | 7.49e-06 | 126 |
| GO:00459368 | Lung | IAC | negative regulation of phosphate metabolic process | 87/2061 | 441/18723 | 4.00e-08 | 4.57e-06 | 87 |
| Page: 1 2 3 4 5 6 7 8 9 10 |
| Pathway ID | Tissue | Disease Stage | Description | Gene Ratio | Bg Ratio | pvalue | p.adjust | qvalue | Count |
| hsa0411023 | Esophagus | ESCC | Cell cycle | 126/4205 | 157/8465 | 1.34e-15 | 5.60e-14 | 2.87e-14 | 126 |
| hsa0520325 | Esophagus | ESCC | Viral carcinogenesis | 137/4205 | 204/8465 | 2.47e-07 | 1.88e-06 | 9.62e-07 | 137 |
| hsa051609 | Esophagus | ESCC | Hepatitis C | 107/4205 | 157/8465 | 1.75e-06 | 1.08e-05 | 5.55e-06 | 107 |
| hsa041517 | Esophagus | ESCC | PI3K-Akt signaling pathway | 197/4205 | 354/8465 | 1.24e-02 | 2.83e-02 | 1.45e-02 | 197 |
| hsa0439018 | Esophagus | ESCC | Hippo signaling pathway | 92/4205 | 157/8465 | 1.46e-02 | 3.31e-02 | 1.69e-02 | 92 |
| hsa041146 | Esophagus | ESCC | Oocyte meiosis | 77/4205 | 131/8465 | 2.19e-02 | 4.80e-02 | 2.46e-02 | 77 |
| hsa0411033 | Esophagus | ESCC | Cell cycle | 126/4205 | 157/8465 | 1.34e-15 | 5.60e-14 | 2.87e-14 | 126 |
| hsa0520335 | Esophagus | ESCC | Viral carcinogenesis | 137/4205 | 204/8465 | 2.47e-07 | 1.88e-06 | 9.62e-07 | 137 |
| hsa0516016 | Esophagus | ESCC | Hepatitis C | 107/4205 | 157/8465 | 1.75e-06 | 1.08e-05 | 5.55e-06 | 107 |
| hsa0415114 | Esophagus | ESCC | PI3K-Akt signaling pathway | 197/4205 | 354/8465 | 1.24e-02 | 2.83e-02 | 1.45e-02 | 197 |
| hsa0439019 | Esophagus | ESCC | Hippo signaling pathway | 92/4205 | 157/8465 | 1.46e-02 | 3.31e-02 | 1.69e-02 | 92 |
| hsa0411411 | Esophagus | ESCC | Oocyte meiosis | 77/4205 | 131/8465 | 2.19e-02 | 4.80e-02 | 2.46e-02 | 77 |
| hsa051605 | Liver | Cirrhotic | Hepatitis C | 63/2530 | 157/8465 | 3.67e-03 | 1.49e-02 | 9.20e-03 | 63 |
| hsa041104 | Liver | Cirrhotic | Cell cycle | 61/2530 | 157/8465 | 9.53e-03 | 3.21e-02 | 1.98e-02 | 61 |
| hsa05203 | Liver | Cirrhotic | Viral carcinogenesis | 76/2530 | 204/8465 | 1.34e-02 | 4.20e-02 | 2.59e-02 | 76 |
| hsa0516012 | Liver | Cirrhotic | Hepatitis C | 63/2530 | 157/8465 | 3.67e-03 | 1.49e-02 | 9.20e-03 | 63 |
| hsa0411011 | Liver | Cirrhotic | Cell cycle | 61/2530 | 157/8465 | 9.53e-03 | 3.21e-02 | 1.98e-02 | 61 |
| hsa052031 | Liver | Cirrhotic | Viral carcinogenesis | 76/2530 | 204/8465 | 1.34e-02 | 4.20e-02 | 2.59e-02 | 76 |
| hsa041102 | Liver | HCC | Cell cycle | 106/4020 | 157/8465 | 2.54e-07 | 3.04e-06 | 1.69e-06 | 106 |
| hsa0516021 | Liver | HCC | Hepatitis C | 94/4020 | 157/8465 | 1.11e-03 | 4.10e-03 | 2.28e-03 | 94 |
| Page: 1 2 3 4 5 |
Top |
Cell-cell communication analysis |
| Identification of potential cell-cell interactions between two cell types and their ligand-receptor pairs for different disease states |
| Ligand | Receptor | LRpair | Pathway | Tissue | Disease Stage |
| Page: 1 |
Top |
Single-cell gene regulatory network inference analysis |
| Find out the significant the regulons (TFs) and the target genes of each regulon across cell types for different disease states |
| TF | Cell Type | Tissue | Disease Stage | Target Gene | RSS | Regulon Activity |
| ∗The dot plots of a searched regulon are shown for all cell subpopulations in each disease state of each tissue based on the regulon specific score inferred using pySCENIC and by calculating the average expression. |
| Page: 1 |
Top |
Somatic mutation of malignant transformation related genes |
| Annotation of somatic variants for genes involved in malignant transformation |
| Hugo Symbol | Variant Class | Variant Classification | dbSNP RS | HGVSc | HGVSp | HGVSp Short | SWISSPROT | BIOTYPE | SIFT | PolyPhen | Tumor Sample Barcode | Tissue | Histology | Sex | Age | Stage | Therapy Types | Drugs | Outcome |
| YWHAG | SNV | Missense_Mutation | novel | c.268G>C | p.Glu90Gln | p.E90Q | P61981 | protein_coding | deleterious_low_confidence(0) | probably_damaging(0.957) | TCGA-E2-A14V-01 | Breast | breast invasive carcinoma | Female | <65 | I/II | Chemotherapy | cyclophosphamide | SD |
| YWHAG | SNV | Missense_Mutation | c.137N>G | p.Ser46Cys | p.S46C | P61981 | protein_coding | deleterious_low_confidence(0) | probably_damaging(0.999) | TCGA-E9-A1N4-01 | Breast | breast invasive carcinoma | Female | <65 | III/IV | Chemotherapy | doxorubicin | SD | |
| YWHAG | insertion | In_Frame_Ins | novel | c.598_599insAAAACTTAAAGAGGAATGGCCCTCATTCAGTAAGTT | p.Ala200delinsGluAsnLeuLysArgAsnGlyProHisSerValSerSer | p.A200delinsENLKRNGPHSVSS | P61981 | protein_coding | TCGA-A2-A0CU-01 | Breast | breast invasive carcinoma | Female | >=65 | I/II | Hormone Therapy | tamoxiphen | SD | ||
| YWHAG | SNV | Missense_Mutation | c.212N>A | p.Ser71Tyr | p.S71Y | P61981 | protein_coding | deleterious_low_confidence(0) | benign(0.188) | TCGA-A6-2686-01 | Colorectum | colon adenocarcinoma | Female | >=65 | I/II | Unknown | Unknown | SD | |
| YWHAG | SNV | Missense_Mutation | c.330N>T | p.Lys110Asn | p.K110N | P61981 | protein_coding | deleterious_low_confidence(0.01) | benign(0.043) | TCGA-CA-6718-01 | Colorectum | colon adenocarcinoma | Male | <65 | I/II | Unknown | Unknown | PD | |
| YWHAG | SNV | Missense_Mutation | novel | c.700N>G | p.Thr234Ala | p.T234A | P61981 | protein_coding | deleterious_low_confidence(0.03) | probably_damaging(0.975) | TCGA-AJ-A3EK-01 | Endometrium | uterine corpus endometrioid carcinoma | Female | <65 | I/II | Chemotherapy | carboplatin | CR |
| YWHAG | SNV | Missense_Mutation | novel | c.220N>A | p.Gly74Ser | p.G74S | P61981 | protein_coding | tolerated_low_confidence(0.07) | probably_damaging(0.999) | TCGA-AJ-A3OK-01 | Endometrium | uterine corpus endometrioid carcinoma | Female | >=65 | I/II | Chemotherapy | carboplatin | CR |
| YWHAG | SNV | Missense_Mutation | novel | c.481N>G | p.Ser161Gly | p.S161G | P61981 | protein_coding | deleterious_low_confidence(0.02) | probably_damaging(0.991) | TCGA-AP-A1DK-01 | Endometrium | uterine corpus endometrioid carcinoma | Female | <65 | I/II | Unknown | Unknown | SD |
| YWHAG | SNV | Missense_Mutation | novel | c.489N>T | p.Glu163Asp | p.E163D | P61981 | protein_coding | tolerated_low_confidence(0.29) | benign(0.114) | TCGA-AX-A1CE-01 | Endometrium | uterine corpus endometrioid carcinoma | Female | <65 | I/II | Unspecific | Paclitaxel | SD |
| YWHAG | SNV | Missense_Mutation | c.340G>A | p.Glu114Lys | p.E114K | P61981 | protein_coding | tolerated_low_confidence(0.28) | benign(0.001) | TCGA-AX-A2HC-01 | Endometrium | uterine corpus endometrioid carcinoma | Female | <65 | III/IV | Chemotherapy | paclitaxel | PD |
| Page: 1 2 |
Top |
Related drugs of malignant transformation related genes |
| Identification of chemicals and drugs interact with genes involved in malignant transfromation |
| (DGIdb 4.0) |
| Entrez ID | Symbol | Category | Interaction Types | Drug Claim Name | Drug Name | PMIDs |
| 7532 | YWHAG | DRUGGABLE GENOME, KINASE | DAUNORUBICIN HYDROCHLORIDE | DAUNORUBICIN HYDROCHLORIDE | ||
| 7532 | YWHAG | DRUGGABLE GENOME, KINASE | DOXORUBICIN HYDROCHLORIDE | DOXORUBICIN HYDROCHLORIDE |
| Page: 1 |

Copyright 2023-Present -The University of Texas Health Science Center at Houston |