
|
|||||
|
 | |
| |
| |
| |
| |
| |
|
Gene: XPO5 |
Gene summary for XPO5 |
| Gene information | Species | Human | Gene symbol | XPO5 | Gene ID | 57510 |
| Gene name | exportin 5 | |
| Gene Alias | exp5 | |
| Cytomap | 6p21.1 | |
| Gene Type | protein-coding | GO ID | GO:0006139 | UniProtAcc | Q9HAV4 |
Top |
Malignant transformation analysis |
| Identification of the aberrant gene expression in precancerous and cancerous lesions by comparing the gene expression of stem-like cells in diseased tissues with normal stem cells |
| Entrez ID | Symbol | Replicates | Species | Organ | Tissue | Adj P-value | Log2FC | Malignancy |
| 57510 | XPO5 | GSM6177620_NYU_UCEC1_lib1_lib1 | Human | Endometrium | EEC | 2.02e-05 | 1.19e-01 | -0.1869 |
| 57510 | XPO5 | GSM6177620_NYU_UCEC1_lib2_lib2 | Human | Endometrium | EEC | 9.29e-03 | 8.55e-02 | -0.1875 |
| 57510 | XPO5 | GSM6177620_NYU_UCEC1_lib3_lib3 | Human | Endometrium | EEC | 1.44e-07 | 8.19e-02 | -0.1883 |
| 57510 | XPO5 | GSM6177621_NYU_UCEC2_lib1_lib1 | Human | Endometrium | EEC | 1.65e-03 | 1.01e-01 | -0.1934 |
| 57510 | XPO5 | GSM6177622_NYU_UCEC3_lib1_lib1 | Human | Endometrium | EEC | 2.71e-06 | 1.62e-02 | -0.1917 |
| 57510 | XPO5 | GSM6177622_NYU_UCEC3_lib2_lib2 | Human | Endometrium | EEC | 9.48e-04 | 1.57e-02 | -0.1916 |
| 57510 | XPO5 | GSM6177623_NYU_UCEC3_Vis | Human | Endometrium | EEC | 2.14e-03 | 1.73e-01 | -0.1269 |
| 57510 | XPO5 | LZE2T | Human | Esophagus | ESCC | 5.33e-10 | 1.34e+00 | 0.082 |
| 57510 | XPO5 | LZE4T | Human | Esophagus | ESCC | 3.81e-02 | 1.24e-01 | 0.0811 |
| 57510 | XPO5 | LZE7T | Human | Esophagus | ESCC | 2.62e-03 | 2.70e-01 | 0.0667 |
| 57510 | XPO5 | LZE24T | Human | Esophagus | ESCC | 4.62e-11 | 1.84e-01 | 0.0596 |
| 57510 | XPO5 | P2T-E | Human | Esophagus | ESCC | 2.89e-14 | 2.29e-01 | 0.1177 |
| 57510 | XPO5 | P4T-E | Human | Esophagus | ESCC | 5.83e-08 | 2.50e-01 | 0.1323 |
| 57510 | XPO5 | P5T-E | Human | Esophagus | ESCC | 9.74e-11 | 2.28e-01 | 0.1327 |
| 57510 | XPO5 | P8T-E | Human | Esophagus | ESCC | 2.31e-05 | 7.60e-02 | 0.0889 |
| 57510 | XPO5 | P9T-E | Human | Esophagus | ESCC | 1.71e-05 | 1.80e-01 | 0.1131 |
| 57510 | XPO5 | P10T-E | Human | Esophagus | ESCC | 6.10e-06 | 1.98e-01 | 0.116 |
| 57510 | XPO5 | P11T-E | Human | Esophagus | ESCC | 8.44e-04 | 1.74e-01 | 0.1426 |
| 57510 | XPO5 | P12T-E | Human | Esophagus | ESCC | 3.10e-09 | 2.09e-01 | 0.1122 |
| 57510 | XPO5 | P15T-E | Human | Esophagus | ESCC | 1.56e-05 | 1.88e-01 | 0.1149 |
| Page: 1 2 3 4 5 |
| Tissue | Expression Dynamics | Abbreviation |
| Endometrium | 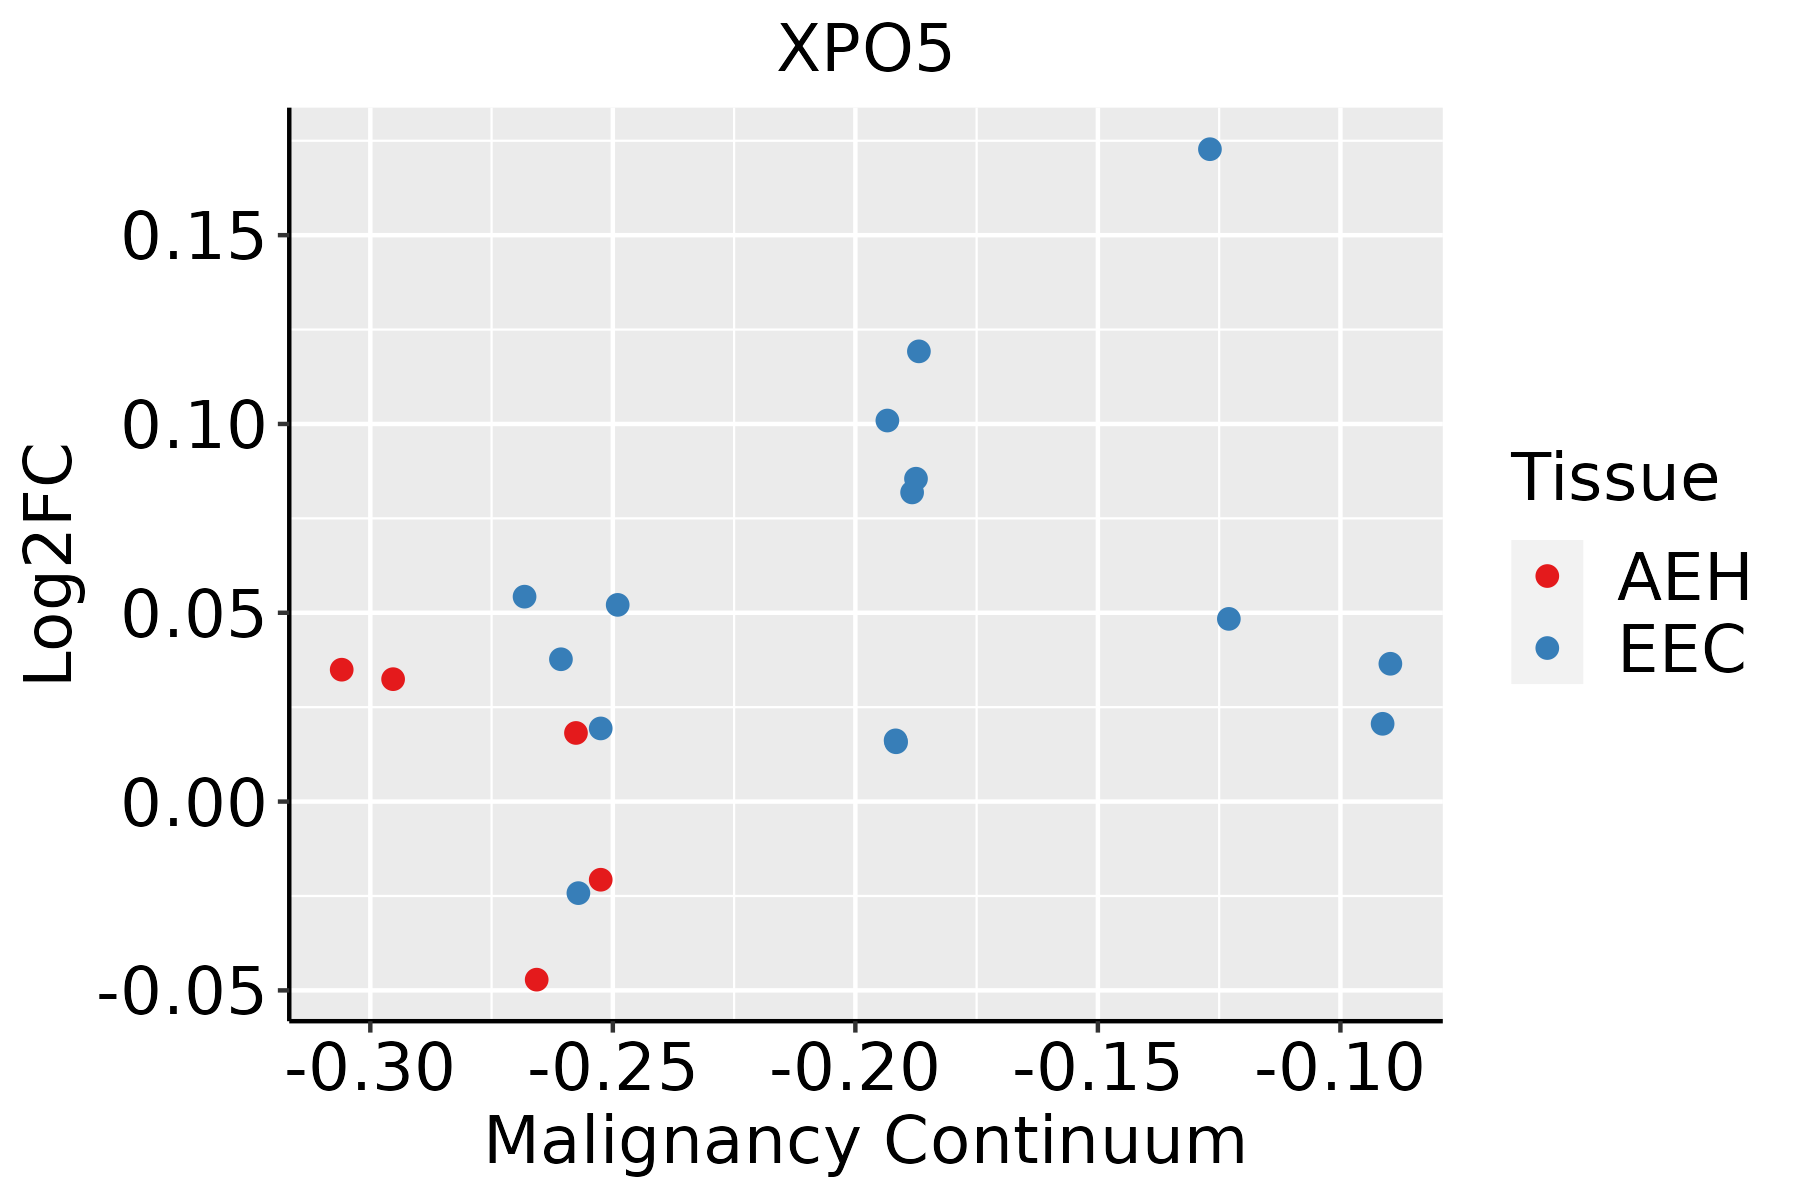 | AEH: Atypical endometrial hyperplasia |
| EEC: Endometrioid Cancer | ||
| Esophagus | 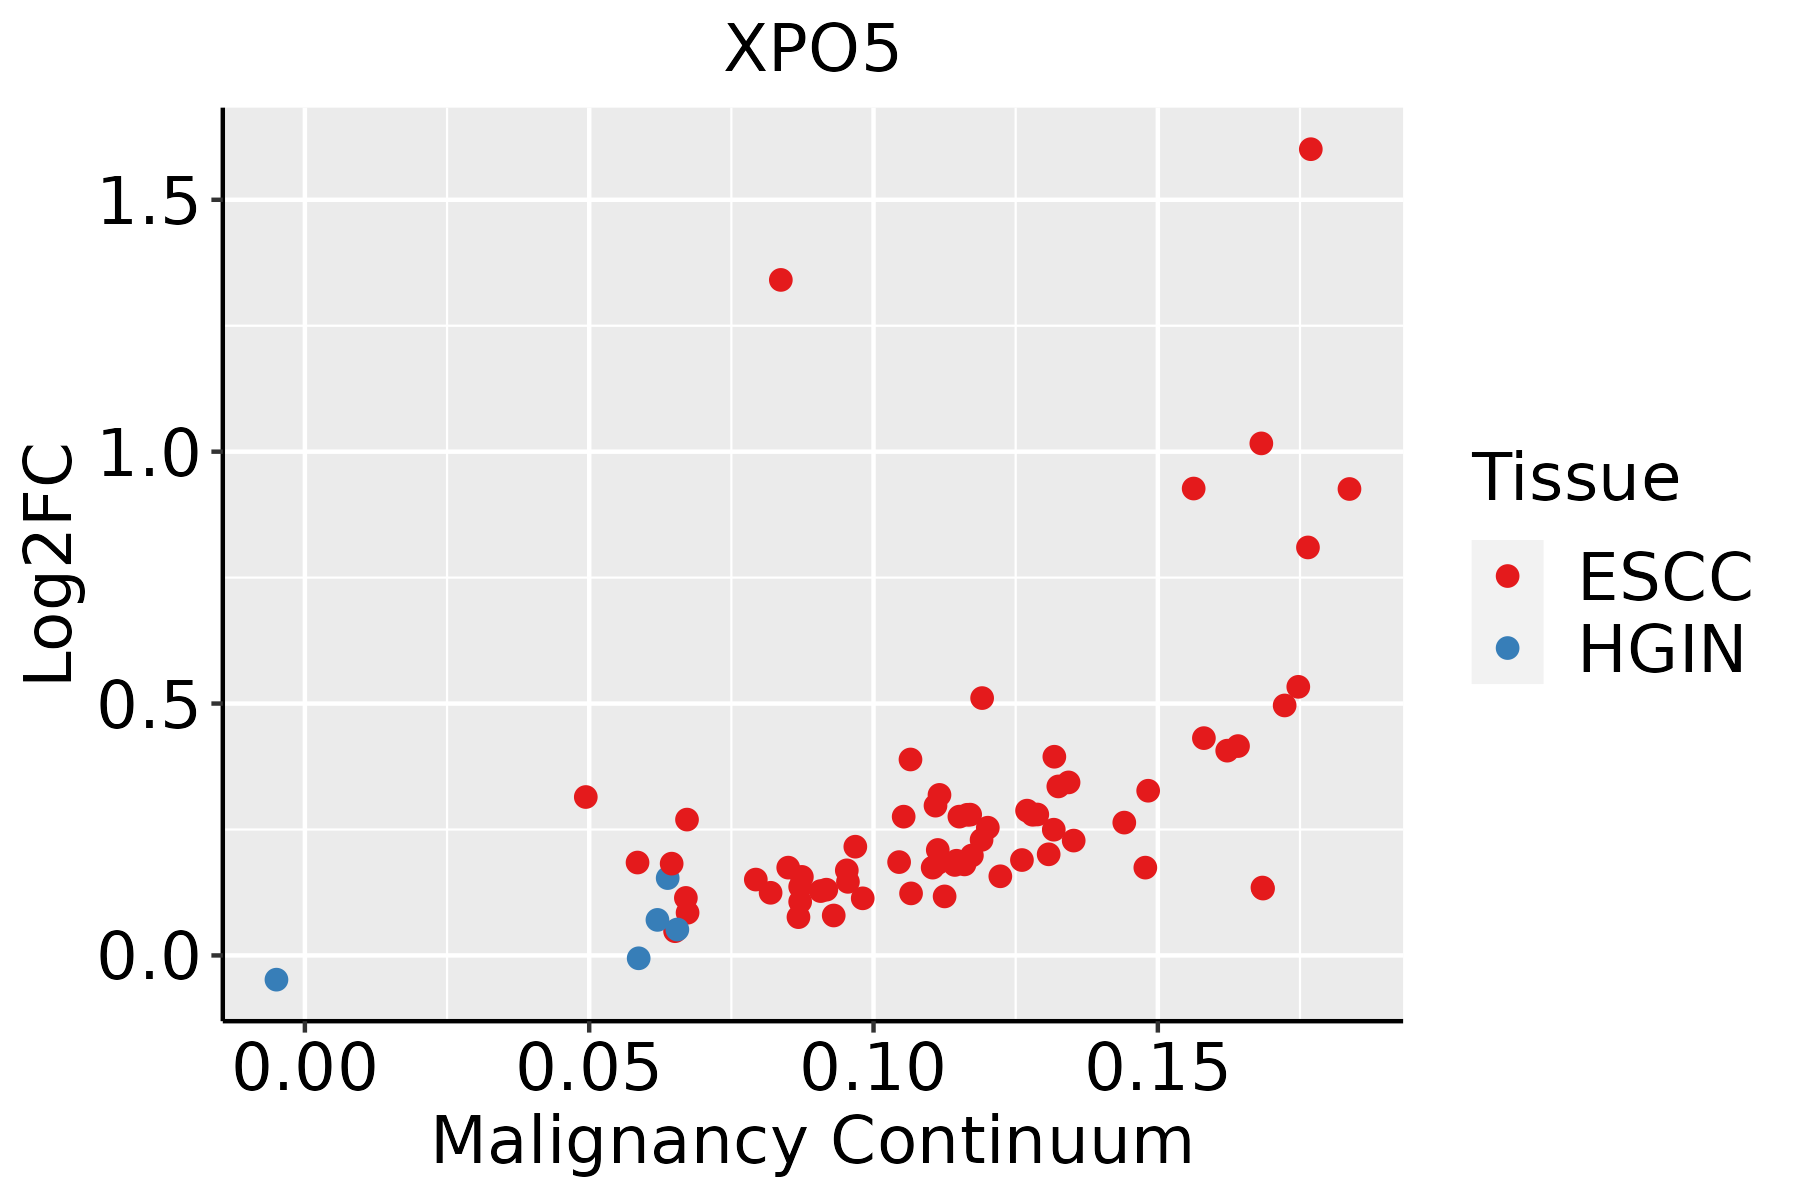 | ESCC: Esophageal squamous cell carcinoma |
| HGIN: High-grade intraepithelial neoplasias | ||
| LGIN: Low-grade intraepithelial neoplasias | ||
| Liver | 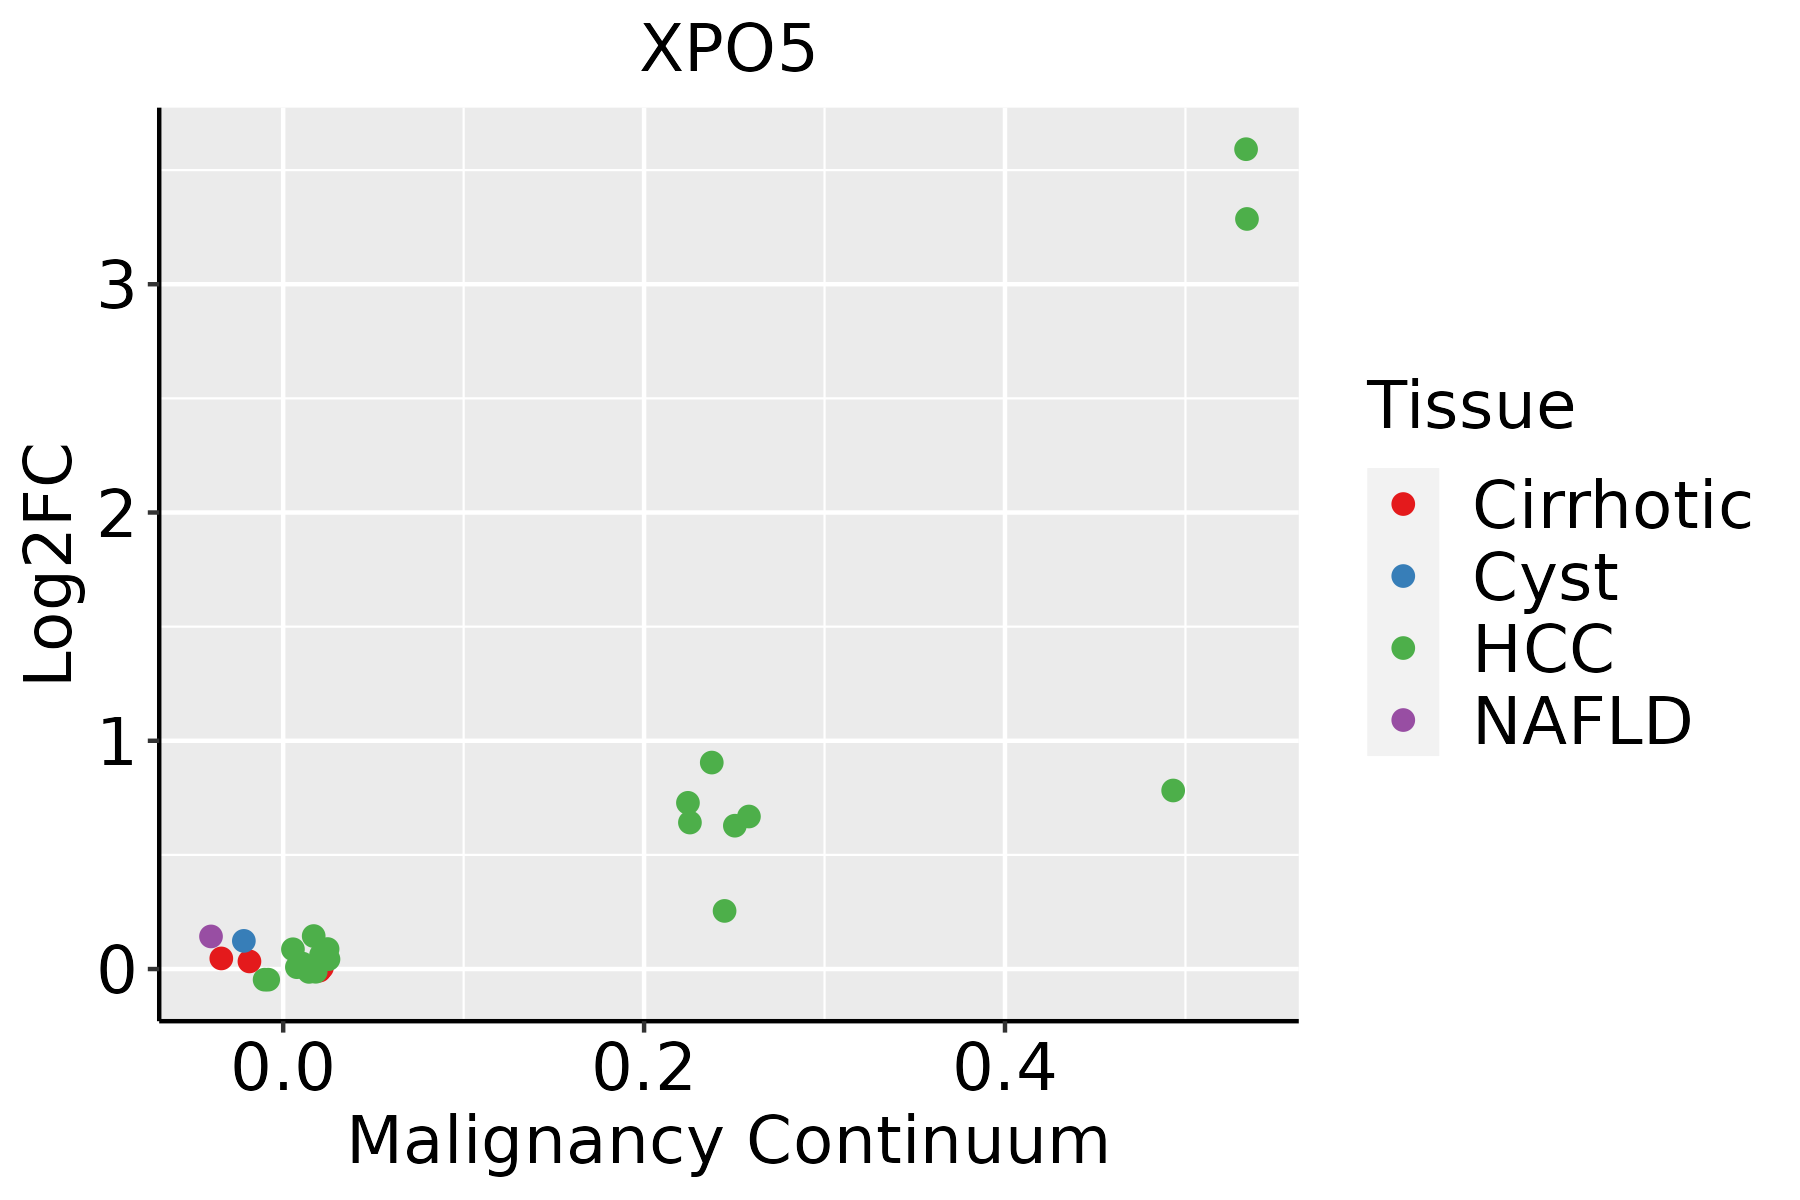 | HCC: Hepatocellular carcinoma |
| NAFLD: Non-alcoholic fatty liver disease | ||
| Thyroid |  | ATC: Anaplastic thyroid cancer |
| HT: Hashimoto's thyroiditis | ||
| PTC: Papillary thyroid cancer |
| ∗log2FC in expression of this searched gene in stem-like cells from each diseased tissue sample relative to stem-like cells in normal samples in each tissue plotted against the malignancy continuum. Samples are colored based on if they are from different disease stage. |
Top |
Malignant transformation related pathway analysis |
| Find out the enriched GO biological processes and KEGG pathways involved in transition from healthy to precancer to cancer |
| Tissue | Disease Stage | Enriched GO biological Processes |
| Colorectum | AD |  |
| Colorectum | SER |  |
| Colorectum | MSS |  |
| Colorectum | MSI-H |  |
| Colorectum | FAP |  |
| ∗Top 15 enriched GO BP terms are showed in the bar plot of each disease state in each tissue. Each row represents a significant GO biological process which is colored according to the -log10(p.adjust). |
| Page: 1 2 3 4 5 6 7 8 9 |
| GO ID | Tissue | Disease Stage | Description | Gene Ratio | Bg Ratio | pvalue | p.adjust | Count |
| GO:000661117 | Esophagus | ESCC | protein export from nucleus | 48/8552 | 57/18723 | 1.92e-09 | 4.39e-08 | 48 |
| GO:00601487 | Esophagus | ESCC | positive regulation of posttranscriptional gene silencing | 24/8552 | 31/18723 | 3.19e-04 | 1.89e-03 | 24 |
| GO:00609667 | Esophagus | ESCC | regulation of gene silencing by RNA | 37/8552 | 53/18723 | 3.25e-04 | 1.92e-03 | 37 |
| GO:00601479 | Esophagus | ESCC | regulation of posttranscriptional gene silencing | 36/8552 | 52/18723 | 5.05e-04 | 2.79e-03 | 36 |
| GO:00609686 | Esophagus | ESCC | regulation of gene silencing | 48/8552 | 81/18723 | 9.54e-03 | 3.30e-02 | 48 |
| GO:00346601 | Liver | HCC | ncRNA metabolic process | 332/7958 | 485/18723 | 1.48e-31 | 7.80e-29 | 332 |
| GO:000640321 | Liver | HCC | RNA localization | 151/7958 | 201/18723 | 3.72e-21 | 5.89e-19 | 151 |
| GO:000691322 | Liver | HCC | nucleocytoplasmic transport | 208/7958 | 301/18723 | 5.51e-21 | 8.12e-19 | 208 |
| GO:005116922 | Liver | HCC | nuclear transport | 208/7958 | 301/18723 | 5.51e-21 | 8.12e-19 | 208 |
| GO:005123621 | Liver | HCC | establishment of RNA localization | 121/7958 | 166/18723 | 1.61e-15 | 1.19e-13 | 121 |
| GO:005116822 | Liver | HCC | nuclear export | 113/7958 | 154/18723 | 6.30e-15 | 4.39e-13 | 113 |
| GO:005065711 | Liver | HCC | nucleic acid transport | 118/7958 | 163/18723 | 8.30e-15 | 5.60e-13 | 118 |
| GO:005065811 | Liver | HCC | RNA transport | 118/7958 | 163/18723 | 8.30e-15 | 5.60e-13 | 118 |
| GO:001593111 | Liver | HCC | nucleobase-containing compound transport | 150/7958 | 222/18723 | 3.17e-14 | 2.03e-12 | 150 |
| GO:00064051 | Liver | HCC | RNA export from nucleus | 60/7958 | 84/18723 | 7.28e-08 | 1.48e-06 | 60 |
| GO:000661112 | Liver | HCC | protein export from nucleus | 42/7958 | 57/18723 | 1.75e-06 | 2.45e-05 | 42 |
| GO:001058611 | Liver | HCC | miRNA metabolic process | 22/7958 | 27/18723 | 3.97e-05 | 3.90e-04 | 22 |
| GO:00601482 | Liver | HCC | positive regulation of posttranscriptional gene silencing | 23/7958 | 31/18723 | 3.47e-04 | 2.42e-03 | 23 |
| GO:006096621 | Liver | HCC | regulation of gene silencing by RNA | 35/7958 | 53/18723 | 4.59e-04 | 3.04e-03 | 35 |
| GO:006014721 | Liver | HCC | regulation of posttranscriptional gene silencing | 34/7958 | 52/18723 | 7.24e-04 | 4.42e-03 | 34 |
| Page: 1 2 3 4 |
| Pathway ID | Tissue | Disease Stage | Description | Gene Ratio | Bg Ratio | pvalue | p.adjust | qvalue | Count |
| hsa0301321 | Esophagus | ESCC | Nucleocytoplasmic transport | 89/4205 | 108/8465 | 1.20e-12 | 2.37e-11 | 1.21e-11 | 89 |
| hsa0301331 | Esophagus | ESCC | Nucleocytoplasmic transport | 89/4205 | 108/8465 | 1.20e-12 | 2.37e-11 | 1.21e-11 | 89 |
| hsa03013 | Liver | HCC | Nucleocytoplasmic transport | 81/4020 | 108/8465 | 4.28e-09 | 6.83e-08 | 3.80e-08 | 81 |
| hsa030131 | Liver | HCC | Nucleocytoplasmic transport | 81/4020 | 108/8465 | 4.28e-09 | 6.83e-08 | 3.80e-08 | 81 |
| Page: 1 |
Top |
Cell-cell communication analysis |
| Identification of potential cell-cell interactions between two cell types and their ligand-receptor pairs for different disease states |
| Ligand | Receptor | LRpair | Pathway | Tissue | Disease Stage |
| Page: 1 |
Top |
Single-cell gene regulatory network inference analysis |
| Find out the significant the regulons (TFs) and the target genes of each regulon across cell types for different disease states |
| TF | Cell Type | Tissue | Disease Stage | Target Gene | RSS | Regulon Activity |
| ∗The dot plots of a searched regulon are shown for all cell subpopulations in each disease state of each tissue based on the regulon specific score inferred using pySCENIC and by calculating the average expression. |
| Page: 1 |
Top |
Somatic mutation of malignant transformation related genes |
| Annotation of somatic variants for genes involved in malignant transformation |
| Hugo Symbol | Variant Class | Variant Classification | dbSNP RS | HGVSc | HGVSp | HGVSp Short | SWISSPROT | BIOTYPE | SIFT | PolyPhen | Tumor Sample Barcode | Tissue | Histology | Sex | Age | Stage | Therapy Types | Drugs | Outcome |
| XPO5 | SNV | Missense_Mutation | rs762469874 | c.1783N>T | p.Arg595Trp | p.R595W | Q9HAV4 | protein_coding | deleterious(0) | probably_damaging(0.998) | TCGA-A2-A0YJ-01 | Breast | breast invasive carcinoma | Female | <65 | III/IV | Chemotherapy | cytoxan | PD |
| XPO5 | SNV | Missense_Mutation | novel | c.2304N>C | p.Gln768His | p.Q768H | Q9HAV4 | protein_coding | tolerated(0.68) | benign(0) | TCGA-A2-A0YM-01 | Breast | breast invasive carcinoma | Female | >=65 | I/II | Unknown | Unknown | SD |
| XPO5 | SNV | Missense_Mutation | c.1913N>C | p.Leu638Pro | p.L638P | Q9HAV4 | protein_coding | tolerated(0.27) | benign(0.017) | TCGA-A7-A13E-01 | Breast | breast invasive carcinoma | Female | <65 | I/II | Targeted Molecular therapy | bevacizumab | PD | |
| XPO5 | SNV | Missense_Mutation | novel | c.200G>C | p.Gly67Ala | p.G67A | Q9HAV4 | protein_coding | deleterious(0) | probably_damaging(0.998) | TCGA-A7-A56D-01 | Breast | breast invasive carcinoma | Female | >=65 | I/II | Hormone Therapy | arimidex | SD |
| XPO5 | SNV | Missense_Mutation | c.3592N>A | p.Leu1198Met | p.L1198M | Q9HAV4 | protein_coding | deleterious(0.01) | possibly_damaging(0.786) | TCGA-A8-A08R-01 | Breast | breast invasive carcinoma | Female | <65 | I/II | Unknown | Unknown | SD | |
| XPO5 | SNV | Missense_Mutation | c.2624C>T | p.Ser875Leu | p.S875L | Q9HAV4 | protein_coding | deleterious(0) | probably_damaging(0.994) | TCGA-AC-A23H-01 | Breast | breast invasive carcinoma | Female | >=65 | I/II | Unknown | Unknown | PD | |
| XPO5 | SNV | Missense_Mutation | novel | c.1793N>T | p.Arg598Met | p.R598M | Q9HAV4 | protein_coding | tolerated(0.18) | benign(0.006) | TCGA-AN-A0FX-01 | Breast | breast invasive carcinoma | Female | <65 | I/II | Unknown | Unknown | SD |
| XPO5 | SNV | Missense_Mutation | c.346C>G | p.Leu116Val | p.L116V | Q9HAV4 | protein_coding | tolerated(0.26) | possibly_damaging(0.622) | TCGA-BH-A0EA-01 | Breast | breast invasive carcinoma | Female | >=65 | I/II | Chemotherapy | taxotere | CR | |
| XPO5 | SNV | Missense_Mutation | c.1906N>C | p.Asn636His | p.N636H | Q9HAV4 | protein_coding | deleterious(0.02) | possibly_damaging(0.592) | TCGA-D8-A1XQ-01 | Breast | breast invasive carcinoma | Female | >=65 | I/II | Unknown | Unknown | SD | |
| XPO5 | SNV | Missense_Mutation | novel | c.1106N>A | p.Ser369Tyr | p.S369Y | Q9HAV4 | protein_coding | deleterious(0) | probably_damaging(0.997) | TCGA-D8-A73U-01 | Breast | breast invasive carcinoma | Female | >=65 | I/II | Hormone Therapy | tamoxiphen | SD |
| Page: 1 2 3 4 5 6 7 8 9 10 11 |
Top |
Related drugs of malignant transformation related genes |
| Identification of chemicals and drugs interact with genes involved in malignant transfromation |
| (DGIdb 4.0) |
| Entrez ID | Symbol | Category | Interaction Types | Drug Claim Name | Drug Name | PMIDs |
| Page: 1 |

Copyright 2023-Present -The University of Texas Health Science Center at Houston |