| Tissue | Expression Dynamics | Abbreviation |
| Cervix | 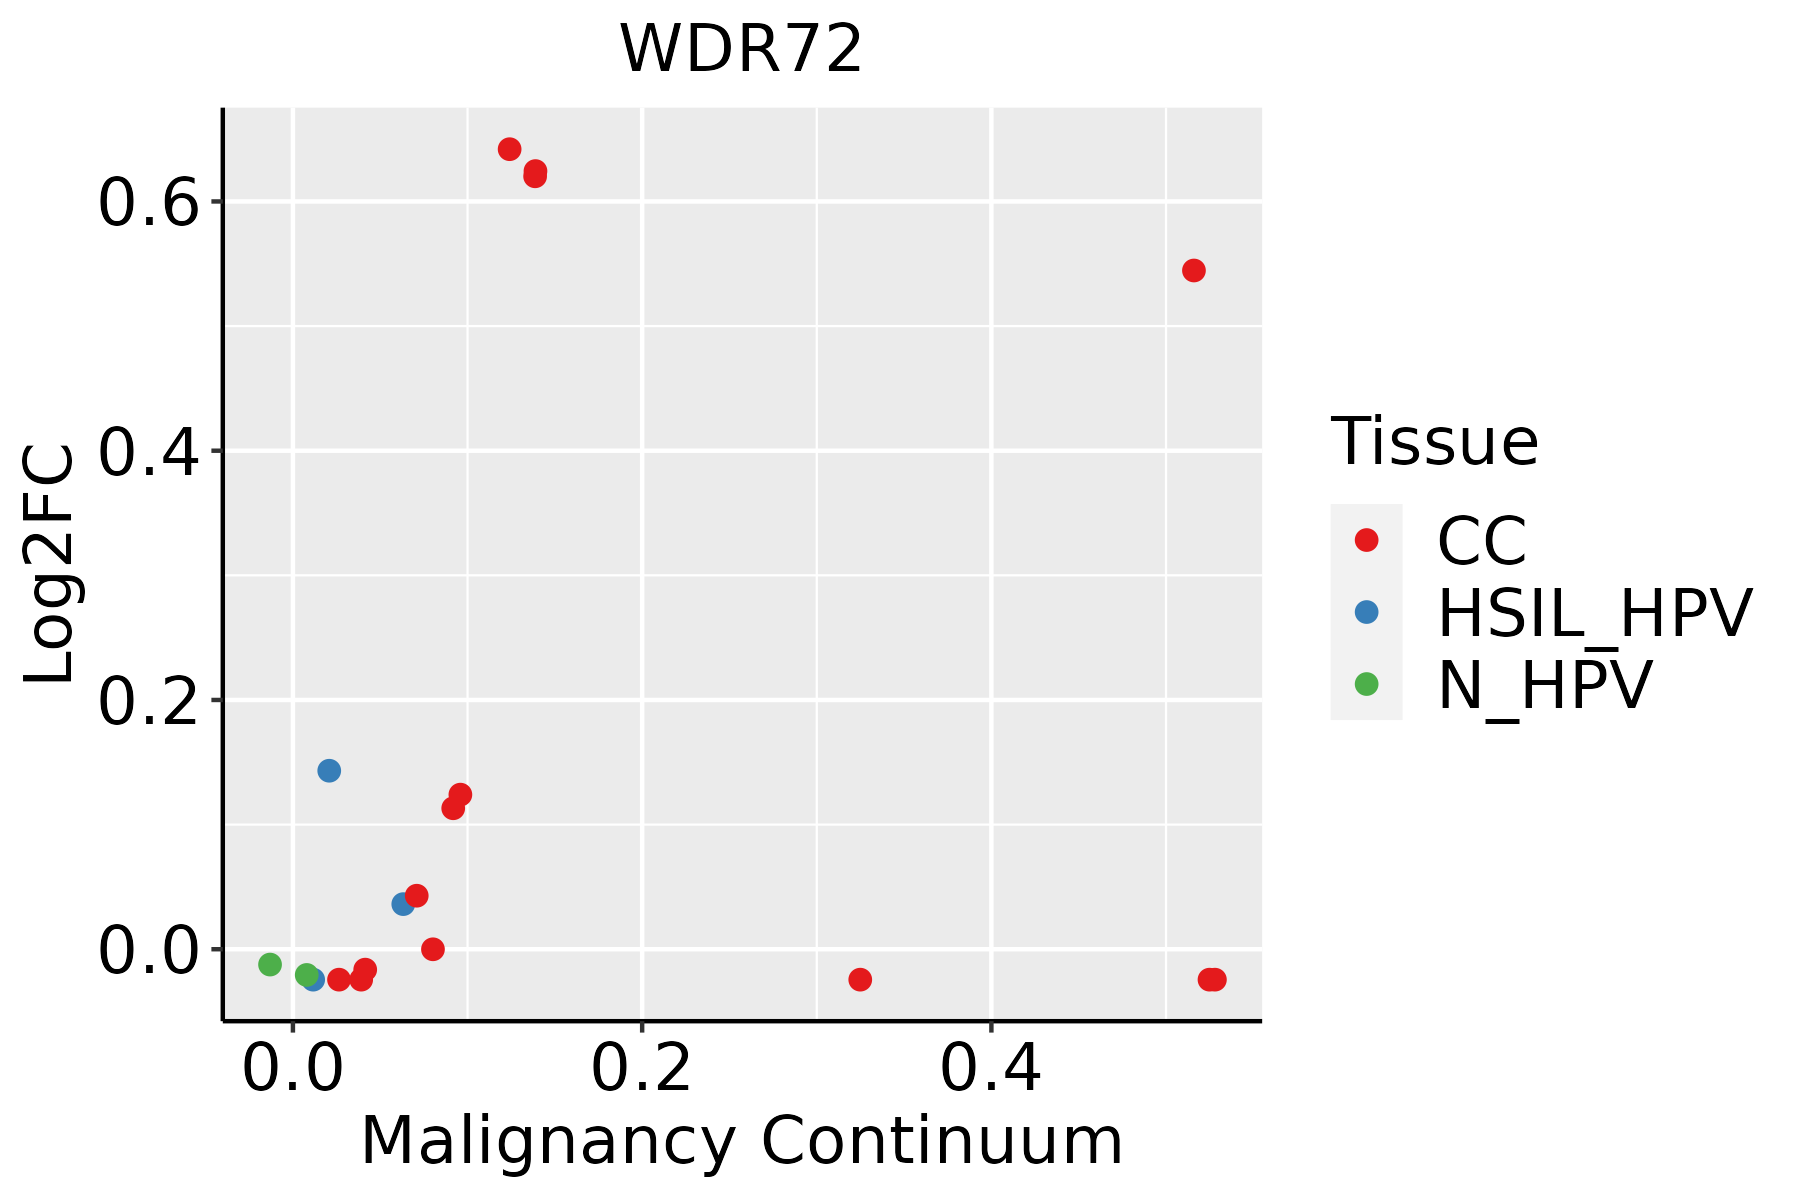 | CC: Cervix cancer |
| HSIL_HPV: HPV-infected high-grade squamous intraepithelial lesions |
| N_HPV: HPV-infected normal cervix |
| Esophagus |  | ESCC: Esophageal squamous cell carcinoma |
| HGIN: High-grade intraepithelial neoplasias |
| LGIN: Low-grade intraepithelial neoplasias |
| Liver | 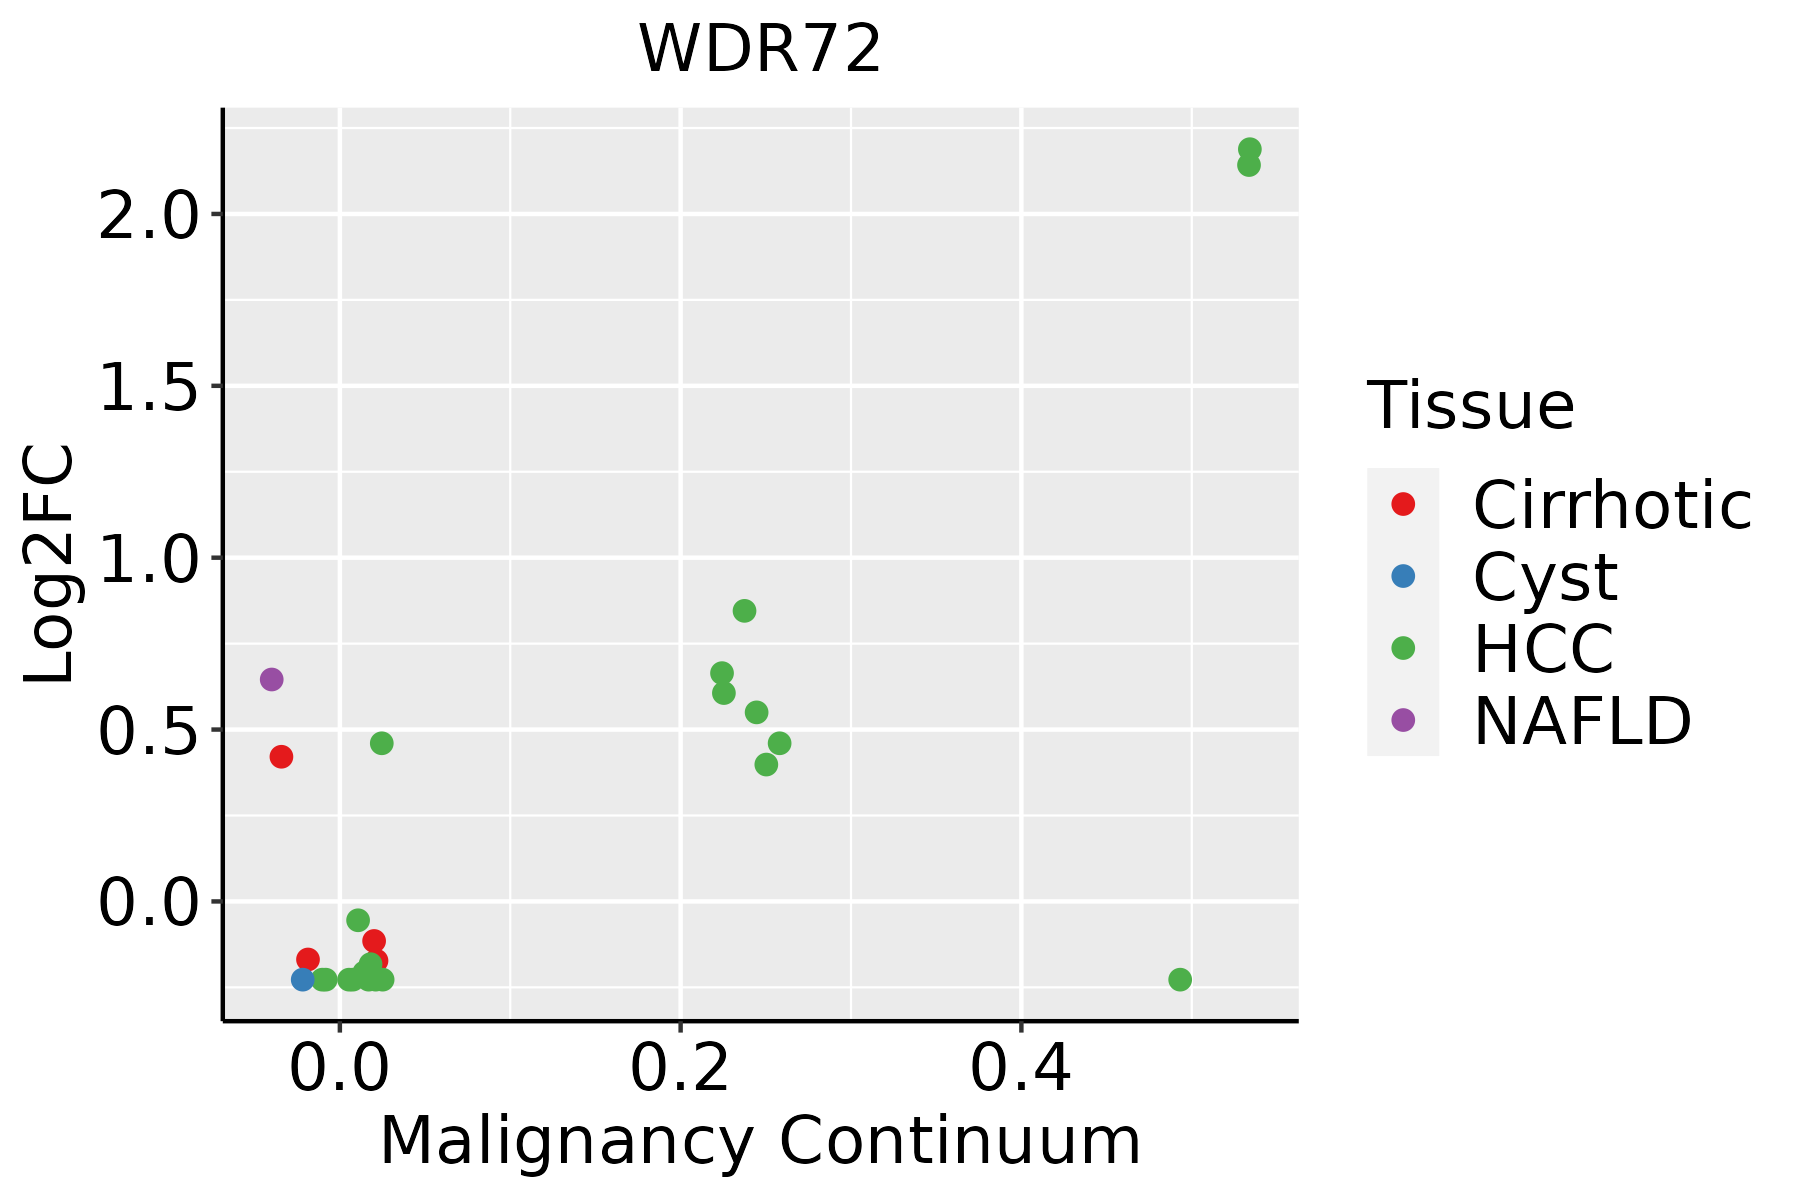 | HCC: Hepatocellular carcinoma |
| NAFLD: Non-alcoholic fatty liver disease |
| Oral Cavity |  | EOLP: Erosive Oral lichen planus |
| LP: leukoplakia |
| NEOLP: Non-erosive oral lichen planus |
| OSCC: Oral squamous cell carcinoma |
| Thyroid |  | ATC: Anaplastic thyroid cancer |
| HT: Hashimoto's thyroiditis |
| PTC: Papillary thyroid cancer |
| GO ID | Tissue | Disease Stage | Description | Gene Ratio | Bg Ratio | pvalue | p.adjust | Count |
| GO:19907786 | Liver | NAFLD | protein localization to cell periphery | 56/1882 | 333/18723 | 8.29e-05 | 1.69e-03 | 56 |
| GO:00224117 | Liver | Cirrhotic | cellular component disassembly | 182/4634 | 443/18723 | 1.59e-14 | 1.54e-12 | 182 |
| GO:199077811 | Liver | Cirrhotic | protein localization to cell periphery | 135/4634 | 333/18723 | 1.18e-10 | 6.21e-09 | 135 |
| GO:007265911 | Liver | Cirrhotic | protein localization to plasma membrane | 119/4634 | 284/18723 | 1.30e-10 | 6.80e-09 | 119 |
| GO:002241112 | Liver | HCC | cellular component disassembly | 282/7958 | 443/18723 | 1.02e-19 | 1.38e-17 | 282 |
| GO:007265921 | Liver | HCC | protein localization to plasma membrane | 177/7958 | 284/18723 | 1.02e-11 | 4.18e-10 | 177 |
| GO:199077821 | Liver | HCC | protein localization to cell periphery | 200/7958 | 333/18723 | 6.07e-11 | 2.23e-09 | 200 |
| GO:002241119 | Oral cavity | OSCC | cellular component disassembly | 283/7305 | 443/18723 | 9.57e-27 | 3.37e-24 | 283 |
| GO:007265918 | Oral cavity | OSCC | protein localization to plasma membrane | 169/7305 | 284/18723 | 1.69e-12 | 7.21e-11 | 169 |
| GO:199077816 | Oral cavity | OSCC | protein localization to cell periphery | 190/7305 | 333/18723 | 1.46e-11 | 5.13e-10 | 190 |
| GO:00301983 | Oral cavity | OSCC | extracellular matrix organization | 146/7305 | 301/18723 | 4.67e-04 | 2.77e-03 | 146 |
| GO:00452293 | Oral cavity | OSCC | external encapsulating structure organization | 147/7305 | 304/18723 | 5.30e-04 | 3.08e-03 | 147 |
| GO:00430623 | Oral cavity | OSCC | extracellular structure organization | 146/7305 | 302/18723 | 5.59e-04 | 3.23e-03 | 146 |
| GO:00226171 | Oral cavity | OSCC | extracellular matrix disassembly | 37/7305 | 63/18723 | 1.18e-03 | 5.99e-03 | 37 |
| GO:0022411110 | Oral cavity | LP | cellular component disassembly | 173/4623 | 443/18723 | 9.97e-12 | 7.44e-10 | 173 |
| GO:007265919 | Oral cavity | LP | protein localization to plasma membrane | 119/4623 | 284/18723 | 1.11e-10 | 6.44e-09 | 119 |
| GO:199077817 | Oral cavity | LP | protein localization to cell periphery | 133/4623 | 333/18723 | 4.42e-10 | 2.21e-08 | 133 |
| GO:007265927 | Thyroid | HT | protein localization to plasma membrane | 36/1272 | 284/18723 | 2.24e-04 | 3.20e-03 | 36 |
| GO:199077825 | Thyroid | HT | protein localization to cell periphery | 39/1272 | 333/18723 | 6.29e-04 | 7.21e-03 | 39 |
| GO:002241123 | Thyroid | HT | cellular component disassembly | 47/1272 | 443/18723 | 1.60e-03 | 1.48e-02 | 47 |
| Hugo Symbol | Variant Class | Variant Classification | dbSNP RS | HGVSc | HGVSp | HGVSp Short | SWISSPROT | BIOTYPE | SIFT | PolyPhen | Tumor Sample Barcode | Tissue | Histology | Sex | Age | Stage | Therapy Types | Drugs | Outcome |
| WDR72 | SNV | Missense_Mutation | | c.2561N>A | p.Ile854Lys | p.I854K | Q3MJ13 | protein_coding | tolerated(0.57) | benign(0) | TCGA-A1-A0SD-01 | Breast | breast invasive carcinoma | Female | <65 | I/II | Unknown | Unknown | SD |
| WDR72 | SNV | Missense_Mutation | | c.2459N>G | p.Asn820Ser | p.N820S | Q3MJ13 | protein_coding | tolerated(0.05) | benign(0.005) | TCGA-A8-A083-01 | Breast | breast invasive carcinoma | Female | >=65 | I/II | Unknown | Unknown | SD |
| WDR72 | SNV | Missense_Mutation | novel | c.357N>A | p.Phe119Leu | p.F119L | Q3MJ13 | protein_coding | tolerated(0.18) | benign(0.115) | TCGA-AC-A23G-01 | Breast | breast invasive carcinoma | Female | >=65 | I/II | Chemotherapy | cytoxan | CR |
| WDR72 | SNV | Missense_Mutation | novel | c.2672N>T | p.Asn891Ile | p.N891I | Q3MJ13 | protein_coding | tolerated(0.07) | benign(0.003) | TCGA-AR-A0U0-01 | Breast | breast invasive carcinoma | Female | >=65 | I/II | Unknown | Unknown | SD |
| WDR72 | SNV | Missense_Mutation | | c.674N>G | p.Glu225Gly | p.E225G | Q3MJ13 | protein_coding | deleterious(0.01) | probably_damaging(0.997) | TCGA-AR-A1AO-01 | Breast | breast invasive carcinoma | Female | <65 | I/II | Chemotherapy | doxorubicin | SD |
| WDR72 | SNV | Missense_Mutation | | c.2318N>C | p.Lys773Thr | p.K773T | Q3MJ13 | protein_coding | deleterious(0.03) | possibly_damaging(0.861) | TCGA-C8-A12X-01 | Breast | breast invasive carcinoma | Female | <65 | I/II | Unknown | Unknown | SD |
| WDR72 | SNV | Missense_Mutation | rs200899249 | c.161N>T | p.Ala54Val | p.A54V | Q3MJ13 | protein_coding | deleterious(0.01) | probably_damaging(0.909) | TCGA-C8-A12X-01 | Breast | breast invasive carcinoma | Female | <65 | I/II | Unknown | Unknown | SD |
| WDR72 | SNV | Missense_Mutation | rs368755797 | c.1802G>A | p.Arg601Gln | p.R601Q | Q3MJ13 | protein_coding | tolerated(0.21) | benign(0.001) | TCGA-D8-A1XF-01 | Breast | breast invasive carcinoma | Female | <65 | I/II | Chemotherapy | adriamycin+cyclophosphamide | SD |
| WDR72 | SNV | Missense_Mutation | | c.196N>T | p.Thr66Ser | p.T66S | Q3MJ13 | protein_coding | deleterious(0.02) | possibly_damaging(0.723) | TCGA-E2-A1LA-01 | Breast | breast invasive carcinoma | Female | <65 | I/II | Hormone Therapy | arimidex | SD |
| WDR72 | SNV | Missense_Mutation | novel | c.1324N>A | p.Leu442Met | p.L442M | Q3MJ13 | protein_coding | deleterious(0) | probably_damaging(0.998) | TCGA-2W-A8YY-01 | Cervix | cervical & endocervical cancer | Female | <65 | I/II | Chemotherapy | cisplatin | CR |


