
|
|||||
|
 | |
| |
| |
| |
| |
| |
|
Gene: WDR7 |
Gene summary for WDR7 |
| Gene information | Species | Human | Gene symbol | WDR7 | Gene ID | 23335 |
| Gene name | WD repeat domain 7 | |
| Gene Alias | TRAG | |
| Cytomap | 18q21.31 | |
| Gene Type | protein-coding | GO ID | GO:0005575 | UniProtAcc | Q9Y4E6 |
Top |
Malignant transformation analysis |
| Identification of the aberrant gene expression in precancerous and cancerous lesions by comparing the gene expression of stem-like cells in diseased tissues with normal stem cells |
| Entrez ID | Symbol | Replicates | Species | Organ | Tissue | Adj P-value | Log2FC | Malignancy |
| 23335 | WDR7 | RNA-P25T1-P25T1-1 | Human | Lung | AIS | 1.77e-15 | 6.80e-01 | -0.2116 |
| 23335 | WDR7 | RNA-P25T1-P25T1-3 | Human | Lung | AIS | 2.14e-02 | 4.43e-01 | -0.2107 |
| 23335 | WDR7 | RNA-P25T1-P25T1-4 | Human | Lung | AIS | 8.73e-13 | 6.53e-01 | -0.2119 |
| 23335 | WDR7 | RNA-P6T2-P6T2-1 | Human | Lung | IAC | 3.62e-04 | 2.64e-01 | -0.0166 |
| 23335 | WDR7 | RNA-P6T2-P6T2-2 | Human | Lung | IAC | 4.15e-02 | 1.89e-01 | -0.0132 |
| 23335 | WDR7 | RNA-P6T2-P6T2-3 | Human | Lung | IAC | 1.56e-03 | 2.09e-01 | -0.013 |
| 23335 | WDR7 | RNA-P6T2-P6T2-4 | Human | Lung | IAC | 4.17e-02 | 2.01e-01 | -0.0121 |
| 23335 | WDR7 | HTA12-15-2 | Human | Pancreas | PDAC | 3.34e-04 | 4.26e-01 | 0.2315 |
| 23335 | WDR7 | HTA12-23-1 | Human | Pancreas | PDAC | 1.68e-12 | 9.53e-01 | 0.3405 |
| 23335 | WDR7 | HTA12-26-1 | Human | Pancreas | PDAC | 1.16e-23 | 1.02e+00 | 0.3728 |
| 23335 | WDR7 | HTA12-29-1 | Human | Pancreas | PDAC | 2.73e-37 | 8.39e-01 | 0.3722 |
| 23335 | WDR7 | HTA12-30-1 | Human | Pancreas | PDAC | 4.63e-02 | 9.00e-01 | 0.3671 |
| Page: 1 |
| Tissue | Expression Dynamics | Abbreviation |
| Lung | 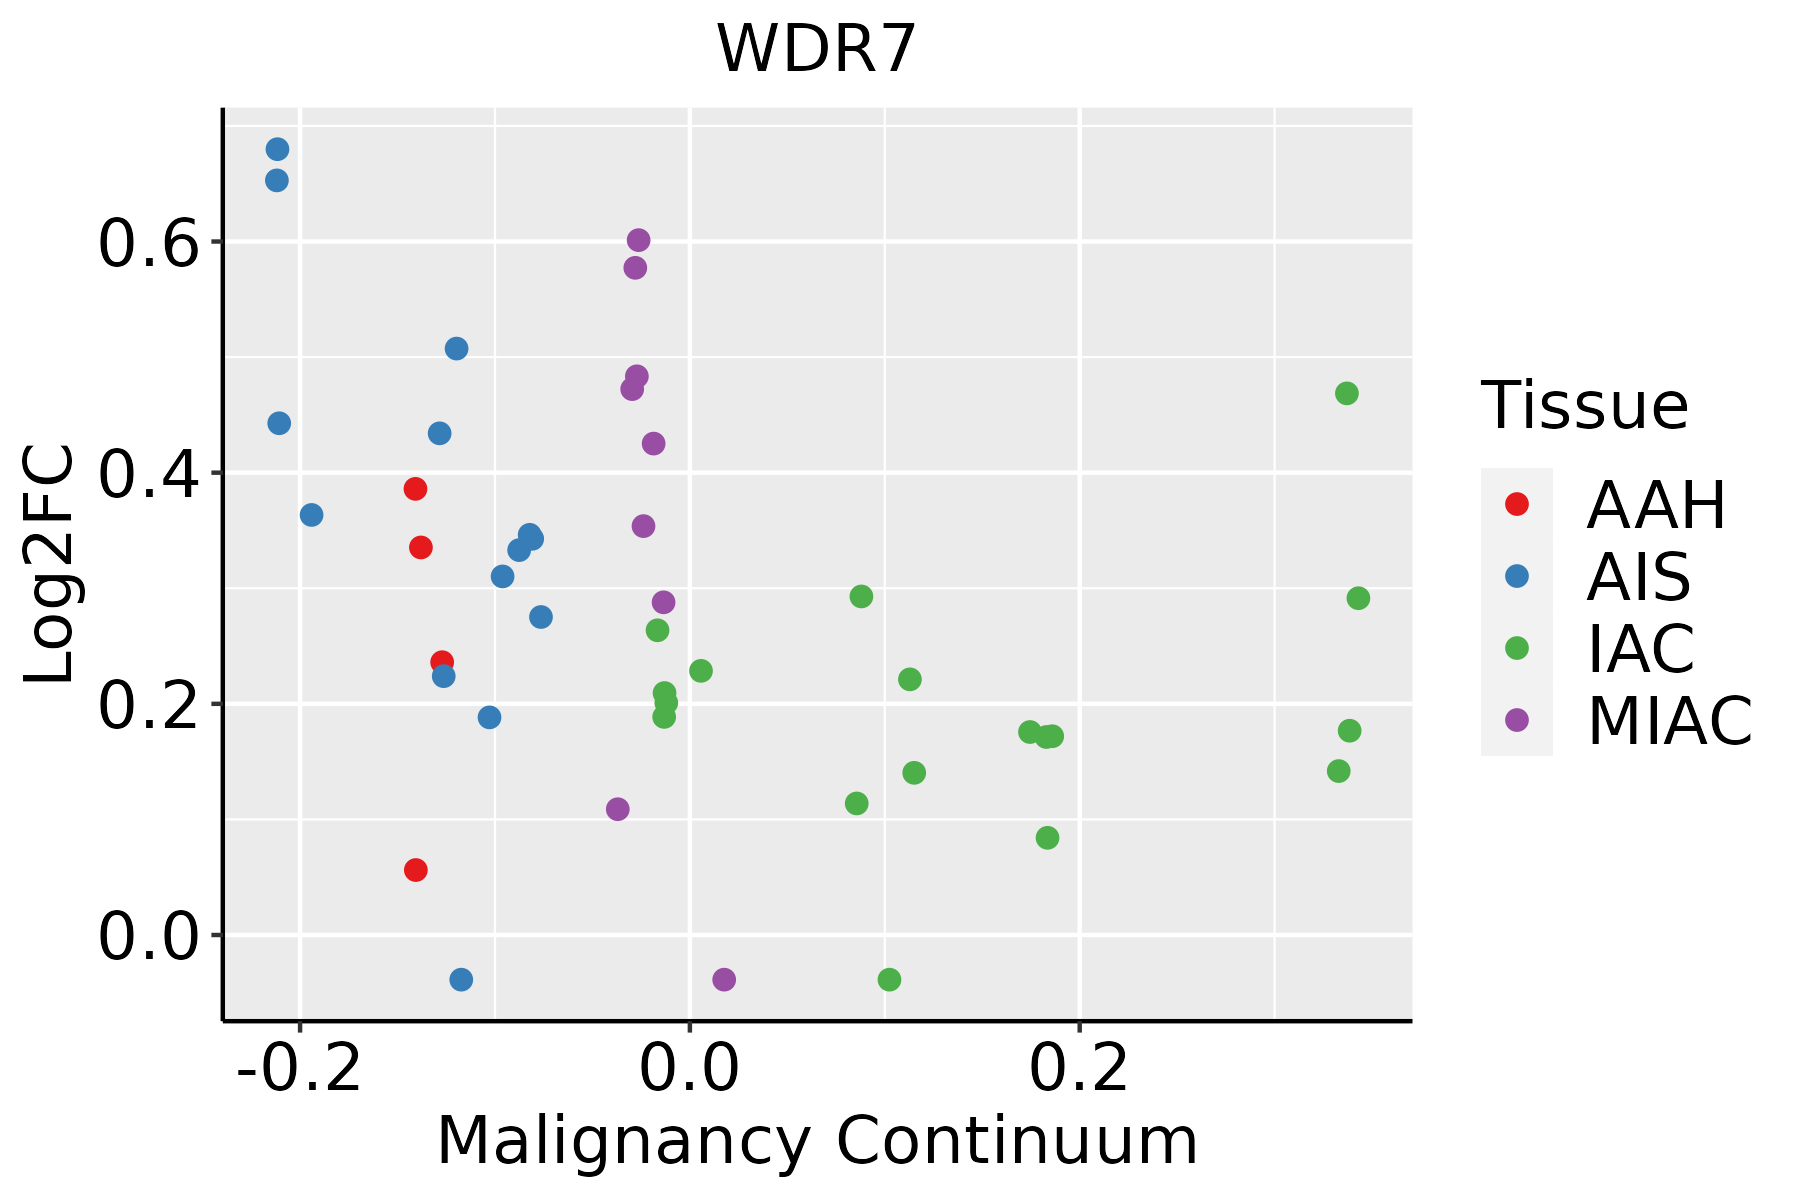 | AAH: Atypical adenomatous hyperplasia |
| AIS: Adenocarcinoma in situ | ||
| IAC: Invasive lung adenocarcinoma | ||
| MIA: Minimally invasive adenocarcinoma |
| ∗log2FC in expression of this searched gene in stem-like cells from each diseased tissue sample relative to stem-like cells in normal samples in each tissue plotted against the malignancy continuum. Samples are colored based on if they are from different disease stage. |
Top |
Malignant transformation related pathway analysis |
| Find out the enriched GO biological processes and KEGG pathways involved in transition from healthy to precancer to cancer |
| Tissue | Disease Stage | Enriched GO biological Processes |
| Colorectum | AD |  |
| Colorectum | SER |  |
| Colorectum | MSS |  |
| Colorectum | MSI-H |  |
| Colorectum | FAP |  |
| ∗Top 15 enriched GO BP terms are showed in the bar plot of each disease state in each tissue. Each row represents a significant GO biological process which is colored according to the -log10(p.adjust). |
| Page: 1 2 3 4 5 6 7 8 9 |
| GO ID | Tissue | Disease Stage | Description | Gene Ratio | Bg Ratio | pvalue | p.adjust | Count |
| GO:00510521 | Colorectum | SER | regulation of DNA metabolic process | 83/2897 | 359/18723 | 8.03e-05 | 1.77e-03 | 83 |
| GO:00310561 | Colorectum | SER | regulation of histone modification | 37/2897 | 152/18723 | 2.80e-03 | 2.50e-02 | 37 |
| GO:19033202 | Colorectum | MSS | regulation of protein modification by small protein conjugation or removal | 82/3467 | 242/18723 | 7.49e-09 | 4.63e-07 | 82 |
| GO:00510522 | Colorectum | MSS | regulation of DNA metabolic process | 108/3467 | 359/18723 | 5.86e-08 | 3.10e-06 | 108 |
| GO:00313962 | Colorectum | MSS | regulation of protein ubiquitination | 70/3467 | 210/18723 | 1.88e-07 | 8.26e-06 | 70 |
| GO:0016570 | Colorectum | MSS | histone modification | 113/3467 | 463/18723 | 8.37e-04 | 8.68e-03 | 113 |
| GO:0006302 | Colorectum | MSS | double-strand break repair | 64/3467 | 251/18723 | 3.58e-03 | 2.65e-02 | 64 |
| GO:00310562 | Colorectum | MSS | regulation of histone modification | 41/3467 | 152/18723 | 6.41e-03 | 4.27e-02 | 41 |
| GO:0016574 | Colorectum | MSS | histone ubiquitination | 16/3467 | 47/18723 | 8.22e-03 | 4.99e-02 | 16 |
| GO:00510524 | Colorectum | FAP | regulation of DNA metabolic process | 84/2622 | 359/18723 | 9.80e-07 | 4.38e-05 | 84 |
| GO:19033204 | Colorectum | FAP | regulation of protein modification by small protein conjugation or removal | 61/2622 | 242/18723 | 2.36e-06 | 9.21e-05 | 61 |
| GO:00313964 | Colorectum | FAP | regulation of protein ubiquitination | 50/2622 | 210/18723 | 9.03e-05 | 1.59e-03 | 50 |
| GO:00165701 | Colorectum | FAP | histone modification | 94/2622 | 463/18723 | 1.06e-04 | 1.76e-03 | 94 |
| GO:00165741 | Colorectum | FAP | histone ubiquitination | 14/2622 | 47/18723 | 3.95e-03 | 2.75e-02 | 14 |
| GO:00510525 | Colorectum | CRC | regulation of DNA metabolic process | 70/2078 | 359/18723 | 1.75e-06 | 8.92e-05 | 70 |
| GO:19033205 | Colorectum | CRC | regulation of protein modification by small protein conjugation or removal | 51/2078 | 242/18723 | 4.55e-06 | 1.87e-04 | 51 |
| GO:00313965 | Colorectum | CRC | regulation of protein ubiquitination | 42/2078 | 210/18723 | 1.08e-04 | 2.13e-03 | 42 |
| GO:00165702 | Colorectum | CRC | histone modification | 75/2078 | 463/18723 | 4.95e-04 | 7.06e-03 | 75 |
| GO:190332016 | Endometrium | AEH | regulation of protein modification by small protein conjugation or removal | 67/2100 | 242/18723 | 1.10e-12 | 2.26e-10 | 67 |
| GO:003139616 | Endometrium | AEH | regulation of protein ubiquitination | 57/2100 | 210/18723 | 1.24e-10 | 1.40e-08 | 57 |
| Page: 1 2 3 4 5 6 7 8 9 10 11 12 13 14 15 16 17 |
| Pathway ID | Tissue | Disease Stage | Description | Gene Ratio | Bg Ratio | pvalue | p.adjust | qvalue | Count |
| Page: 1 |
Top |
Cell-cell communication analysis |
| Identification of potential cell-cell interactions between two cell types and their ligand-receptor pairs for different disease states |
| Ligand | Receptor | LRpair | Pathway | Tissue | Disease Stage |
| Page: 1 |
Top |
Single-cell gene regulatory network inference analysis |
| Find out the significant the regulons (TFs) and the target genes of each regulon across cell types for different disease states |
| TF | Cell Type | Tissue | Disease Stage | Target Gene | RSS | Regulon Activity |
| ∗The dot plots of a searched regulon are shown for all cell subpopulations in each disease state of each tissue based on the regulon specific score inferred using pySCENIC and by calculating the average expression. |
| Page: 1 |
Top |
Somatic mutation of malignant transformation related genes |
| Annotation of somatic variants for genes involved in malignant transformation |
| Hugo Symbol | Variant Class | Variant Classification | dbSNP RS | HGVSc | HGVSp | HGVSp Short | SWISSPROT | BIOTYPE | SIFT | PolyPhen | Tumor Sample Barcode | Tissue | Histology | Sex | Age | Stage | Therapy Types | Drugs | Outcome |
| WDR7 | SNV | Missense_Mutation | c.2250N>G | p.Ile750Met | p.I750M | Q9Y4E6 | protein_coding | tolerated(0.19) | benign(0.015) | TCGA-A1-A0SH-01 | Breast | breast invasive carcinoma | Female | <65 | I/II | Chemotherapy | tc | SD | |
| WDR7 | SNV | Missense_Mutation | c.2882C>G | p.Ala961Gly | p.A961G | Q9Y4E6 | protein_coding | tolerated(0.06) | benign(0.017) | TCGA-A1-A0SO-01 | Breast | breast invasive carcinoma | Female | >=65 | I/II | Chemotherapy | SD | ||
| WDR7 | SNV | Missense_Mutation | rs778537690 | c.1597N>G | p.Ile533Val | p.I533V | Q9Y4E6 | protein_coding | tolerated(0.52) | benign(0) | TCGA-A2-A0EQ-01 | Breast | breast invasive carcinoma | Female | <65 | I/II | Chemotherapy | adriamycin | SD |
| WDR7 | SNV | Missense_Mutation | c.686N>T | p.Ser229Leu | p.S229L | Q9Y4E6 | protein_coding | deleterious(0.04) | benign(0.023) | TCGA-A7-A26H-01 | Breast | breast invasive carcinoma | Female | >=65 | I/II | Hormone Therapy | anastrozole | PD | |
| WDR7 | SNV | Missense_Mutation | c.3245G>C | p.Gly1082Ala | p.G1082A | Q9Y4E6 | protein_coding | tolerated(0.32) | benign(0.024) | TCGA-A8-A07B-01 | Breast | breast invasive carcinoma | Female | >=65 | I/II | Unknown | Unknown | SD | |
| WDR7 | SNV | Missense_Mutation | novel | c.1208G>T | p.Ser403Ile | p.S403I | Q9Y4E6 | protein_coding | tolerated(0.16) | benign(0) | TCGA-AR-A24U-01 | Breast | breast invasive carcinoma | Female | <65 | I/II | Chemotherapy | doxorubicin | SD |
| WDR7 | SNV | Missense_Mutation | c.1616A>T | p.Asp539Val | p.D539V | Q9Y4E6 | protein_coding | deleterious(0) | probably_damaging(0.996) | TCGA-B6-A0RH-01 | Breast | breast invasive carcinoma | Female | <65 | I/II | Unknown | Unknown | PD | |
| WDR7 | SNV | Missense_Mutation | c.1195G>T | p.Val399Leu | p.V399L | Q9Y4E6 | protein_coding | tolerated(0.78) | benign(0) | TCGA-BH-A18T-01 | Breast | breast invasive carcinoma | Female | >=65 | I/II | Unknown | Unknown | PD | |
| WDR7 | SNV | Missense_Mutation | novel | c.2219N>T | p.Ala740Val | p.A740V | Q9Y4E6 | protein_coding | tolerated(0.13) | benign(0.021) | TCGA-C8-A8HR-01 | Breast | breast invasive carcinoma | Female | <65 | III/IV | Chemotherapy | 5-fluorouracil | CR |
| WDR7 | SNV | Missense_Mutation | c.1991G>C | p.Gly664Ala | p.G664A | Q9Y4E6 | protein_coding | tolerated(0.12) | possibly_damaging(0.775) | TCGA-EW-A1OV-01 | Breast | breast invasive carcinoma | Female | <65 | I/II | Chemotherapy | epirubicin | SD |
| Page: 1 2 3 4 5 6 7 8 9 10 11 12 13 14 15 16 17 18 19 |
Top |
Related drugs of malignant transformation related genes |
| Identification of chemicals and drugs interact with genes involved in malignant transfromation |
| (DGIdb 4.0) |
| Entrez ID | Symbol | Category | Interaction Types | Drug Claim Name | Drug Name | PMIDs |
| Page: 1 |

Copyright 2023-Present -The University of Texas Health Science Center at Houston |