
|
|||||
|
 | |
| |
| |
| |
| |
| |
|
Gene: WASHC1 |
Gene summary for WASHC1 |
| Gene information | Species | Human | Gene symbol | WASHC1 | Gene ID | 100287171 |
| Gene name | WASH complex subunit 1 | |
| Gene Alias | FAM39E | |
| Cytomap | 9p24.3 | |
| Gene Type | protein-coding | GO ID | GO:0006464 | UniProtAcc | A8K0Z3 |
Top |
Malignant transformation analysis |
| Identification of the aberrant gene expression in precancerous and cancerous lesions by comparing the gene expression of stem-like cells in diseased tissues with normal stem cells |
| Entrez ID | Symbol | Replicates | Species | Organ | Tissue | Adj P-value | Log2FC | Malignancy |
| 100287171 | WASHC1 | CCI_2 | Human | Cervix | CC | 2.66e-04 | 5.40e-01 | 0.5249 |
| 100287171 | WASHC1 | CCI_3 | Human | Cervix | CC | 2.52e-08 | 4.45e-01 | 0.516 |
| 100287171 | WASHC1 | CCII_1 | Human | Cervix | CC | 3.96e-04 | 2.74e-01 | 0.3249 |
| 100287171 | WASHC1 | Tumor | Human | Cervix | CC | 4.00e-05 | -1.24e-01 | 0.1241 |
| 100287171 | WASHC1 | LZE4T | Human | Esophagus | ESCC | 8.35e-06 | 1.93e-01 | 0.0811 |
| 100287171 | WASHC1 | LZE5T | Human | Esophagus | ESCC | 1.54e-04 | 2.80e-01 | 0.0514 |
| 100287171 | WASHC1 | LZE7T | Human | Esophagus | ESCC | 2.68e-16 | 5.21e-01 | 0.0667 |
| 100287171 | WASHC1 | LZE8T | Human | Esophagus | ESCC | 3.19e-08 | 2.55e-01 | 0.067 |
| 100287171 | WASHC1 | LZE20T | Human | Esophagus | ESCC | 8.11e-14 | 3.32e-01 | 0.0662 |
| 100287171 | WASHC1 | LZE21D1 | Human | Esophagus | HGIN | 2.75e-06 | 4.56e-01 | 0.0632 |
| 100287171 | WASHC1 | LZE22D1 | Human | Esophagus | HGIN | 4.30e-07 | 2.56e-01 | 0.0595 |
| 100287171 | WASHC1 | LZE22T | Human | Esophagus | ESCC | 1.15e-08 | 5.85e-01 | 0.068 |
| 100287171 | WASHC1 | LZE24T | Human | Esophagus | ESCC | 2.64e-17 | 3.85e-01 | 0.0596 |
| 100287171 | WASHC1 | LZE21T | Human | Esophagus | ESCC | 1.37e-06 | 3.66e-01 | 0.0655 |
| 100287171 | WASHC1 | LZE6T | Human | Esophagus | ESCC | 1.55e-08 | 2.96e-01 | 0.0845 |
| 100287171 | WASHC1 | NAFLD1 | Human | Liver | NAFLD | 1.36e-03 | 4.05e-01 | -0.04 |
| 100287171 | WASHC1 | S014 | Human | Liver | HCC | 5.95e-27 | 8.16e-01 | 0.2254 |
| 100287171 | WASHC1 | S015 | Human | Liver | HCC | 9.95e-28 | 1.12e+00 | 0.2375 |
| 100287171 | WASHC1 | S016 | Human | Liver | HCC | 1.68e-26 | 8.44e-01 | 0.2243 |
| 100287171 | WASHC1 | S027 | Human | Liver | HCC | 5.72e-19 | 1.14e+00 | 0.2446 |
| Page: 1 2 |
| Tissue | Expression Dynamics | Abbreviation |
| Cervix | 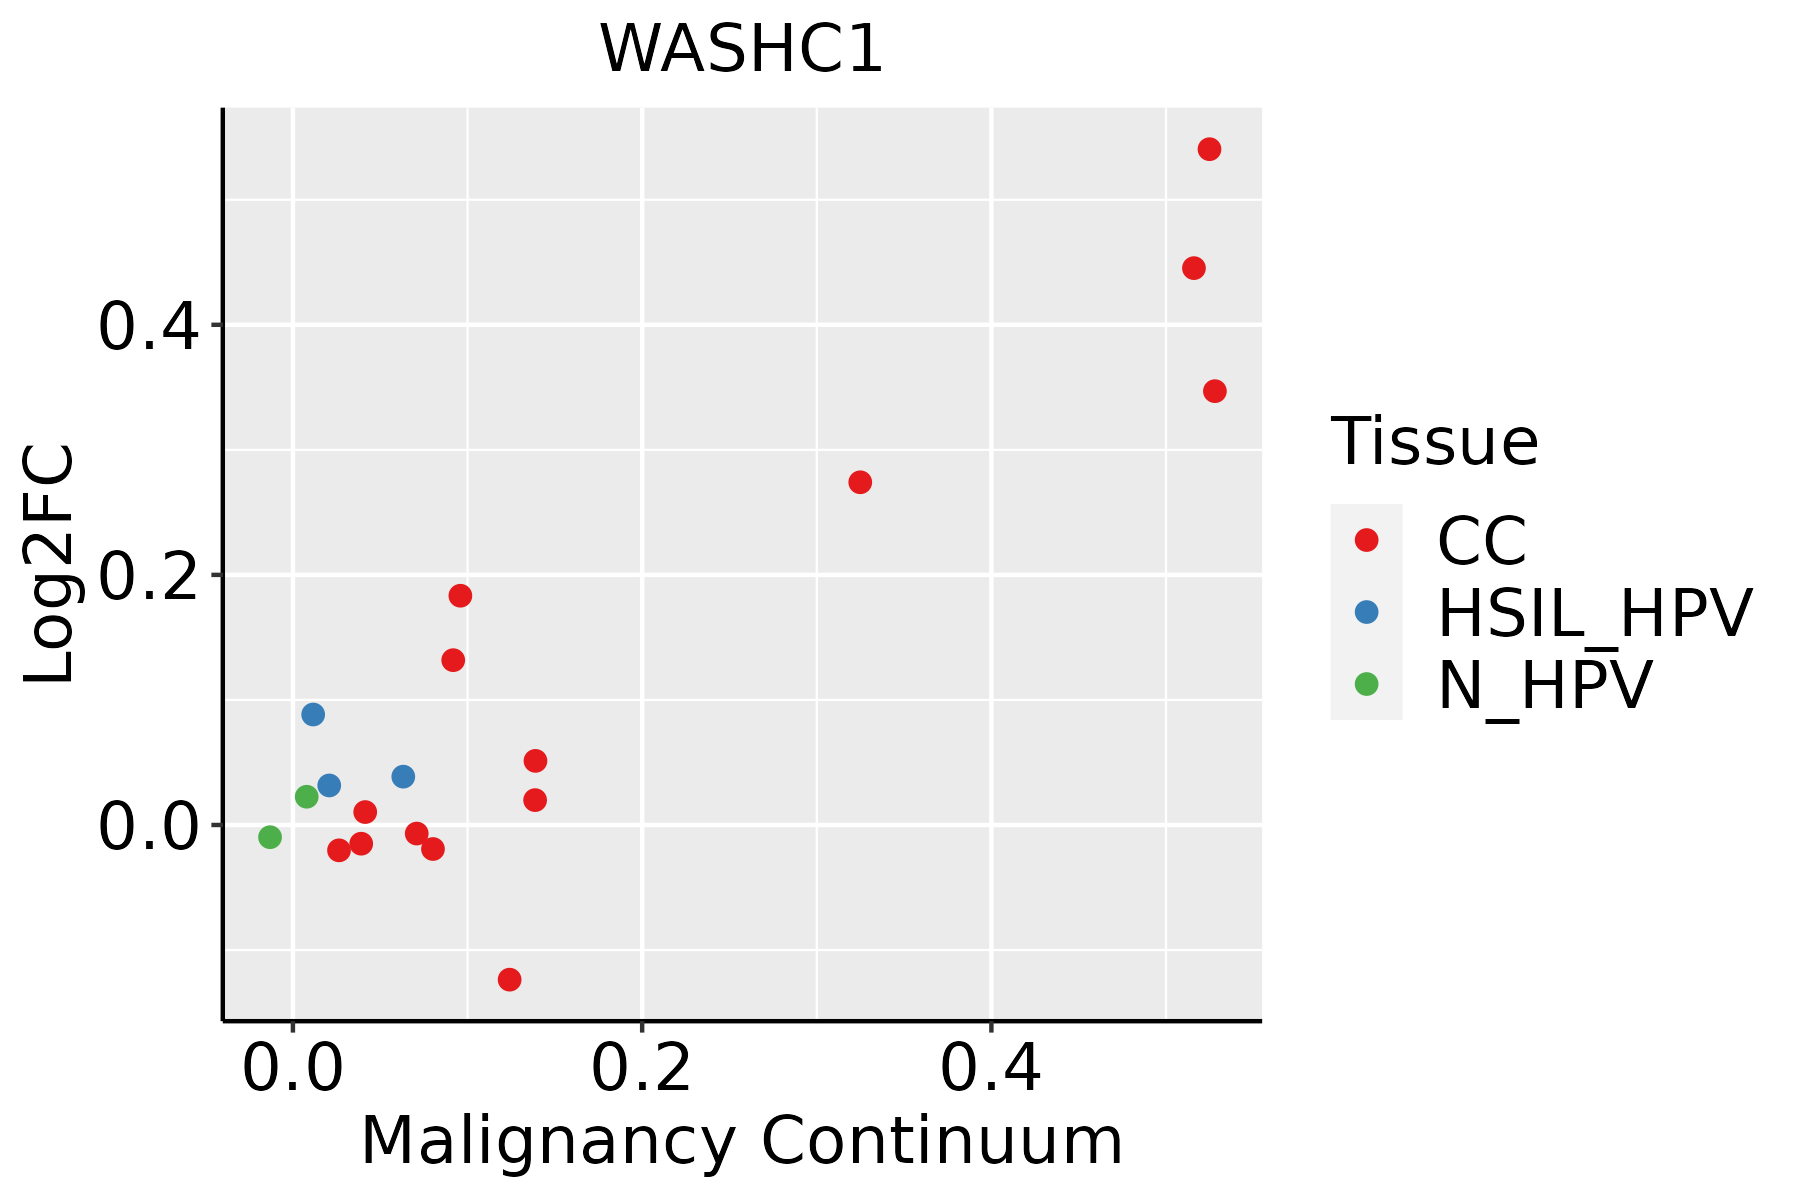 | CC: Cervix cancer |
| HSIL_HPV: HPV-infected high-grade squamous intraepithelial lesions | ||
| N_HPV: HPV-infected normal cervix | ||
| Esophagus |  | ESCC: Esophageal squamous cell carcinoma |
| HGIN: High-grade intraepithelial neoplasias | ||
| LGIN: Low-grade intraepithelial neoplasias | ||
| Liver |  | HCC: Hepatocellular carcinoma |
| NAFLD: Non-alcoholic fatty liver disease | ||
| Thyroid |  | ATC: Anaplastic thyroid cancer |
| HT: Hashimoto's thyroiditis | ||
| PTC: Papillary thyroid cancer |
| ∗log2FC in expression of this searched gene in stem-like cells from each diseased tissue sample relative to stem-like cells in normal samples in each tissue plotted against the malignancy continuum. Samples are colored based on if they are from different disease stage. |
Top |
Malignant transformation related pathway analysis |
| Find out the enriched GO biological processes and KEGG pathways involved in transition from healthy to precancer to cancer |
| Tissue | Disease Stage | Enriched GO biological Processes |
| Colorectum | AD |  |
| Colorectum | SER |  |
| Colorectum | MSS |  |
| Colorectum | MSI-H |  |
| Colorectum | FAP |  |
| ∗Top 15 enriched GO BP terms are showed in the bar plot of each disease state in each tissue. Each row represents a significant GO biological process which is colored according to the -log10(p.adjust). |
| Page: 1 2 3 4 5 6 7 8 9 |
| GO ID | Tissue | Disease Stage | Description | Gene Ratio | Bg Ratio | pvalue | p.adjust | Count |
| GO:00300419 | Cervix | CC | actin filament polymerization | 45/2311 | 191/18723 | 1.20e-05 | 2.54e-04 | 45 |
| GO:00325359 | Cervix | CC | regulation of cellular component size | 76/2311 | 383/18723 | 1.66e-05 | 3.21e-04 | 76 |
| GO:005149510 | Cervix | CC | positive regulation of cytoskeleton organization | 50/2311 | 226/18723 | 2.53e-05 | 4.29e-04 | 50 |
| GO:00988767 | Cervix | CC | vesicle-mediated transport to the plasma membrane | 34/2311 | 136/18723 | 3.75e-05 | 5.91e-04 | 34 |
| GO:00308339 | Cervix | CC | regulation of actin filament polymerization | 40/2311 | 172/18723 | 4.90e-05 | 7.40e-04 | 40 |
| GO:002241110 | Cervix | CC | cellular component disassembly | 83/2311 | 443/18723 | 6.04e-05 | 8.68e-04 | 83 |
| GO:00080649 | Cervix | CC | regulation of actin polymerization or depolymerization | 42/2311 | 188/18723 | 8.60e-05 | 1.15e-03 | 42 |
| GO:00336739 | Cervix | CC | negative regulation of kinase activity | 50/2311 | 237/18723 | 9.22e-05 | 1.21e-03 | 50 |
| GO:00308328 | Cervix | CC | regulation of actin filament length | 42/2311 | 189/18723 | 9.76e-05 | 1.27e-03 | 42 |
| GO:003227310 | Cervix | CC | positive regulation of protein polymerization | 33/2311 | 138/18723 | 1.23e-04 | 1.53e-03 | 33 |
| GO:00161977 | Cervix | CC | endosomal transport | 48/2311 | 230/18723 | 1.65e-04 | 1.97e-03 | 48 |
| GO:00105067 | Cervix | CC | regulation of autophagy | 61/2311 | 317/18723 | 2.61e-04 | 2.87e-03 | 61 |
| GO:00308389 | Cervix | CC | positive regulation of actin filament polymerization | 24/2311 | 99/18723 | 7.93e-04 | 6.99e-03 | 24 |
| GO:01200328 | Cervix | CC | regulation of plasma membrane bounded cell projection assembly | 38/2311 | 186/18723 | 1.14e-03 | 9.35e-03 | 38 |
| GO:00604917 | Cervix | CC | regulation of cell projection assembly | 38/2311 | 188/18723 | 1.40e-03 | 1.10e-02 | 38 |
| GO:00164827 | Cervix | CC | cytosolic transport | 33/2311 | 168/18723 | 4.43e-03 | 2.70e-02 | 33 |
| GO:00343147 | Cervix | CC | Arp2/3 complex-mediated actin nucleation | 11/2311 | 39/18723 | 6.13e-03 | 3.48e-02 | 11 |
| GO:0030198 | Cervix | CC | extracellular matrix organization | 52/2311 | 301/18723 | 7.43e-03 | 3.98e-02 | 52 |
| GO:0043062 | Cervix | CC | extracellular structure organization | 52/2311 | 302/18723 | 7.92e-03 | 4.17e-02 | 52 |
| GO:0022617 | Cervix | CC | extracellular matrix disassembly | 15/2311 | 63/18723 | 8.52e-03 | 4.40e-02 | 15 |
| Page: 1 2 3 4 5 6 7 8 9 10 11 12 13 14 |
| Pathway ID | Tissue | Disease Stage | Description | Gene Ratio | Bg Ratio | pvalue | p.adjust | qvalue | Count |
| hsa0414418 | Cervix | CC | Endocytosis | 64/1267 | 251/8465 | 6.97e-06 | 6.10e-05 | 3.61e-05 | 64 |
| hsa0414419 | Cervix | CC | Endocytosis | 64/1267 | 251/8465 | 6.97e-06 | 6.10e-05 | 3.61e-05 | 64 |
| hsa0414429 | Esophagus | HGIN | Endocytosis | 76/1383 | 251/8465 | 1.74e-08 | 3.34e-07 | 2.65e-07 | 76 |
| hsa04144113 | Esophagus | HGIN | Endocytosis | 76/1383 | 251/8465 | 1.74e-08 | 3.34e-07 | 2.65e-07 | 76 |
| hsa04144210 | Esophagus | ESCC | Endocytosis | 186/4205 | 251/8465 | 9.74e-16 | 4.66e-14 | 2.39e-14 | 186 |
| hsa0414437 | Esophagus | ESCC | Endocytosis | 186/4205 | 251/8465 | 9.74e-16 | 4.66e-14 | 2.39e-14 | 186 |
| Page: 1 |
Top |
Cell-cell communication analysis |
| Identification of potential cell-cell interactions between two cell types and their ligand-receptor pairs for different disease states |
| Ligand | Receptor | LRpair | Pathway | Tissue | Disease Stage |
| Page: 1 |
Top |
Single-cell gene regulatory network inference analysis |
| Find out the significant the regulons (TFs) and the target genes of each regulon across cell types for different disease states |
| TF | Cell Type | Tissue | Disease Stage | Target Gene | RSS | Regulon Activity |
| ∗The dot plots of a searched regulon are shown for all cell subpopulations in each disease state of each tissue based on the regulon specific score inferred using pySCENIC and by calculating the average expression. |
| Page: 1 |
Top |
Somatic mutation of malignant transformation related genes |
| Annotation of somatic variants for genes involved in malignant transformation |
| Hugo Symbol | Variant Class | Variant Classification | dbSNP RS | HGVSc | HGVSp | HGVSp Short | SWISSPROT | BIOTYPE | SIFT | PolyPhen | Tumor Sample Barcode | Tissue | Histology | Sex | Age | Stage | Therapy Types | Drugs | Outcome |
| WASHC1 | SNV | Missense_Mutation | novel | c.1069G>A | p.Asp357Asn | p.D357N | A8K0Z3 | protein_coding | tolerated(0.6) | benign(0.003) | TCGA-AC-A3QP-01 | Breast | breast invasive carcinoma | Female | >=65 | I/II | Hormone Therapy | femara | SD |
| WASHC1 | SNV | Missense_Mutation | rs762714703 | c.805G>A | p.Gly269Ser | p.G269S | A8K0Z3 | protein_coding | tolerated(0.54) | possibly_damaging(0.734) | TCGA-B5-A3FC-01 | Endometrium | uterine corpus endometrioid carcinoma | Female | <65 | I/II | Unknown | Unknown | SD |
| WASHC1 | SNV | Missense_Mutation | novel | c.678G>T | p.Gln226His | p.Q226H | A8K0Z3 | protein_coding | deleterious(0.03) | possibly_damaging(0.549) | TCGA-B5-A3FC-01 | Endometrium | uterine corpus endometrioid carcinoma | Female | <65 | I/II | Unknown | Unknown | SD |
| WASHC1 | SNV | Missense_Mutation | novel | c.1069N>A | p.Asp357Asn | p.D357N | A8K0Z3 | protein_coding | tolerated(0.6) | benign(0.003) | TCGA-FI-A2D5-01 | Endometrium | uterine corpus endometrioid carcinoma | Female | <65 | III/IV | Chemotherapy | carboplatinum | PD |
| WASHC1 | SNV | Missense_Mutation | rs746128171 | c.1076N>A | p.Ser359Tyr | p.S359Y | A8K0Z3 | protein_coding | deleterious(0.01) | probably_damaging(0.997) | TCGA-KP-A3W0-01 | Endometrium | uterine corpus endometrioid carcinoma | Female | >=65 | I/II | Unknown | Unknown | SD |
| WASHC1 | SNV | Missense_Mutation | novel | c.572N>A | p.Pro191His | p.P191H | A8K0Z3 | protein_coding | deleterious(0) | probably_damaging(0.992) | TCGA-UB-A7MB-01 | Liver | liver hepatocellular carcinoma | Male | <65 | I/II | Targeted Molecular therapy | sorafenib | PD |
| WASHC1 | SNV | Missense_Mutation | novel | c.703N>T | p.Val235Leu | p.V235L | A8K0Z3 | protein_coding | deleterious(0.05) | benign(0.289) | TCGA-86-8073-01 | Lung | lung adenocarcinoma | Male | <65 | I/II | Unknown | Unknown | SD |
| WASHC1 | SNV | Missense_Mutation | novel | c.739N>A | p.Pro247Thr | p.P247T | A8K0Z3 | protein_coding | deleterious(0) | probably_damaging(1) | TCGA-CV-A6K2-01 | Oral cavity | head & neck squamous cell carcinoma | Male | >=65 | I/II | Unknown | Unknown | PD |
| WASHC1 | SNV | Missense_Mutation | rs761521000 | c.1384N>A | p.Asp462Asn | p.D462N | A8K0Z3 | protein_coding | deleterious(0) | possibly_damaging(0.454) | TCGA-BR-8680-01 | Stomach | stomach adenocarcinoma | Male | <65 | III/IV | Chemotherapy | oxaliplatin | CR |
| Page: 1 |
Top |
Related drugs of malignant transformation related genes |
| Identification of chemicals and drugs interact with genes involved in malignant transfromation |
| (DGIdb 4.0) |
| Entrez ID | Symbol | Category | Interaction Types | Drug Claim Name | Drug Name | PMIDs |
| Page: 1 |

Copyright 2023-Present -The University of Texas Health Science Center at Houston |