| GO ID | Tissue | Disease Stage | Description | Gene Ratio | Bg Ratio | pvalue | p.adjust | Count |
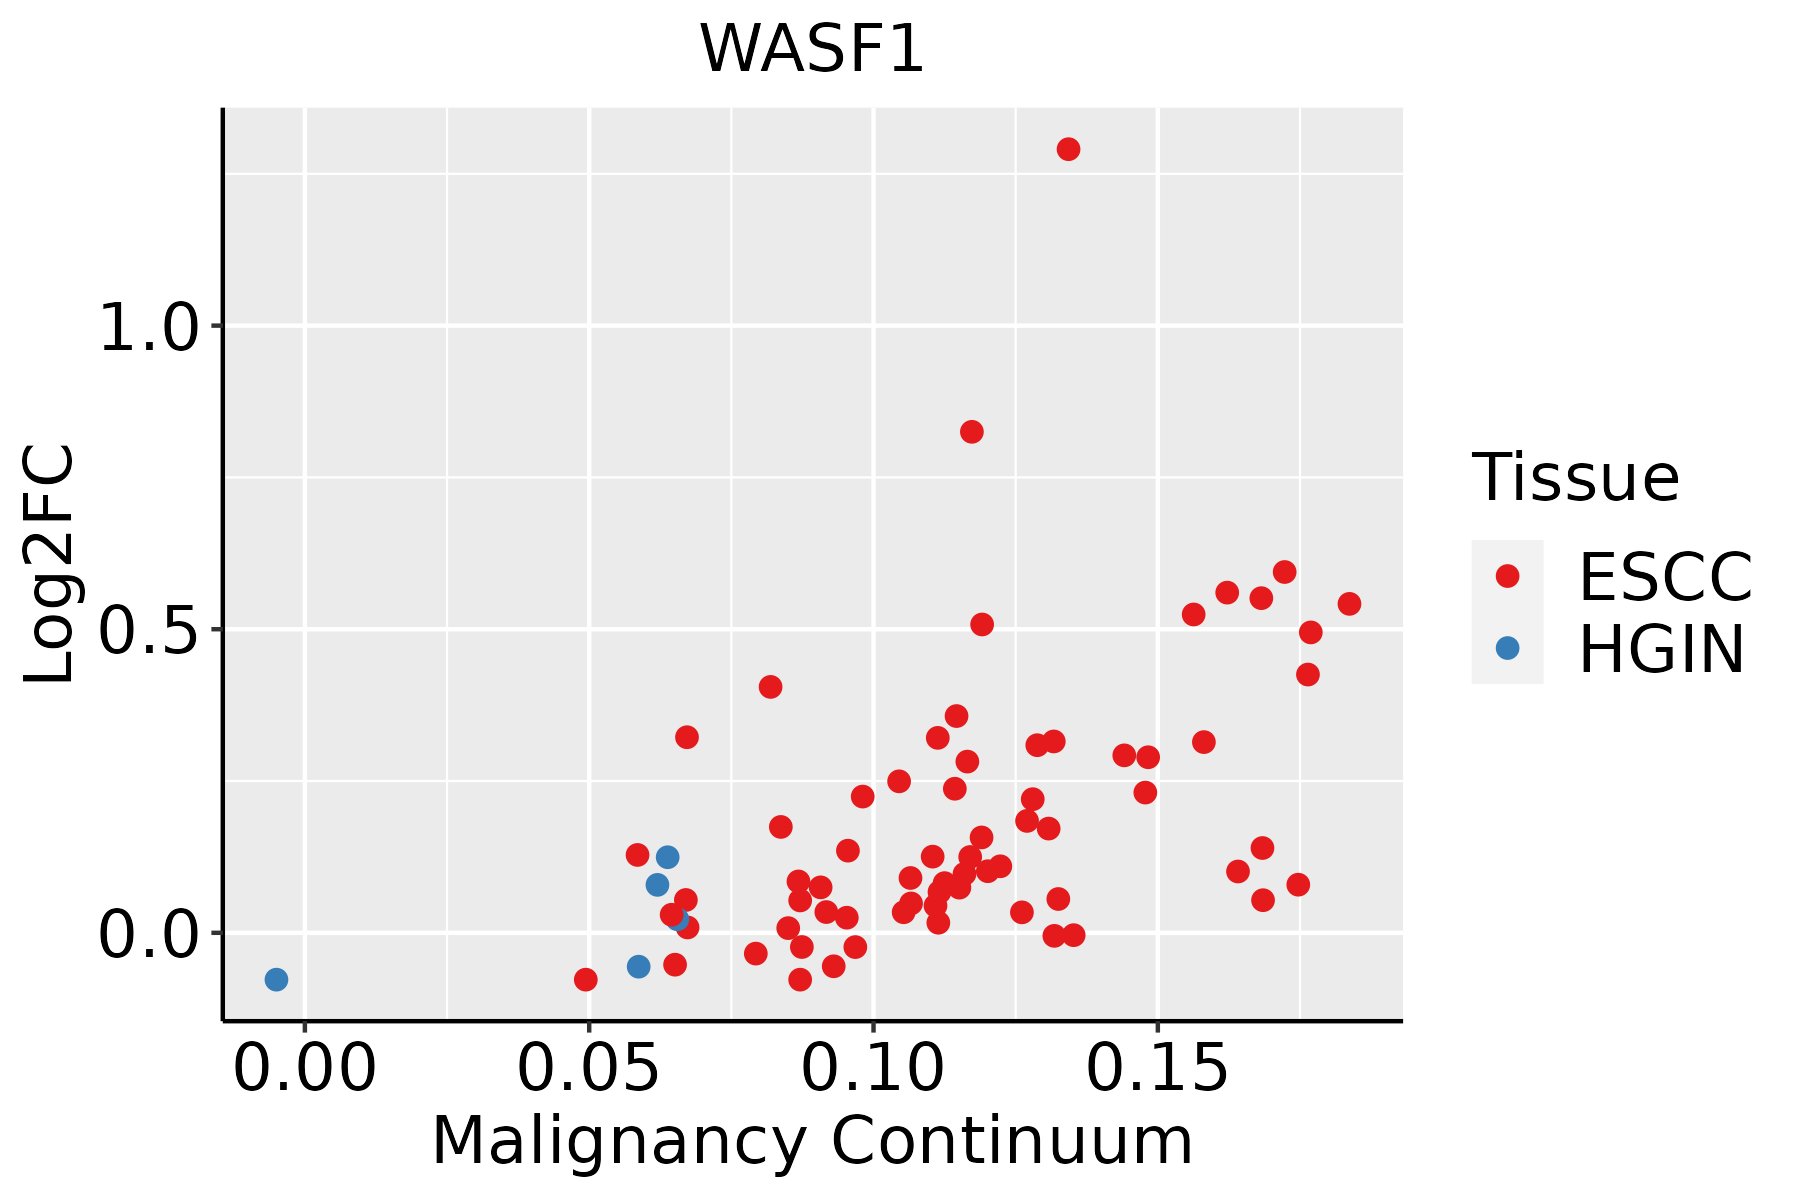
| GO:00166019 | Esophagus | ESCC | Rac protein signal transduction | 33/8552 | 42/18723 | 1.35e-05 | 1.23e-04 | 33 |
| GO:003083819 | Esophagus | ESCC | positive regulation of actin filament polymerization | 66/8552 | 99/18723 | 1.96e-05 | 1.72e-04 | 66 |
| GO:000815420 | Esophagus | ESCC | actin polymerization or depolymerization | 130/8552 | 218/18723 | 2.19e-05 | 1.88e-04 | 130 |
| GO:00991114 | Esophagus | ESCC | microtubule-based transport | 115/8552 | 190/18723 | 2.54e-05 | 2.15e-04 | 115 |
| GO:005165411 | Esophagus | ESCC | establishment of mitochondrion localization | 24/8552 | 29/18723 | 4.50e-05 | 3.55e-04 | 24 |
| GO:000689818 | Esophagus | ESCC | receptor-mediated endocytosis | 142/8552 | 244/18723 | 5.22e-05 | 4.05e-04 | 142 |
| GO:0030041110 | Esophagus | ESCC | actin filament polymerization | 114/8552 | 191/18723 | 6.46e-05 | 4.92e-04 | 114 |
| GO:000806419 | Esophagus | ESCC | regulation of actin polymerization or depolymerization | 112/8552 | 188/18723 | 8.31e-05 | 6.06e-04 | 112 |
| GO:199009017 | Esophagus | ESCC | cellular response to nerve growth factor stimulus | 38/8552 | 53/18723 | 1.10e-04 | 7.69e-04 | 38 |
| GO:003083218 | Esophagus | ESCC | regulation of actin filament length | 112/8552 | 189/18723 | 1.13e-04 | 7.85e-04 | 112 |
| GO:003083320 | Esophagus | ESCC | regulation of actin filament polymerization | 103/8552 | 172/18723 | 1.19e-04 | 8.15e-04 | 103 |
| GO:00705848 | Esophagus | ESCC | mitochondrion morphogenesis | 18/8552 | 21/18723 | 1.81e-04 | 1.16e-03 | 18 |
| GO:199008916 | Esophagus | ESCC | response to nerve growth factor | 39/8552 | 56/18723 | 2.44e-04 | 1.51e-03 | 39 |
| GO:00346431 | Esophagus | ESCC | establishment of mitochondrion localization, microtubule-mediated | 21/8552 | 26/18723 | 2.69e-04 | 1.63e-03 | 21 |
| GO:00474971 | Esophagus | ESCC | mitochondrion transport along microtubule | 21/8552 | 26/18723 | 2.69e-04 | 1.63e-03 | 21 |
| GO:00516463 | Esophagus | ESCC | mitochondrion localization | 35/8552 | 50/18723 | 4.33e-04 | 2.44e-03 | 35 |
| GO:003431415 | Esophagus | ESCC | Arp2/3 complex-mediated actin nucleation | 28/8552 | 39/18723 | 8.57e-04 | 4.40e-03 | 28 |
| GO:006056010 | Esophagus | ESCC | developmental growth involved in morphogenesis | 131/8552 | 234/18723 | 9.28e-04 | 4.73e-03 | 131 |
| GO:00726735 | Esophagus | ESCC | lamellipodium morphogenesis | 14/8552 | 17/18723 | 2.22e-03 | 9.78e-03 | 14 |
| GO:00343156 | Esophagus | ESCC | regulation of Arp2/3 complex-mediated actin nucleation | 16/8552 | 21/18723 | 4.47e-03 | 1.76e-02 | 16 |
| Pathway ID | Tissue | Disease Stage | Description | Gene Ratio | Bg Ratio | pvalue | p.adjust | qvalue | Count |
| hsa05131211 | Esophagus | ESCC | Shigellosis | 176/4205 | 247/8465 | 2.27e-12 | 4.01e-11 | 2.05e-11 | 176 |
| hsa05130211 | Esophagus | ESCC | Pathogenic Escherichia coli infection | 142/4205 | 197/8465 | 8.21e-11 | 1.06e-09 | 5.42e-10 | 142 |
| hsa05100211 | Esophagus | ESCC | Bacterial invasion of epithelial cells | 59/4205 | 77/8465 | 1.05e-06 | 6.76e-06 | 3.46e-06 | 59 |
| hsa0452030 | Esophagus | ESCC | Adherens junction | 69/4205 | 93/8465 | 1.08e-06 | 6.83e-06 | 3.50e-06 | 69 |
| hsa0466620 | Esophagus | ESCC | Fc gamma R-mediated phagocytosis | 63/4205 | 97/8465 | 1.63e-03 | 4.89e-03 | 2.50e-03 | 63 |
| hsa0481028 | Esophagus | ESCC | Regulation of actin cytoskeleton | 133/4205 | 229/8465 | 5.94e-03 | 1.48e-02 | 7.56e-03 | 133 |
| hsa052319 | Esophagus | ESCC | Choline metabolism in cancer | 61/4205 | 98/8465 | 7.97e-03 | 1.92e-02 | 9.84e-03 | 61 |
| hsa05131310 | Esophagus | ESCC | Shigellosis | 176/4205 | 247/8465 | 2.27e-12 | 4.01e-11 | 2.05e-11 | 176 |
| hsa05130310 | Esophagus | ESCC | Pathogenic Escherichia coli infection | 142/4205 | 197/8465 | 8.21e-11 | 1.06e-09 | 5.42e-10 | 142 |
| hsa05100310 | Esophagus | ESCC | Bacterial invasion of epithelial cells | 59/4205 | 77/8465 | 1.05e-06 | 6.76e-06 | 3.46e-06 | 59 |
| hsa04520114 | Esophagus | ESCC | Adherens junction | 69/4205 | 93/8465 | 1.08e-06 | 6.83e-06 | 3.50e-06 | 69 |
| hsa04666110 | Esophagus | ESCC | Fc gamma R-mediated phagocytosis | 63/4205 | 97/8465 | 1.63e-03 | 4.89e-03 | 2.50e-03 | 63 |
| hsa04810112 | Esophagus | ESCC | Regulation of actin cytoskeleton | 133/4205 | 229/8465 | 5.94e-03 | 1.48e-02 | 7.56e-03 | 133 |
| hsa0523114 | Esophagus | ESCC | Choline metabolism in cancer | 61/4205 | 98/8465 | 7.97e-03 | 1.92e-02 | 9.84e-03 | 61 |
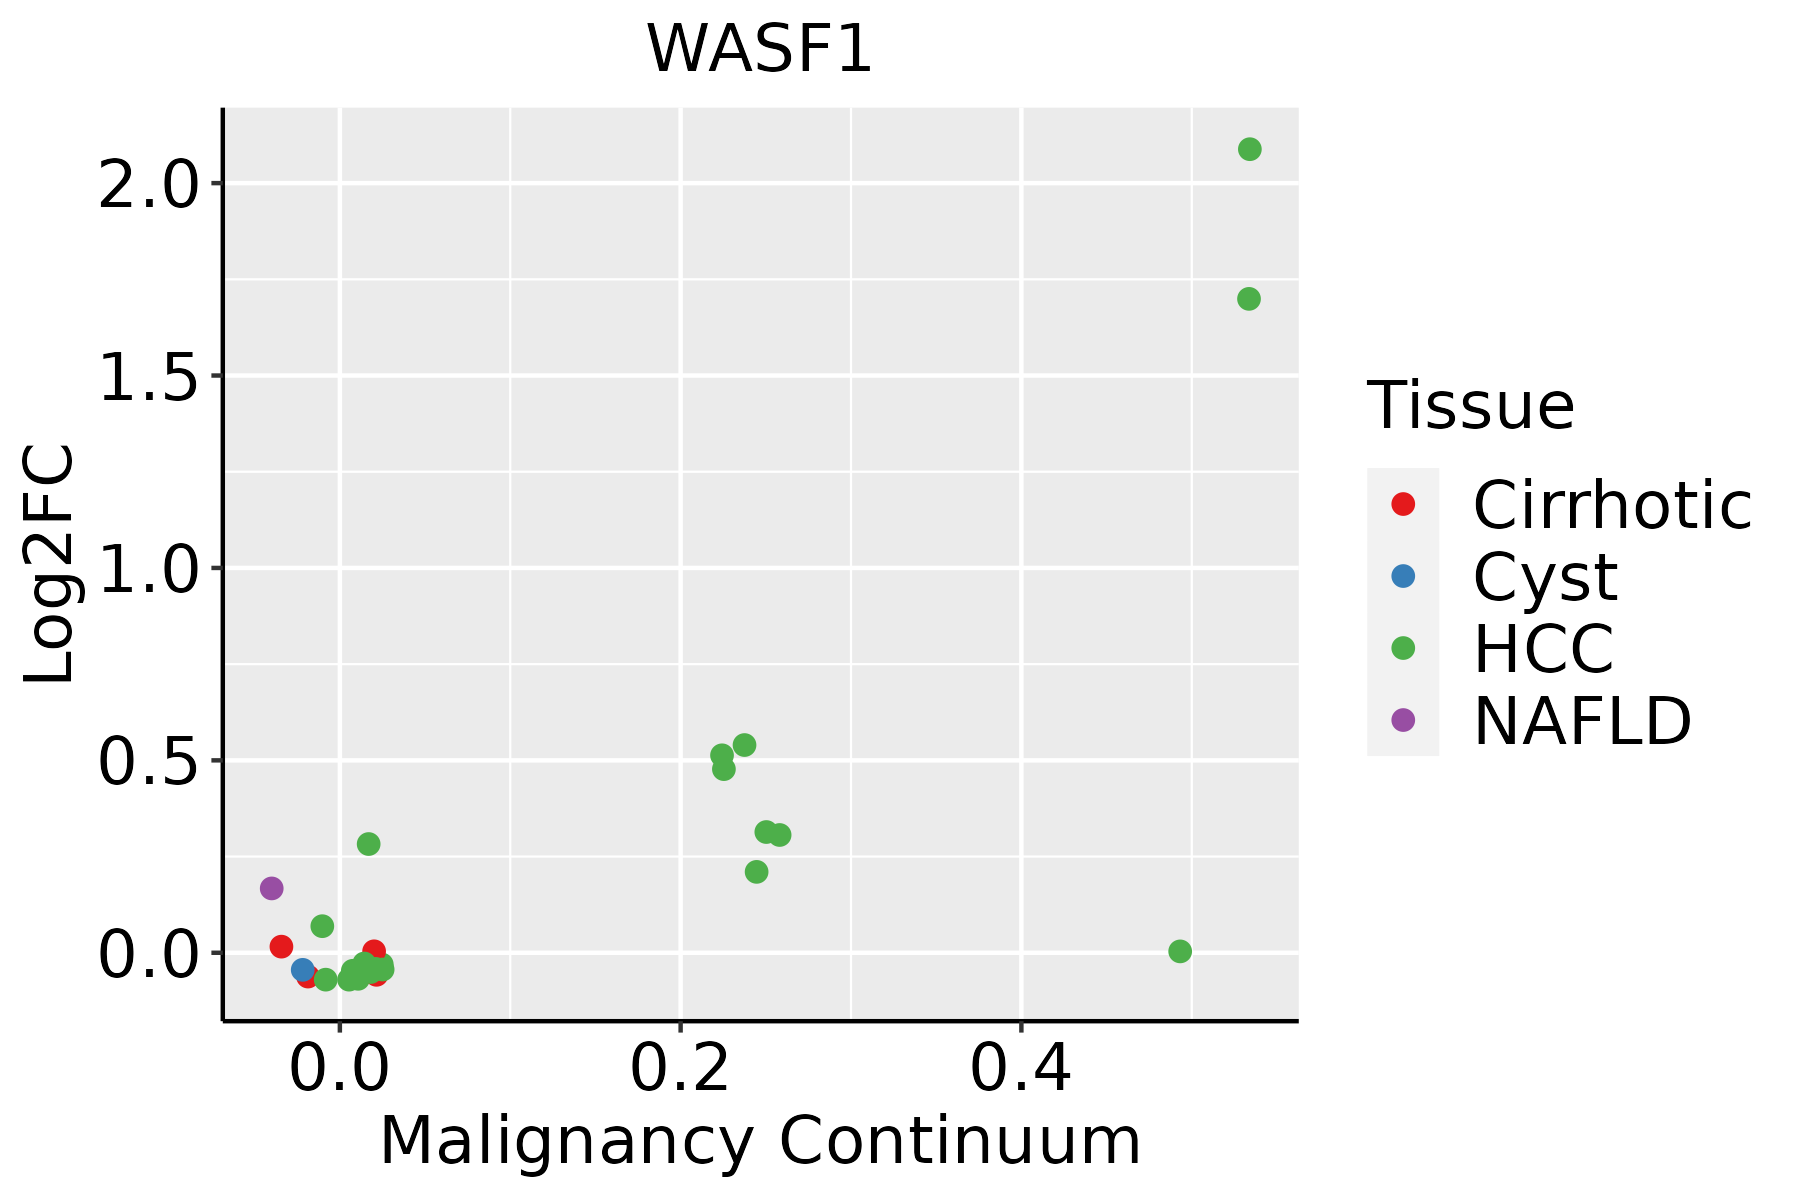
| hsa0513042 | Liver | HCC | Pathogenic Escherichia coli infection | 129/4020 | 197/8465 | 2.02e-07 | 2.50e-06 | 1.39e-06 | 129 |
| hsa0452042 | Liver | HCC | Adherens junction | 68/4020 | 93/8465 | 3.99e-07 | 4.46e-06 | 2.48e-06 | 68 |
| hsa0513142 | Liver | HCC | Shigellosis | 150/4020 | 247/8465 | 1.53e-05 | 1.04e-04 | 5.81e-05 | 150 |
| hsa0481041 | Liver | HCC | Regulation of actin cytoskeleton | 134/4020 | 229/8465 | 4.48e-04 | 1.94e-03 | 1.08e-03 | 134 |
| hsa0510022 | Liver | HCC | Bacterial invasion of epithelial cells | 51/4020 | 77/8465 | 6.67e-04 | 2.72e-03 | 1.52e-03 | 51 |
| hsa0466610 | Liver | HCC | Fc gamma R-mediated phagocytosis | 58/4020 | 97/8465 | 9.65e-03 | 2.52e-02 | 1.40e-02 | 58 |
| Hugo Symbol | Variant Class | Variant Classification | dbSNP RS | HGVSc | HGVSp | HGVSp Short | SWISSPROT | BIOTYPE | SIFT | PolyPhen | Tumor Sample Barcode | Tissue | Histology | Sex | Age | Stage | Therapy Types | Drugs | Outcome |
| WASF1 | SNV | Missense_Mutation | | c.692N>A | p.Pro231Gln | p.P231Q | Q92558 | protein_coding | deleterious(0.01) | benign(0.401) | TCGA-A8-A094-01 | Breast | breast invasive carcinoma | Female | >=65 | I/II | Unknown | Unknown | SD |
| WASF1 | SNV | Missense_Mutation | novel | c.664C>A | p.His222Asn | p.H222N | Q92558 | protein_coding | deleterious(0.02) | benign(0.005) | TCGA-AC-A8OP-01 | Breast | breast invasive carcinoma | Female | >=65 | I/II | Unknown | Unknown | SD |
| WASF1 | SNV | Missense_Mutation | | c.1384G>A | p.Ala462Thr | p.A462T | Q92558 | protein_coding | tolerated_low_confidence(0.58) | benign(0.007) | TCGA-AO-A0J2-01 | Breast | breast invasive carcinoma | Female | <65 | I/II | Chemotherapy | cyclophosphamide | SD |
| WASF1 | SNV | Missense_Mutation | | c.766N>T | p.Pro256Ser | p.P256S | Q92558 | protein_coding | deleterious(0.05) | probably_damaging(0.992) | TCGA-AO-A128-01 | Breast | breast invasive carcinoma | Female | <65 | I/II | Chemotherapy | doxorubicin | SD |
| WASF1 | SNV | Missense_Mutation | | c.232G>C | p.Val78Leu | p.V78L | Q92558 | protein_coding | deleterious(0) | benign(0.001) | TCGA-AR-A0TX-01 | Breast | breast invasive carcinoma | Female | <65 | I/II | Unknown | Unknown | SD |
| WASF1 | SNV | Missense_Mutation | | c.797N>C | p.Arg266Thr | p.R266T | Q92558 | protein_coding | tolerated(0.27) | probably_damaging(0.95) | TCGA-EW-A1J5-01 | Breast | breast invasive carcinoma | Female | <65 | I/II | Chemotherapy | adriamycin | SD |
| WASF1 | SNV | Missense_Mutation | | c.250N>A | p.Asp84Asn | p.D84N | Q92558 | protein_coding | deleterious(0) | probably_damaging(0.962) | TCGA-EW-A1J5-01 | Breast | breast invasive carcinoma | Female | <65 | I/II | Chemotherapy | adriamycin | SD |
| WASF1 | SNV | Missense_Mutation | | c.777N>C | p.Gln259His | p.Q259H | Q92558 | protein_coding | tolerated(0.12) | probably_damaging(0.969) | TCGA-C5-A1BQ-01 | Cervix | cervical & endocervical cancer | Female | >=65 | III/IV | Chemotherapy | cisplatin | CR |
| WASF1 | SNV | Missense_Mutation | novel | c.319N>G | p.Gln107Glu | p.Q107E | Q92558 | protein_coding | deleterious(0) | possibly_damaging(0.784) | TCGA-ZJ-AAXU-01 | Cervix | cervical & endocervical cancer | Female | <65 | I/II | Unknown | Unknown | SD |
| WASF1 | SNV | Missense_Mutation | | c.1390N>T | p.Gly464Cys | p.G464C | Q92558 | protein_coding | deleterious_low_confidence(0.01) | probably_damaging(0.996) | TCGA-A6-6780-01 | Colorectum | colon adenocarcinoma | Male | >=65 | I/II | Unknown | Unknown | SD |