
|
|||||
|
 | |
| |
| |
| |
| |
| |
|
Gene: VPS51 |
Gene summary for VPS51 |
| Gene information | Species | Human | Gene symbol | VPS51 | Gene ID | 738 |
| Gene name | VPS51 subunit of GARP complex | |
| Gene Alias | ANG2 | |
| Cytomap | 11q13.1 | |
| Gene Type | protein-coding | GO ID | GO:0006810 | UniProtAcc | Q9UID3 |
Top |
Malignant transformation analysis |
| Identification of the aberrant gene expression in precancerous and cancerous lesions by comparing the gene expression of stem-like cells in diseased tissues with normal stem cells |
| Entrez ID | Symbol | Replicates | Species | Organ | Tissue | Adj P-value | Log2FC | Malignancy |
| 738 | VPS51 | LZE2T | Human | Esophagus | ESCC | 1.40e-02 | 1.40e-01 | 0.082 |
| 738 | VPS51 | LZE4T | Human | Esophagus | ESCC | 9.17e-17 | 6.91e-02 | 0.0811 |
| 738 | VPS51 | LZE7T | Human | Esophagus | ESCC | 4.03e-06 | 8.28e-03 | 0.0667 |
| 738 | VPS51 | LZE8T | Human | Esophagus | ESCC | 5.38e-06 | -1.54e-01 | 0.067 |
| 738 | VPS51 | LZE22D1 | Human | Esophagus | HGIN | 9.84e-05 | 3.34e-02 | 0.0595 |
| 738 | VPS51 | LZE22T | Human | Esophagus | ESCC | 4.95e-06 | 2.39e-01 | 0.068 |
| 738 | VPS51 | LZE24T | Human | Esophagus | ESCC | 7.83e-17 | 4.90e-01 | 0.0596 |
| 738 | VPS51 | LZE21T | Human | Esophagus | ESCC | 3.58e-02 | 1.12e-01 | 0.0655 |
| 738 | VPS51 | P1T-E | Human | Esophagus | ESCC | 8.76e-13 | 2.65e-01 | 0.0875 |
| 738 | VPS51 | P2T-E | Human | Esophagus | ESCC | 2.95e-32 | 4.49e-01 | 0.1177 |
| 738 | VPS51 | P4T-E | Human | Esophagus | ESCC | 7.93e-29 | 5.28e-01 | 0.1323 |
| 738 | VPS51 | P5T-E | Human | Esophagus | ESCC | 8.77e-22 | 1.81e-01 | 0.1327 |
| 738 | VPS51 | P8T-E | Human | Esophagus | ESCC | 3.23e-31 | 5.52e-01 | 0.0889 |
| 738 | VPS51 | P9T-E | Human | Esophagus | ESCC | 4.83e-14 | 2.87e-01 | 0.1131 |
| 738 | VPS51 | P10T-E | Human | Esophagus | ESCC | 1.53e-44 | 9.11e-01 | 0.116 |
| 738 | VPS51 | P11T-E | Human | Esophagus | ESCC | 3.83e-18 | 7.50e-01 | 0.1426 |
| 738 | VPS51 | P12T-E | Human | Esophagus | ESCC | 1.47e-29 | 4.95e-01 | 0.1122 |
| 738 | VPS51 | P15T-E | Human | Esophagus | ESCC | 1.53e-22 | 6.82e-01 | 0.1149 |
| 738 | VPS51 | P16T-E | Human | Esophagus | ESCC | 5.62e-50 | 9.24e-01 | 0.1153 |
| 738 | VPS51 | P17T-E | Human | Esophagus | ESCC | 2.35e-12 | 7.52e-01 | 0.1278 |
| Page: 1 2 3 4 5 6 7 |
| Tissue | Expression Dynamics | Abbreviation |
| Esophagus | 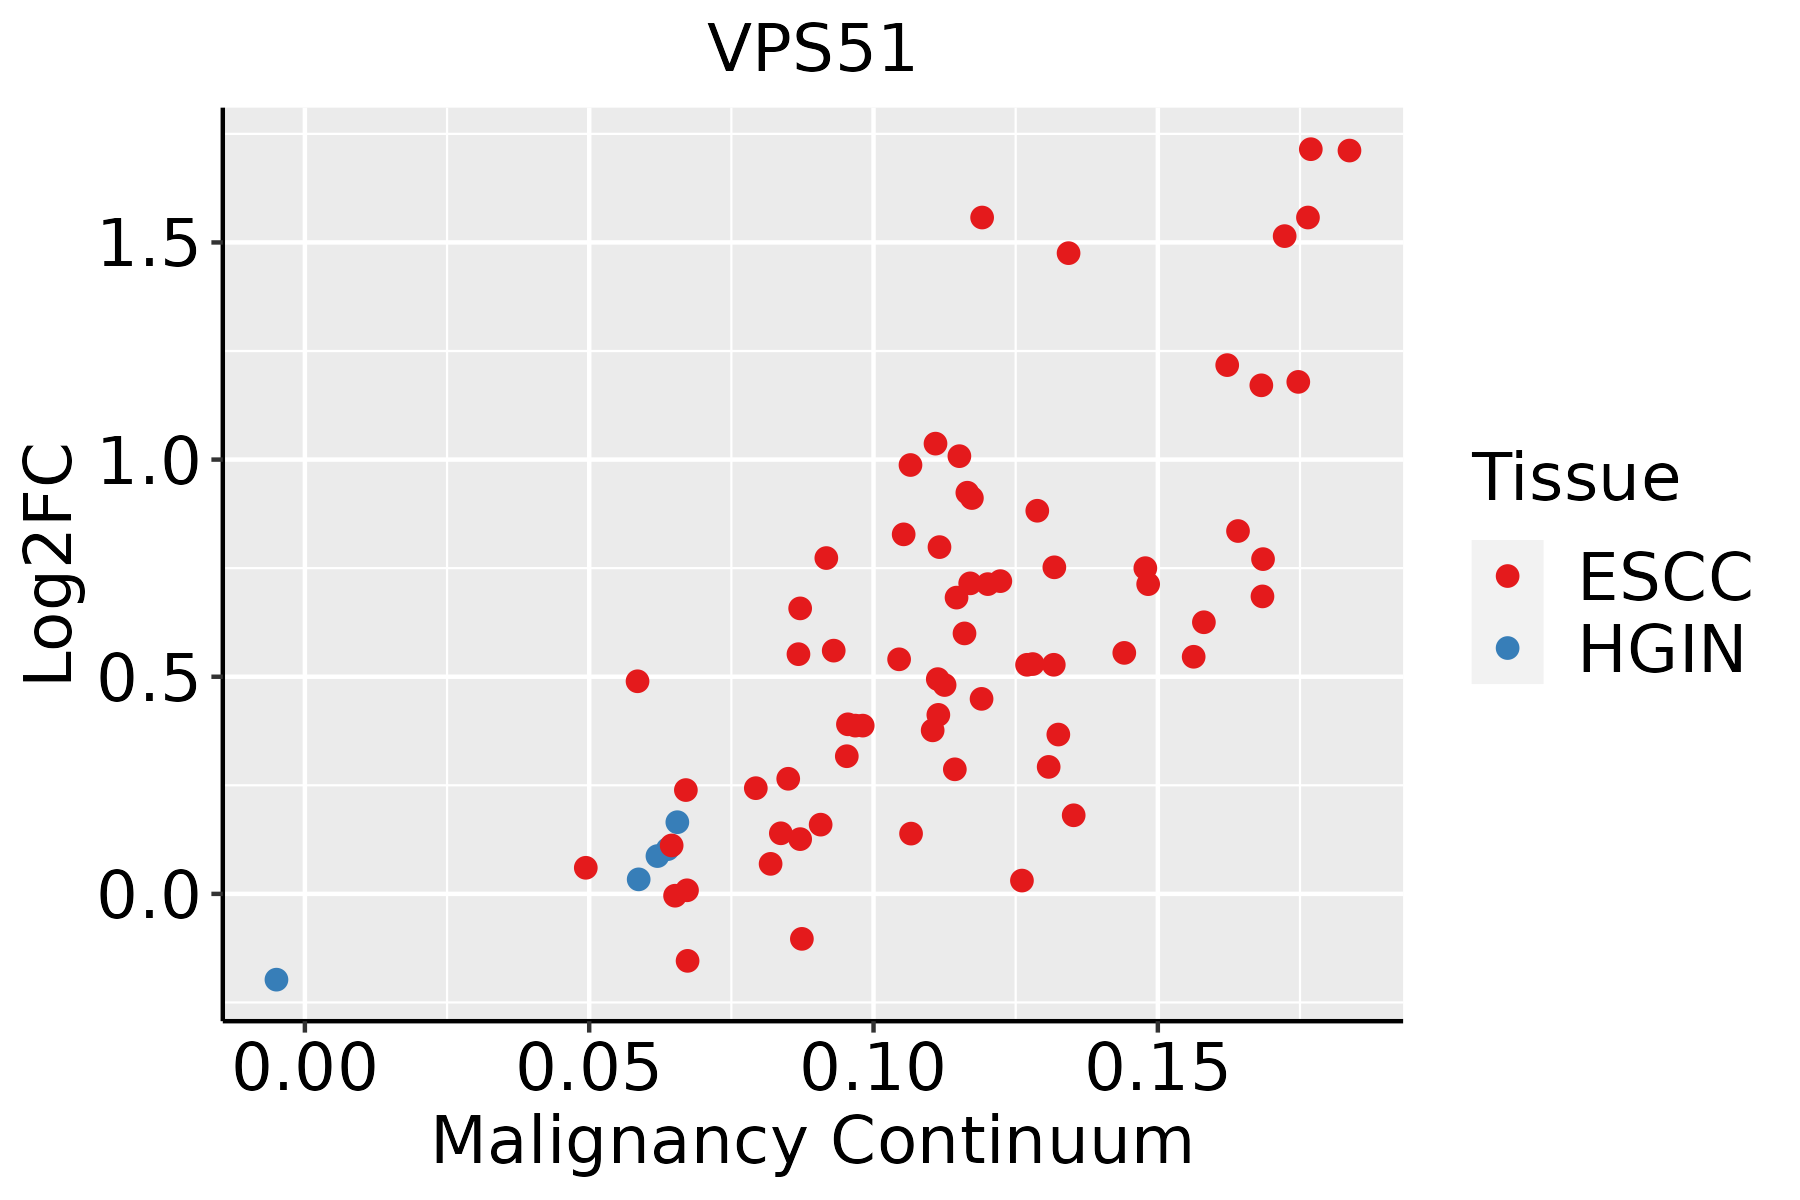 | ESCC: Esophageal squamous cell carcinoma |
| HGIN: High-grade intraepithelial neoplasias | ||
| LGIN: Low-grade intraepithelial neoplasias | ||
| Liver | 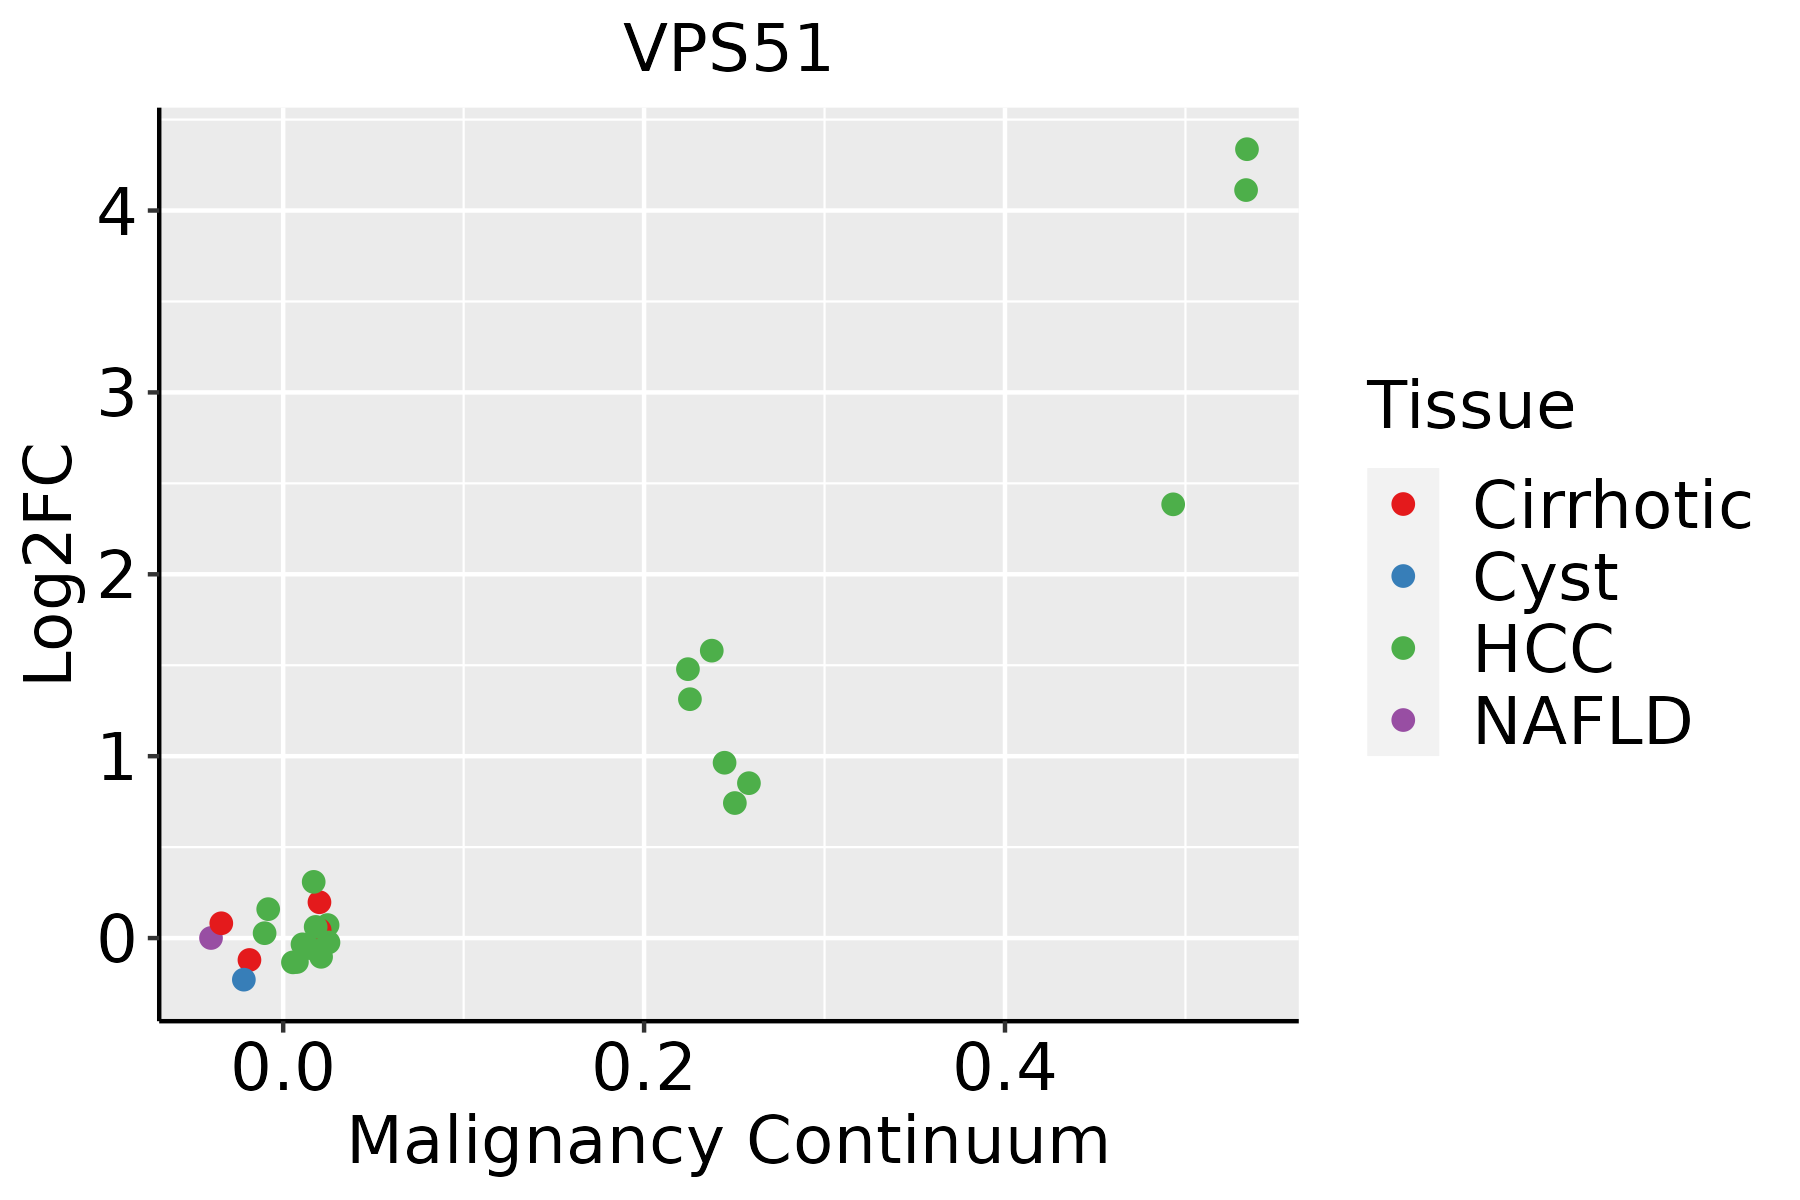 | HCC: Hepatocellular carcinoma |
| NAFLD: Non-alcoholic fatty liver disease | ||
| Oral Cavity | 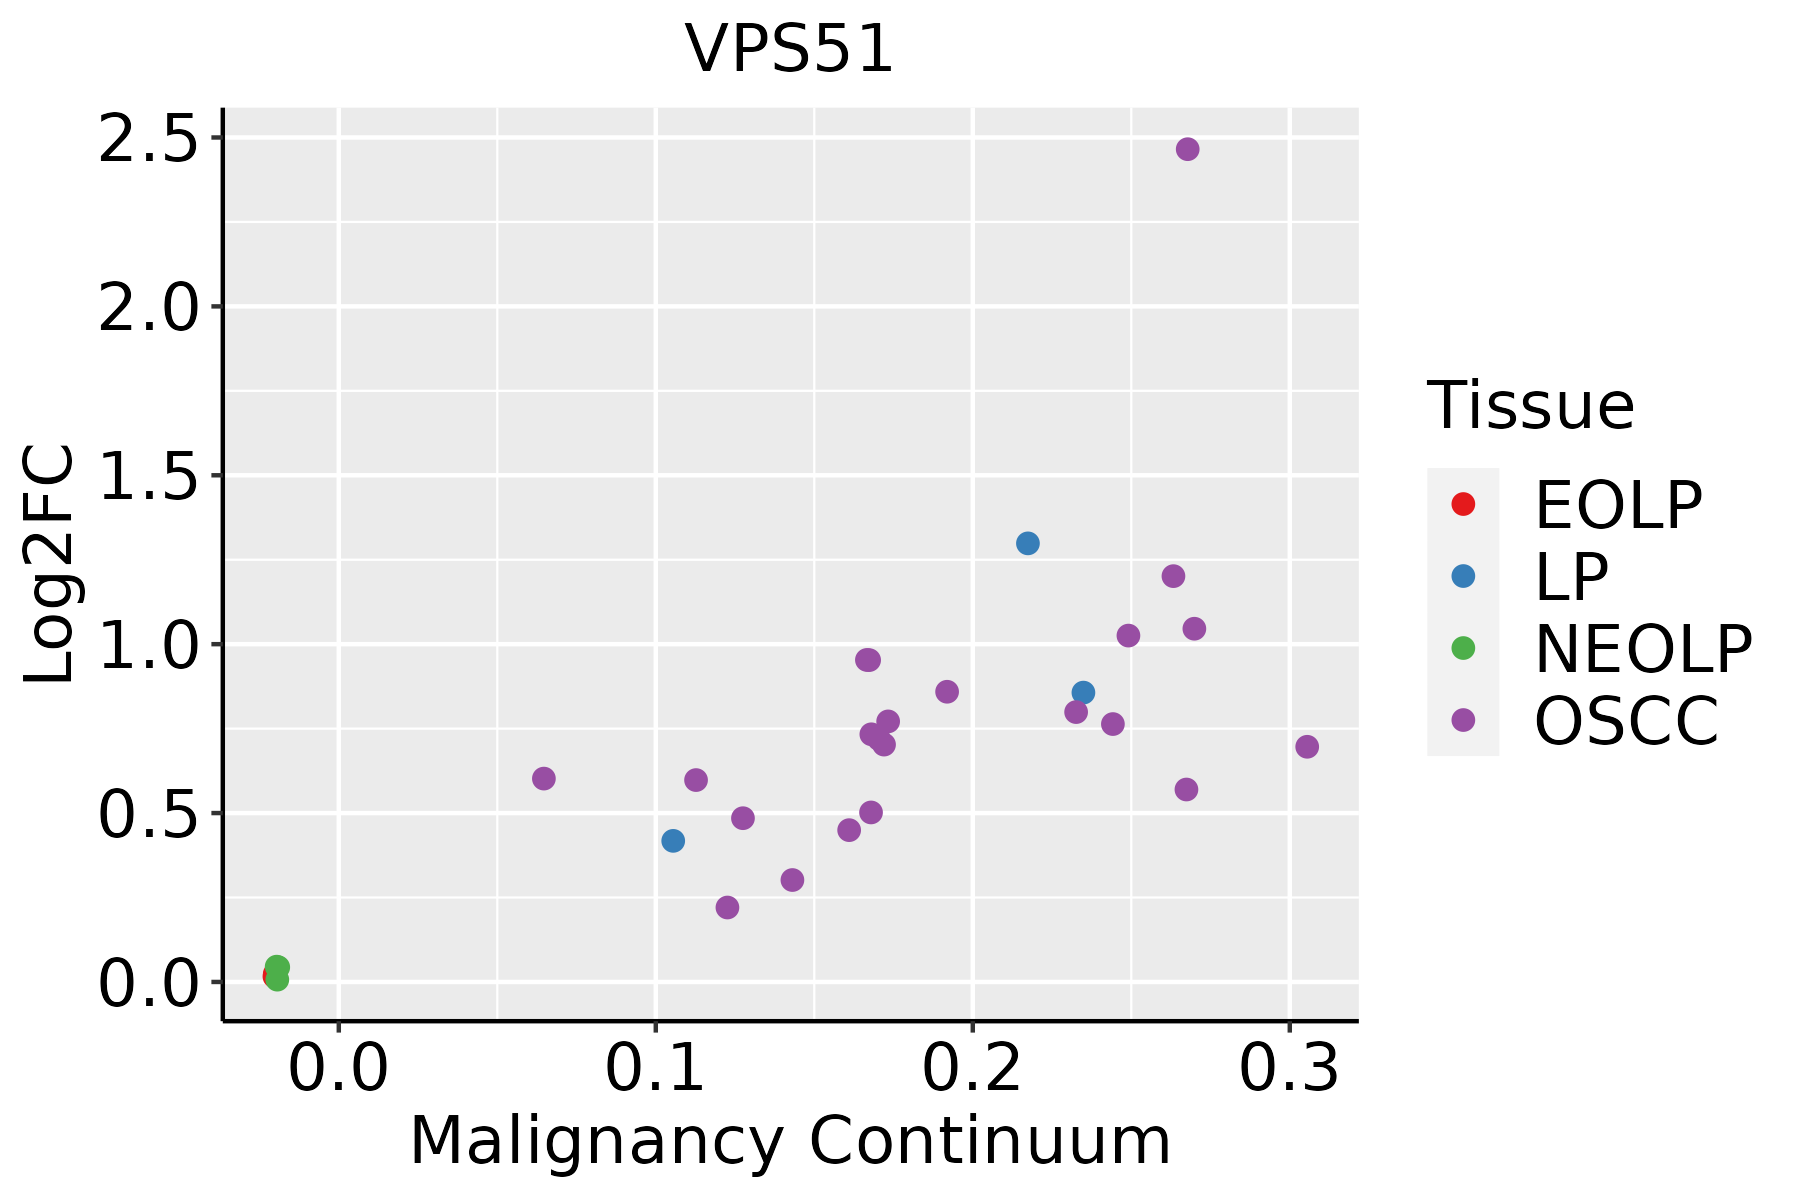 | EOLP: Erosive Oral lichen planus |
| LP: leukoplakia | ||
| NEOLP: Non-erosive oral lichen planus | ||
| OSCC: Oral squamous cell carcinoma | ||
| Prostate | 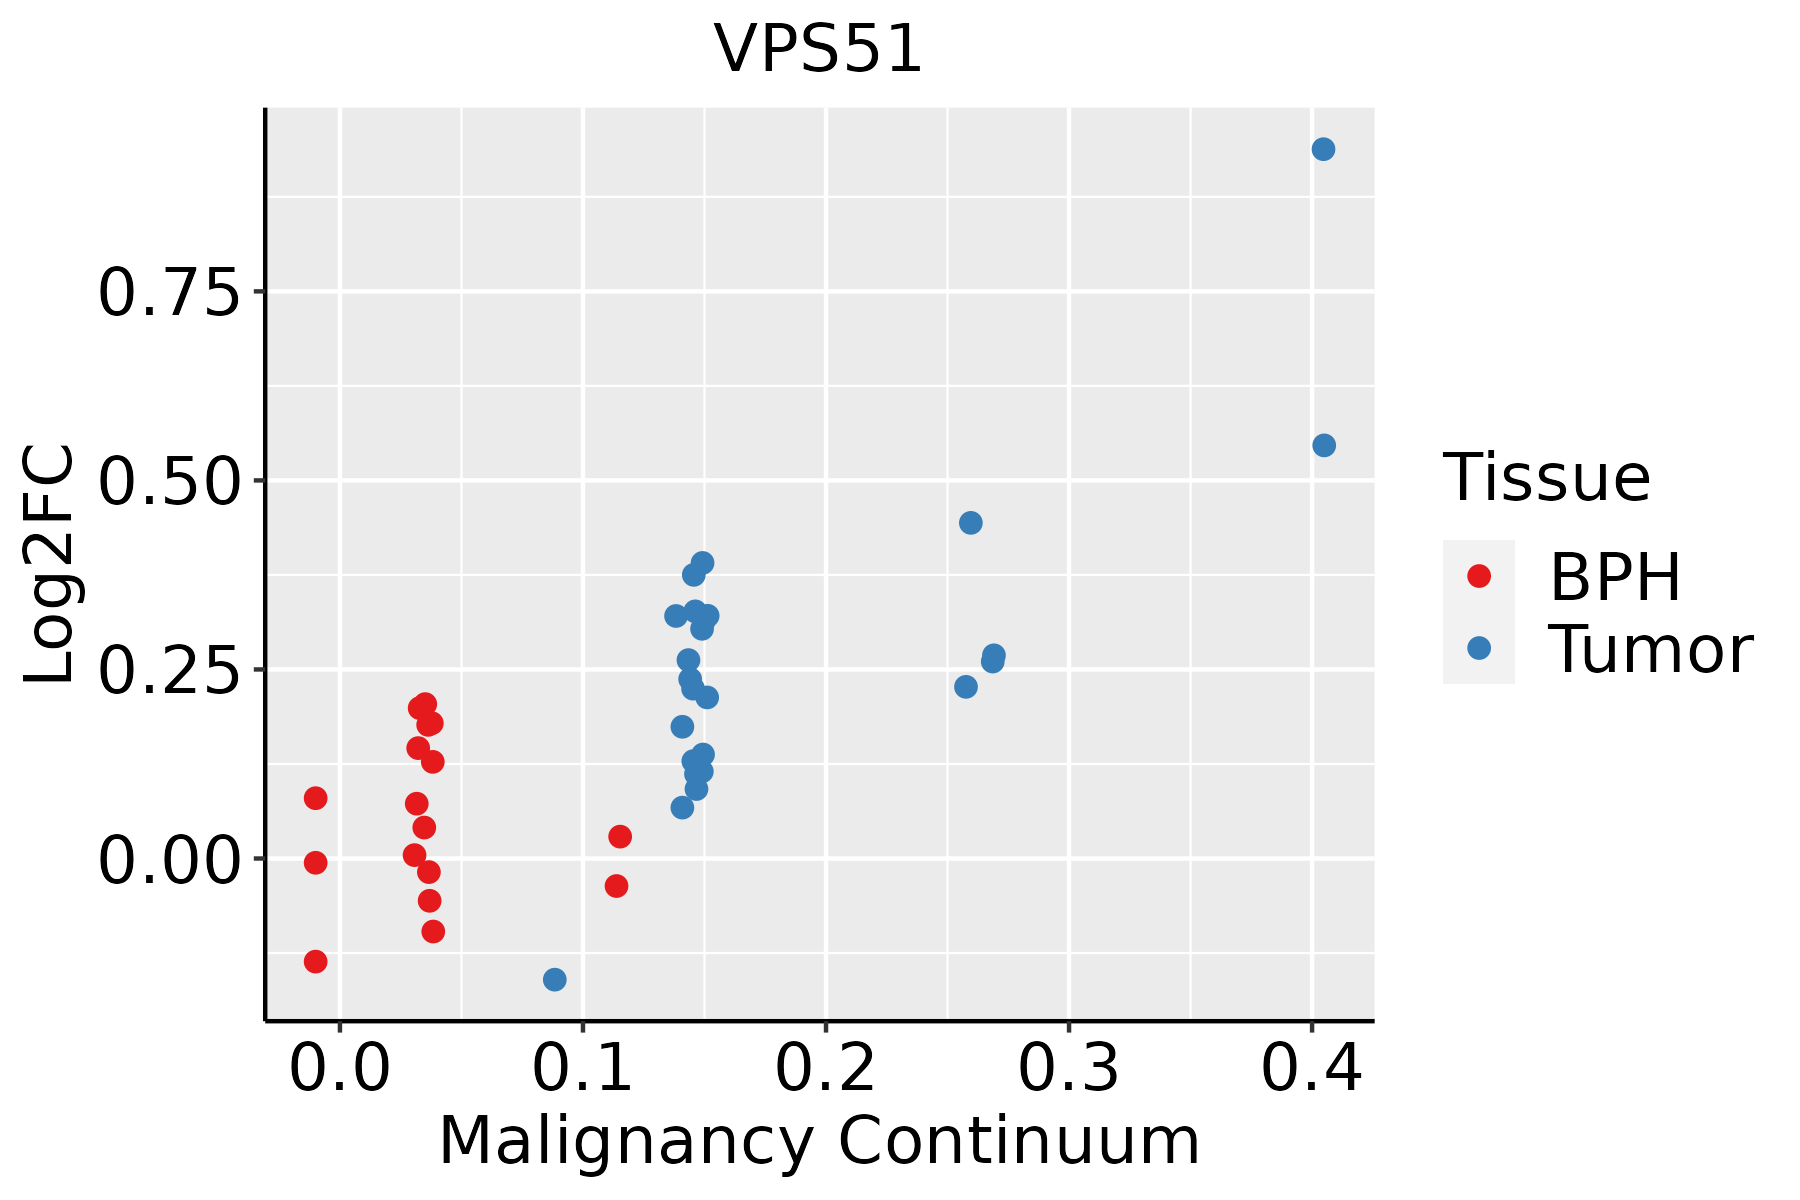 | BPH: Benign Prostatic Hyperplasia |
| Skin | 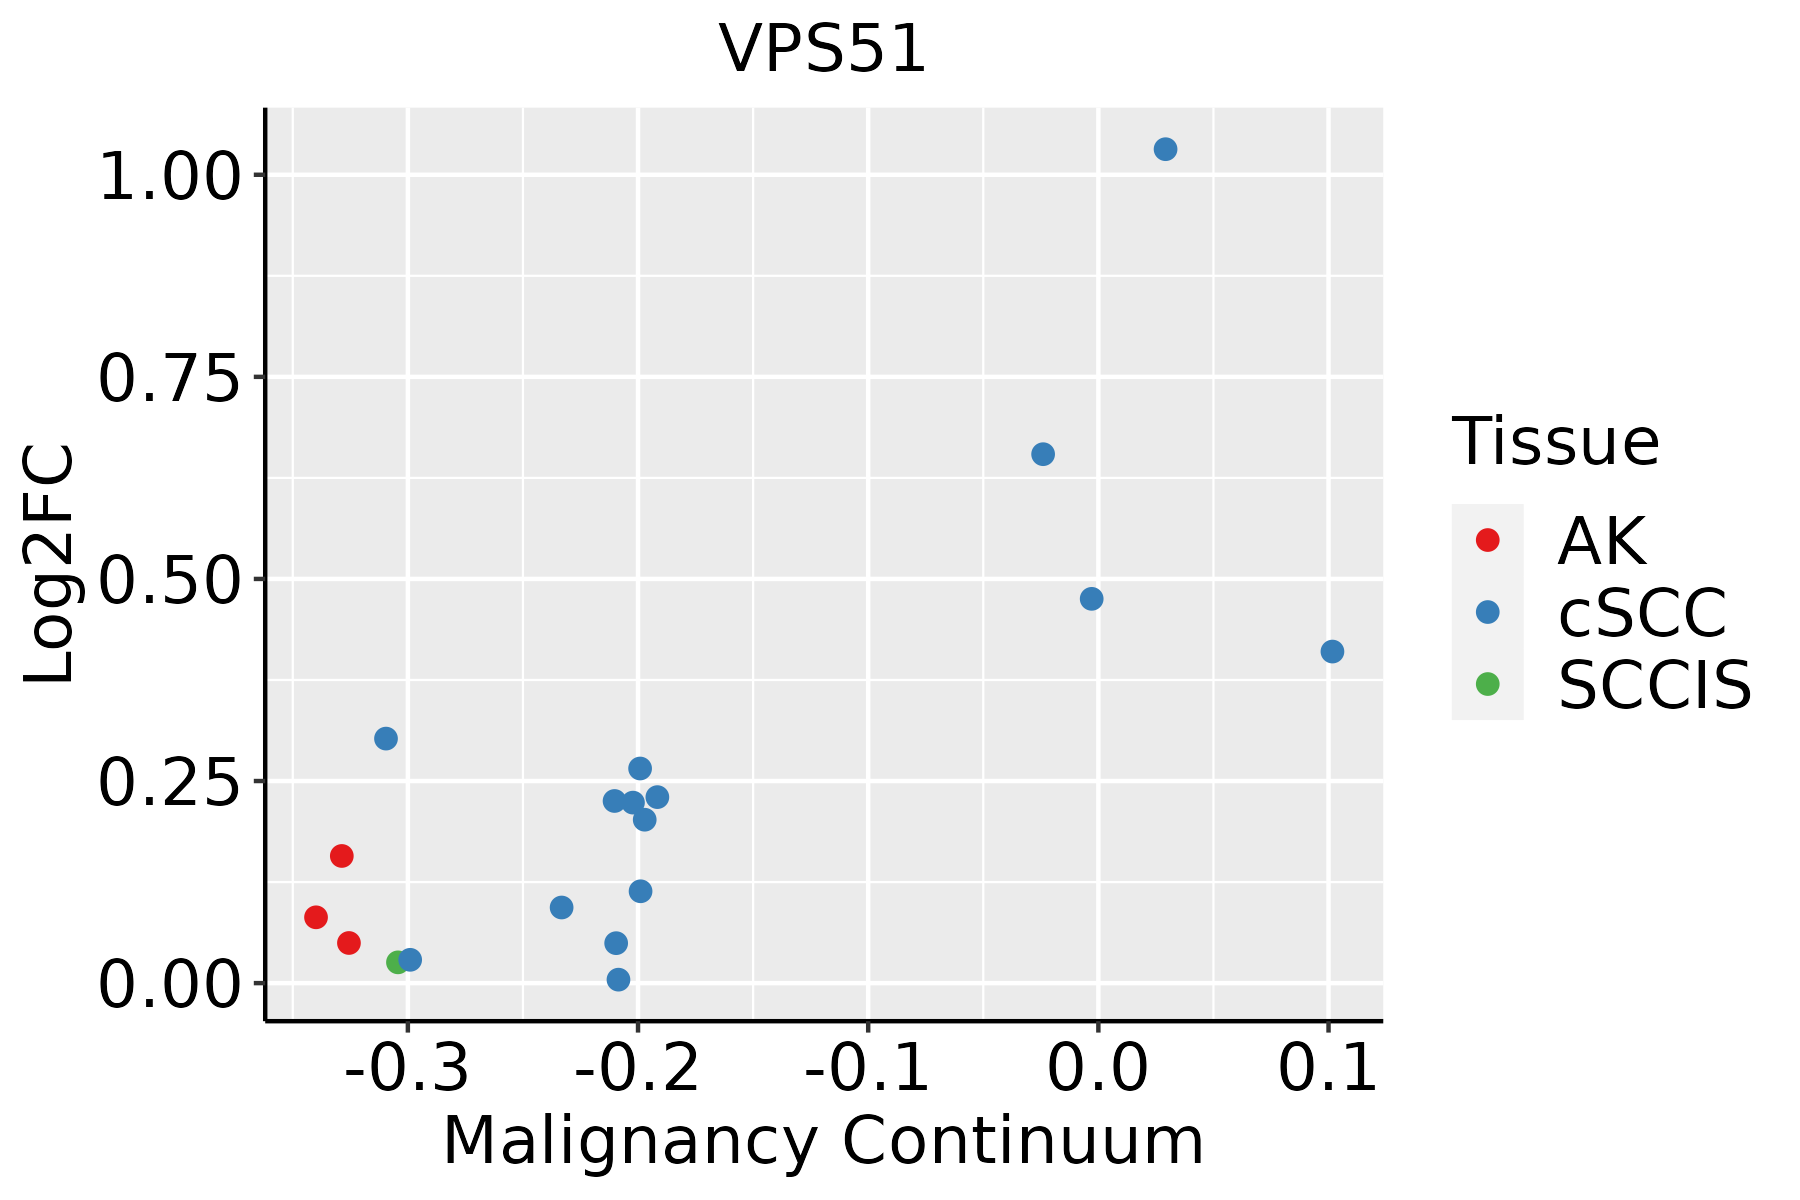 | AK: Actinic keratosis |
| cSCC: Cutaneous squamous cell carcinoma | ||
| SCCIS:squamous cell carcinoma in situ | ||
| Thyroid | 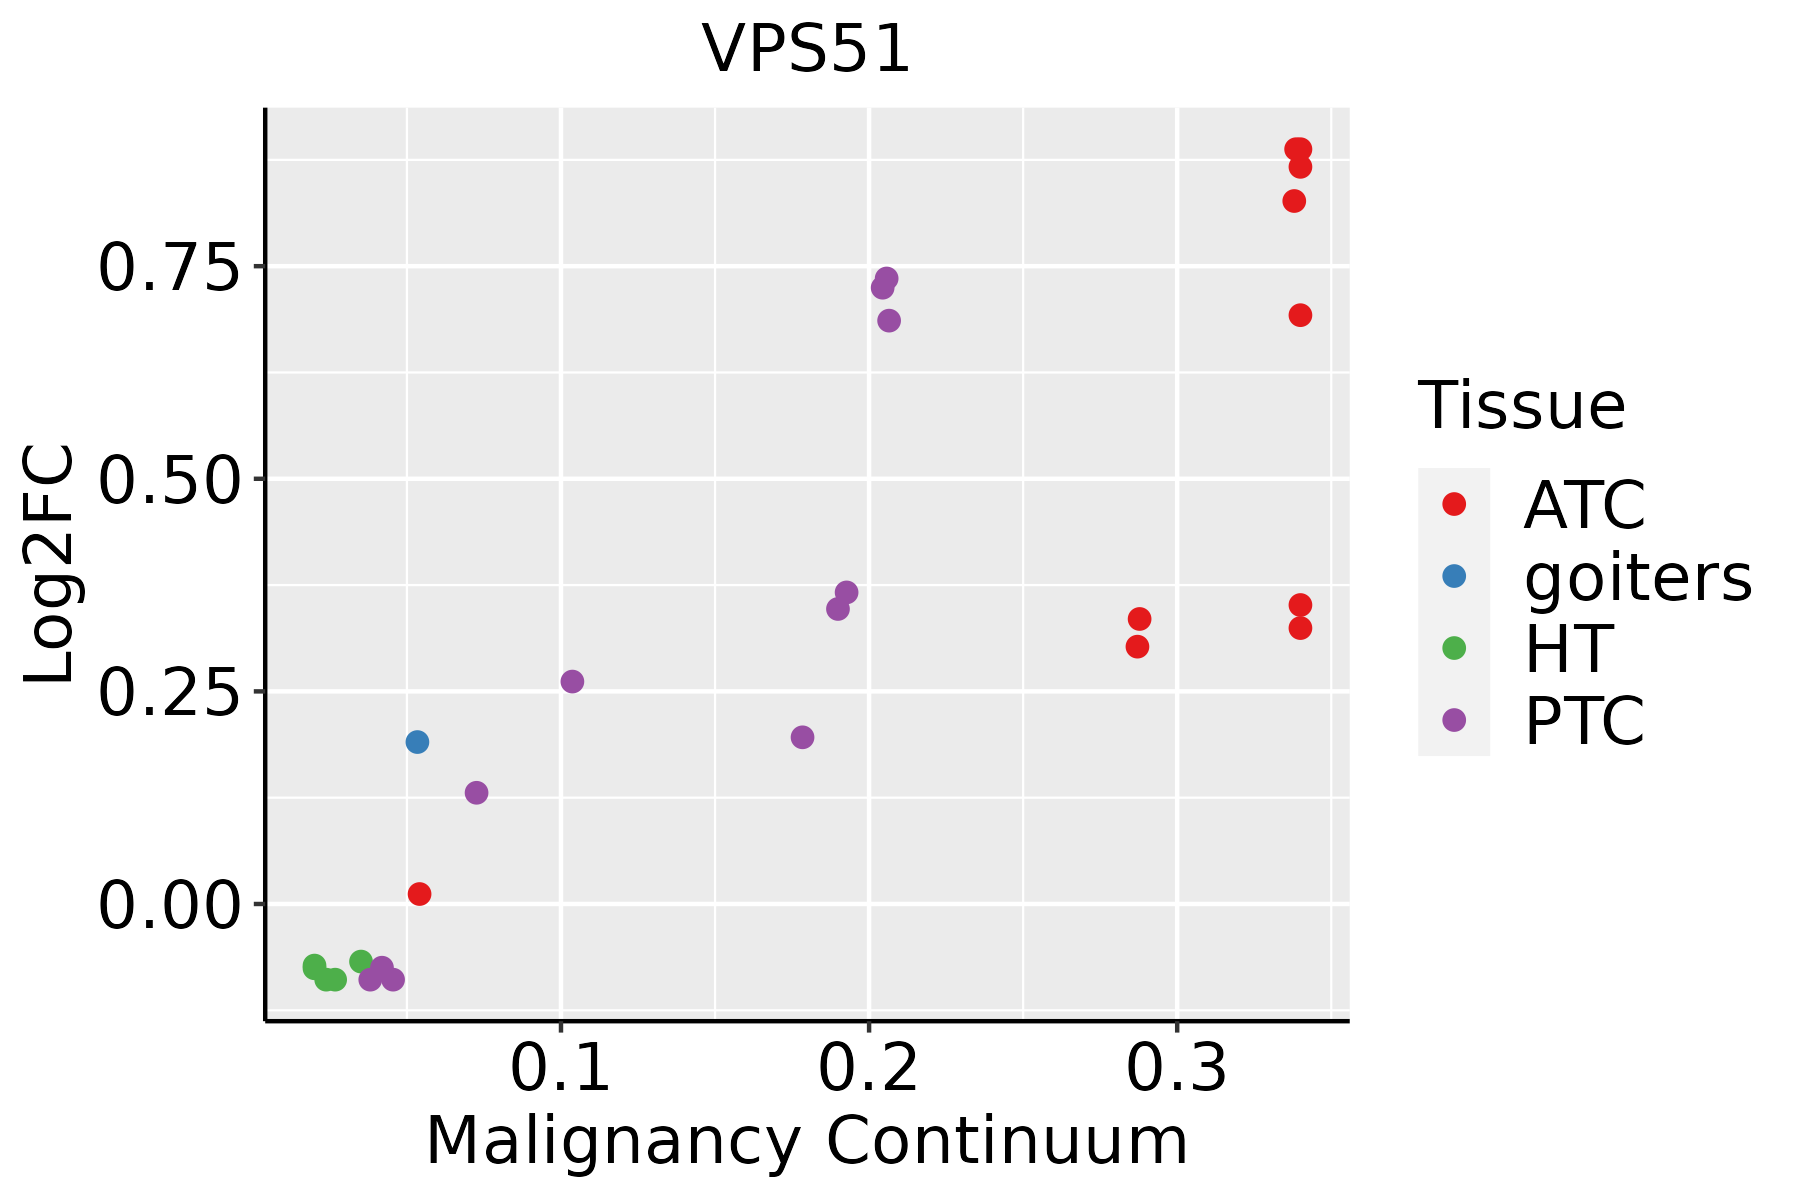 | ATC: Anaplastic thyroid cancer |
| HT: Hashimoto's thyroiditis | ||
| PTC: Papillary thyroid cancer |
| ∗log2FC in expression of this searched gene in stem-like cells from each diseased tissue sample relative to stem-like cells in normal samples in each tissue plotted against the malignancy continuum. Samples are colored based on if they are from different disease stage. |
Top |
Malignant transformation related pathway analysis |
| Find out the enriched GO biological processes and KEGG pathways involved in transition from healthy to precancer to cancer |
| Tissue | Disease Stage | Enriched GO biological Processes |
| Colorectum | AD |  |
| Colorectum | SER |  |
| Colorectum | MSS |  |
| Colorectum | MSI-H |  |
| Colorectum | FAP |  |
| ∗Top 15 enriched GO BP terms are showed in the bar plot of each disease state in each tissue. Each row represents a significant GO biological process which is colored according to the -log10(p.adjust). |
| Page: 1 2 3 4 5 6 7 8 9 |
| GO ID | Tissue | Disease Stage | Description | Gene Ratio | Bg Ratio | pvalue | p.adjust | Count |
| GO:001087611 | Liver | Cirrhotic | lipid localization | 147/4634 | 448/18723 | 6.24e-05 | 7.12e-04 | 147 |
| GO:000686911 | Liver | Cirrhotic | lipid transport | 128/4634 | 398/18723 | 4.54e-04 | 3.69e-03 | 128 |
| GO:004214711 | Liver | Cirrhotic | retrograde transport, endosome to Golgi | 34/4634 | 91/18723 | 5.01e-03 | 2.60e-02 | 34 |
| GO:004819321 | Liver | HCC | Golgi vesicle transport | 217/7958 | 296/18723 | 2.58e-27 | 1.02e-24 | 217 |
| GO:001619721 | Liver | HCC | endosomal transport | 154/7958 | 230/18723 | 4.74e-14 | 2.95e-12 | 154 |
| GO:001648221 | Liver | HCC | cytosolic transport | 117/7958 | 168/18723 | 8.83e-13 | 4.48e-11 | 117 |
| GO:000703421 | Liver | HCC | vacuolar transport | 108/7958 | 157/18723 | 2.22e-11 | 8.69e-10 | 108 |
| GO:009887621 | Liver | HCC | vesicle-mediated transport to the plasma membrane | 92/7958 | 136/18723 | 2.57e-09 | 7.07e-08 | 92 |
| GO:00070302 | Liver | HCC | Golgi organization | 99/7958 | 157/18723 | 1.54e-07 | 2.85e-06 | 99 |
| GO:000704121 | Liver | HCC | lysosomal transport | 76/7958 | 114/18723 | 1.56e-07 | 2.88e-06 | 76 |
| GO:004214721 | Liver | HCC | retrograde transport, endosome to Golgi | 61/7958 | 91/18723 | 1.94e-06 | 2.68e-05 | 61 |
| GO:00324562 | Liver | HCC | endocytic recycling | 48/7958 | 73/18723 | 5.07e-05 | 4.83e-04 | 48 |
| GO:001087621 | Liver | HCC | lipid localization | 228/7958 | 448/18723 | 1.80e-04 | 1.41e-03 | 228 |
| GO:000686921 | Liver | HCC | lipid transport | 198/7958 | 398/18723 | 1.92e-03 | 9.78e-03 | 198 |
| GO:004819315 | Oral cavity | OSCC | Golgi vesicle transport | 209/7305 | 296/18723 | 1.39e-28 | 6.30e-26 | 209 |
| GO:00161979 | Oral cavity | OSCC | endosomal transport | 141/7305 | 230/18723 | 5.40e-12 | 2.06e-10 | 141 |
| GO:000703410 | Oral cavity | OSCC | vacuolar transport | 103/7305 | 157/18723 | 1.25e-11 | 4.44e-10 | 103 |
| GO:00164829 | Oral cavity | OSCC | cytosolic transport | 106/7305 | 168/18723 | 2.08e-10 | 5.90e-09 | 106 |
| GO:00070307 | Oral cavity | OSCC | Golgi organization | 92/7305 | 157/18723 | 4.96e-07 | 7.27e-06 | 92 |
| GO:00070418 | Oral cavity | OSCC | lysosomal transport | 69/7305 | 114/18723 | 2.62e-06 | 3.26e-05 | 69 |
| Page: 1 2 3 4 5 |
| Pathway ID | Tissue | Disease Stage | Description | Gene Ratio | Bg Ratio | pvalue | p.adjust | qvalue | Count |
| Page: 1 |
Top |
Cell-cell communication analysis |
| Identification of potential cell-cell interactions between two cell types and their ligand-receptor pairs for different disease states |
| Ligand | Receptor | LRpair | Pathway | Tissue | Disease Stage |
| Page: 1 |
Top |
Single-cell gene regulatory network inference analysis |
| Find out the significant the regulons (TFs) and the target genes of each regulon across cell types for different disease states |
| TF | Cell Type | Tissue | Disease Stage | Target Gene | RSS | Regulon Activity |
| ∗The dot plots of a searched regulon are shown for all cell subpopulations in each disease state of each tissue based on the regulon specific score inferred using pySCENIC and by calculating the average expression. |
| Page: 1 |
Top |
Somatic mutation of malignant transformation related genes |
| Annotation of somatic variants for genes involved in malignant transformation |
| Hugo Symbol | Variant Class | Variant Classification | dbSNP RS | HGVSc | HGVSp | HGVSp Short | SWISSPROT | BIOTYPE | SIFT | PolyPhen | Tumor Sample Barcode | Tissue | Histology | Sex | Age | Stage | Therapy Types | Drugs | Outcome |
| VPS51 | SNV | Missense_Mutation | rs375386887 | c.1721N>A | p.Arg574Gln | p.R574Q | Q9UID3 | protein_coding | tolerated(0.48) | benign(0.014) | TCGA-B6-A409-01 | Breast | breast invasive carcinoma | Female | <65 | III/IV | Chemotherapy | cyclophosphamide | PD |
| VPS51 | SNV | Missense_Mutation | rs144624856 | c.1717C>T | p.Arg573Trp | p.R573W | Q9UID3 | protein_coding | deleterious(0) | possibly_damaging(0.613) | TCGA-BH-A5J0-01 | Breast | breast invasive carcinoma | Female | <65 | I/II | Unknown | Unknown | SD |
| VPS51 | insertion | Frame_Shift_Ins | novel | c.429_430insAATGTGTATATGT | p.Ala144AsnfsTer43 | p.A144Nfs*43 | Q9UID3 | protein_coding | TCGA-AN-A03Y-01 | Breast | breast invasive carcinoma | Female | >=65 | I/II | Unknown | Unknown | SD | ||
| VPS51 | SNV | Missense_Mutation | rs377434441 | c.307N>A | p.Asp103Asn | p.D103N | Q9UID3 | protein_coding | tolerated(0.06) | probably_damaging(0.97) | TCGA-2W-A8YY-01 | Cervix | cervical & endocervical cancer | Female | <65 | I/II | Chemotherapy | cisplatin | CR |
| VPS51 | SNV | Missense_Mutation | c.315N>C | p.Gln105His | p.Q105H | Q9UID3 | protein_coding | deleterious(0) | probably_damaging(1) | TCGA-DR-A0ZM-01 | Cervix | cervical & endocervical cancer | Female | <65 | III/IV | Unspecific | Cisplatin | SD | |
| VPS51 | SNV | Missense_Mutation | novel | c.288N>T | p.Gln96His | p.Q96H | Q9UID3 | protein_coding | tolerated(0.06) | probably_damaging(0.945) | TCGA-VS-A94X-01 | Cervix | cervical & endocervical cancer | Female | <65 | I/II | Chemotherapy | cisplatin | PD |
| VPS51 | SNV | Missense_Mutation | c.412N>T | p.Arg138Trp | p.R138W | Q9UID3 | protein_coding | tolerated(0.09) | possibly_damaging(0.903) | TCGA-AD-6895-01 | Colorectum | colon adenocarcinoma | Male | >=65 | III/IV | Unknown | Unknown | SD | |
| VPS51 | SNV | Missense_Mutation | c.1749G>T | p.Gln583His | p.Q583H | Q9UID3 | protein_coding | deleterious(0) | probably_damaging(0.987) | TCGA-DM-A1HB-01 | Colorectum | colon adenocarcinoma | Male | >=65 | III/IV | Unknown | Unknown | SD | |
| VPS51 | SNV | Missense_Mutation | rs780357113 | c.1873G>A | p.Val625Met | p.V625M | Q9UID3 | protein_coding | tolerated(0.18) | possibly_damaging(0.808) | TCGA-DM-A28A-01 | Colorectum | colon adenocarcinoma | Male | >=65 | III/IV | Unknown | Unknown | SD |
| VPS51 | SNV | Missense_Mutation | c.934G>T | p.Val312Leu | p.V312L | Q9UID3 | protein_coding | tolerated(1) | benign(0.013) | TCGA-G4-6586-01 | Colorectum | colon adenocarcinoma | Female | >=65 | I/II | Unknown | Unknown | SD |
| Page: 1 2 3 4 5 6 |
Top |
Related drugs of malignant transformation related genes |
| Identification of chemicals and drugs interact with genes involved in malignant transfromation |
| (DGIdb 4.0) |
| Entrez ID | Symbol | Category | Interaction Types | Drug Claim Name | Drug Name | PMIDs |
| Page: 1 |

Copyright 2023-Present -The University of Texas Health Science Center at Houston |