
|
|||||
|
 | |
| |
| |
| |
| |
| |
|
Gene: UTP18 |
Gene summary for UTP18 |
| Gene information | Species | Human | Gene symbol | UTP18 | Gene ID | 51096 |
| Gene name | UTP18 small subunit processome component | |
| Gene Alias | CGI-48 | |
| Cytomap | 17q21.33 | |
| Gene Type | protein-coding | GO ID | GO:0006139 | UniProtAcc | Q9Y5J1 |
Top |
Malignant transformation analysis |
| Identification of the aberrant gene expression in precancerous and cancerous lesions by comparing the gene expression of stem-like cells in diseased tissues with normal stem cells |
| Entrez ID | Symbol | Replicates | Species | Organ | Tissue | Adj P-value | Log2FC | Malignancy |
| 51096 | UTP18 | LZE4T | Human | Esophagus | ESCC | 6.50e-09 | 2.45e-01 | 0.0811 |
| 51096 | UTP18 | LZE7T | Human | Esophagus | ESCC | 4.72e-05 | 3.82e-01 | 0.0667 |
| 51096 | UTP18 | LZE8T | Human | Esophagus | ESCC | 1.60e-04 | 1.41e-01 | 0.067 |
| 51096 | UTP18 | LZE24T | Human | Esophagus | ESCC | 1.13e-07 | 3.27e-01 | 0.0596 |
| 51096 | UTP18 | P1T-E | Human | Esophagus | ESCC | 1.78e-09 | 3.14e-01 | 0.0875 |
| 51096 | UTP18 | P2T-E | Human | Esophagus | ESCC | 2.32e-27 | 4.97e-01 | 0.1177 |
| 51096 | UTP18 | P4T-E | Human | Esophagus | ESCC | 4.67e-20 | 6.37e-01 | 0.1323 |
| 51096 | UTP18 | P5T-E | Human | Esophagus | ESCC | 6.51e-36 | 9.11e-01 | 0.1327 |
| 51096 | UTP18 | P8T-E | Human | Esophagus | ESCC | 6.81e-18 | 2.81e-01 | 0.0889 |
| 51096 | UTP18 | P9T-E | Human | Esophagus | ESCC | 3.08e-12 | 2.56e-01 | 0.1131 |
| 51096 | UTP18 | P10T-E | Human | Esophagus | ESCC | 9.19e-20 | 2.55e-01 | 0.116 |
| 51096 | UTP18 | P11T-E | Human | Esophagus | ESCC | 3.31e-06 | 4.99e-01 | 0.1426 |
| 51096 | UTP18 | P12T-E | Human | Esophagus | ESCC | 1.53e-39 | 7.68e-01 | 0.1122 |
| 51096 | UTP18 | P15T-E | Human | Esophagus | ESCC | 4.89e-20 | 4.54e-01 | 0.1149 |
| 51096 | UTP18 | P16T-E | Human | Esophagus | ESCC | 3.29e-29 | 5.39e-01 | 0.1153 |
| 51096 | UTP18 | P17T-E | Human | Esophagus | ESCC | 2.79e-12 | 5.52e-01 | 0.1278 |
| 51096 | UTP18 | P19T-E | Human | Esophagus | ESCC | 4.15e-03 | 4.53e-01 | 0.1662 |
| 51096 | UTP18 | P20T-E | Human | Esophagus | ESCC | 7.50e-13 | 3.89e-01 | 0.1124 |
| 51096 | UTP18 | P21T-E | Human | Esophagus | ESCC | 1.81e-35 | 7.00e-01 | 0.1617 |
| 51096 | UTP18 | P22T-E | Human | Esophagus | ESCC | 4.13e-28 | 5.17e-01 | 0.1236 |
| Page: 1 2 3 4 5 6 |
| Tissue | Expression Dynamics | Abbreviation |
| Esophagus | 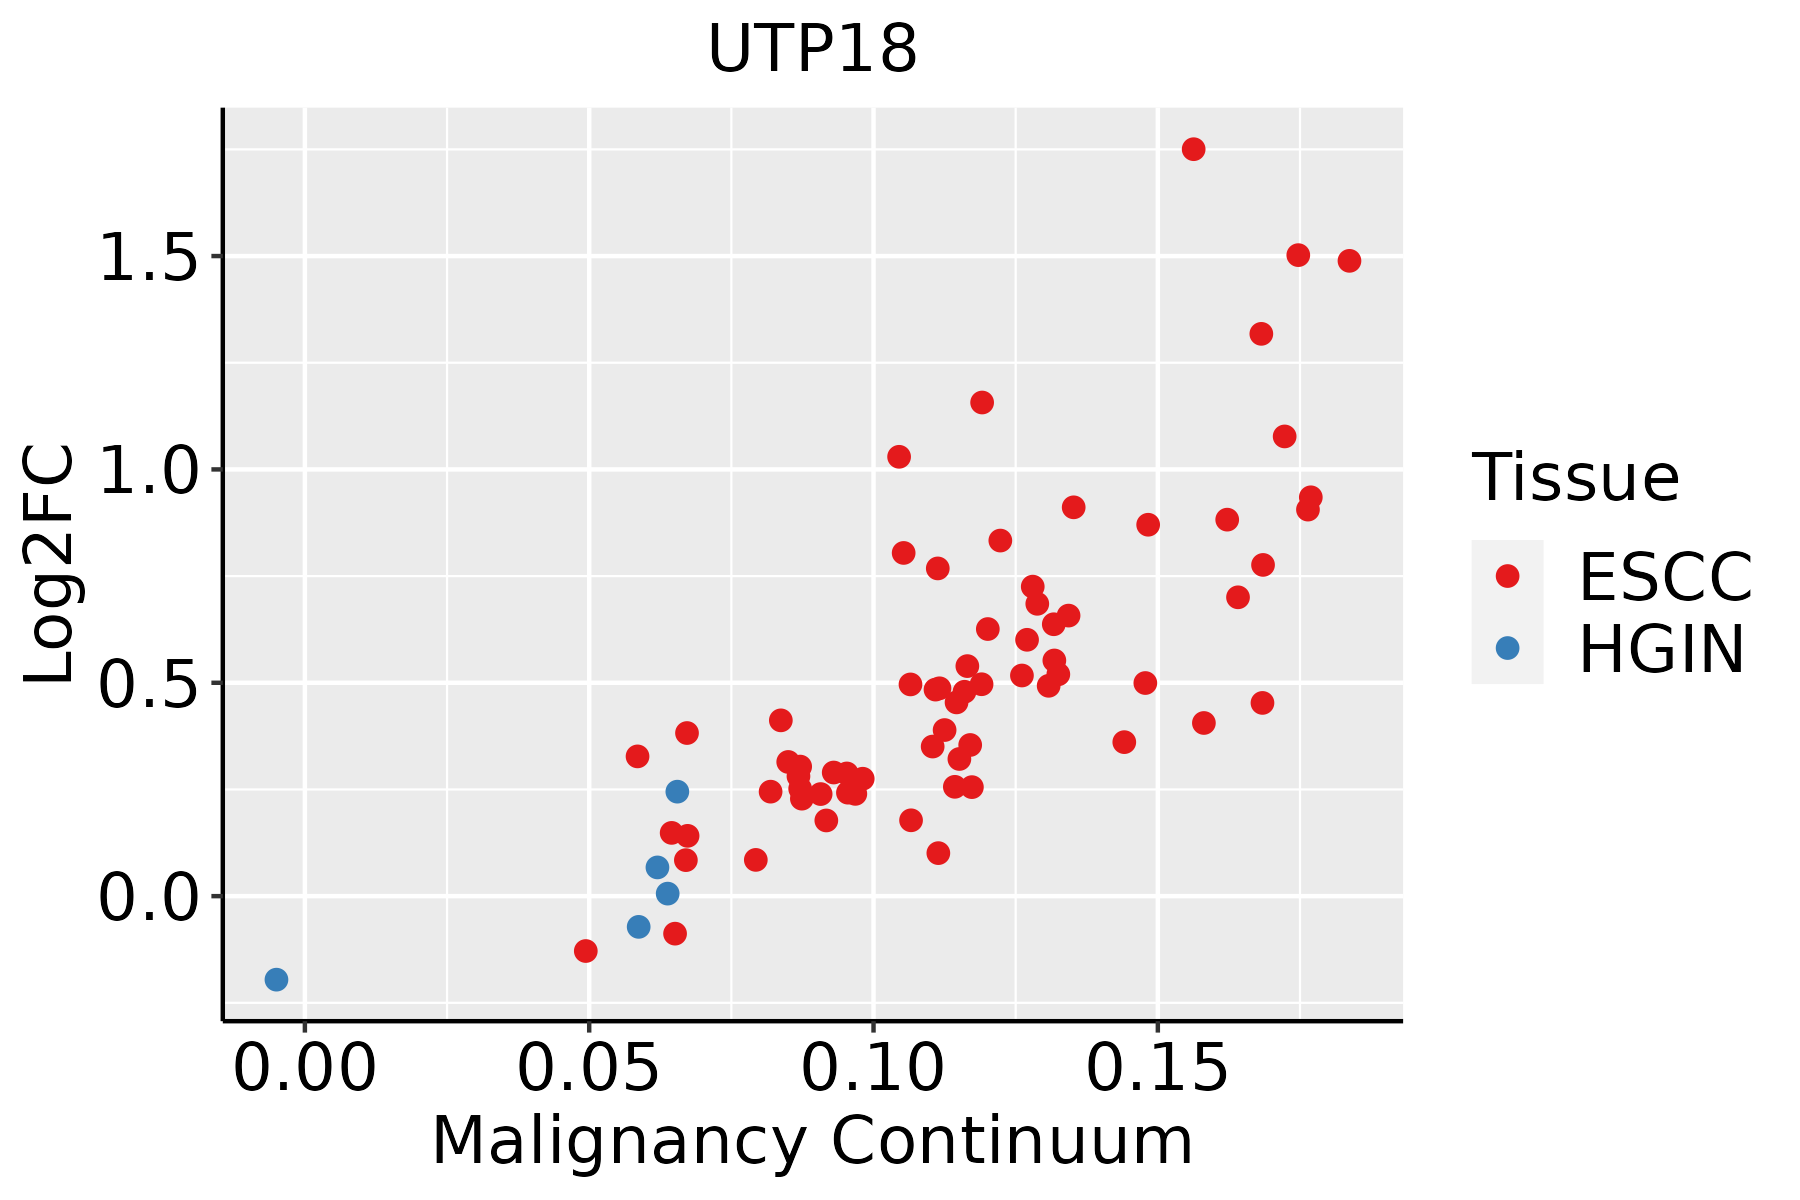 | ESCC: Esophageal squamous cell carcinoma |
| HGIN: High-grade intraepithelial neoplasias | ||
| LGIN: Low-grade intraepithelial neoplasias | ||
| Liver | 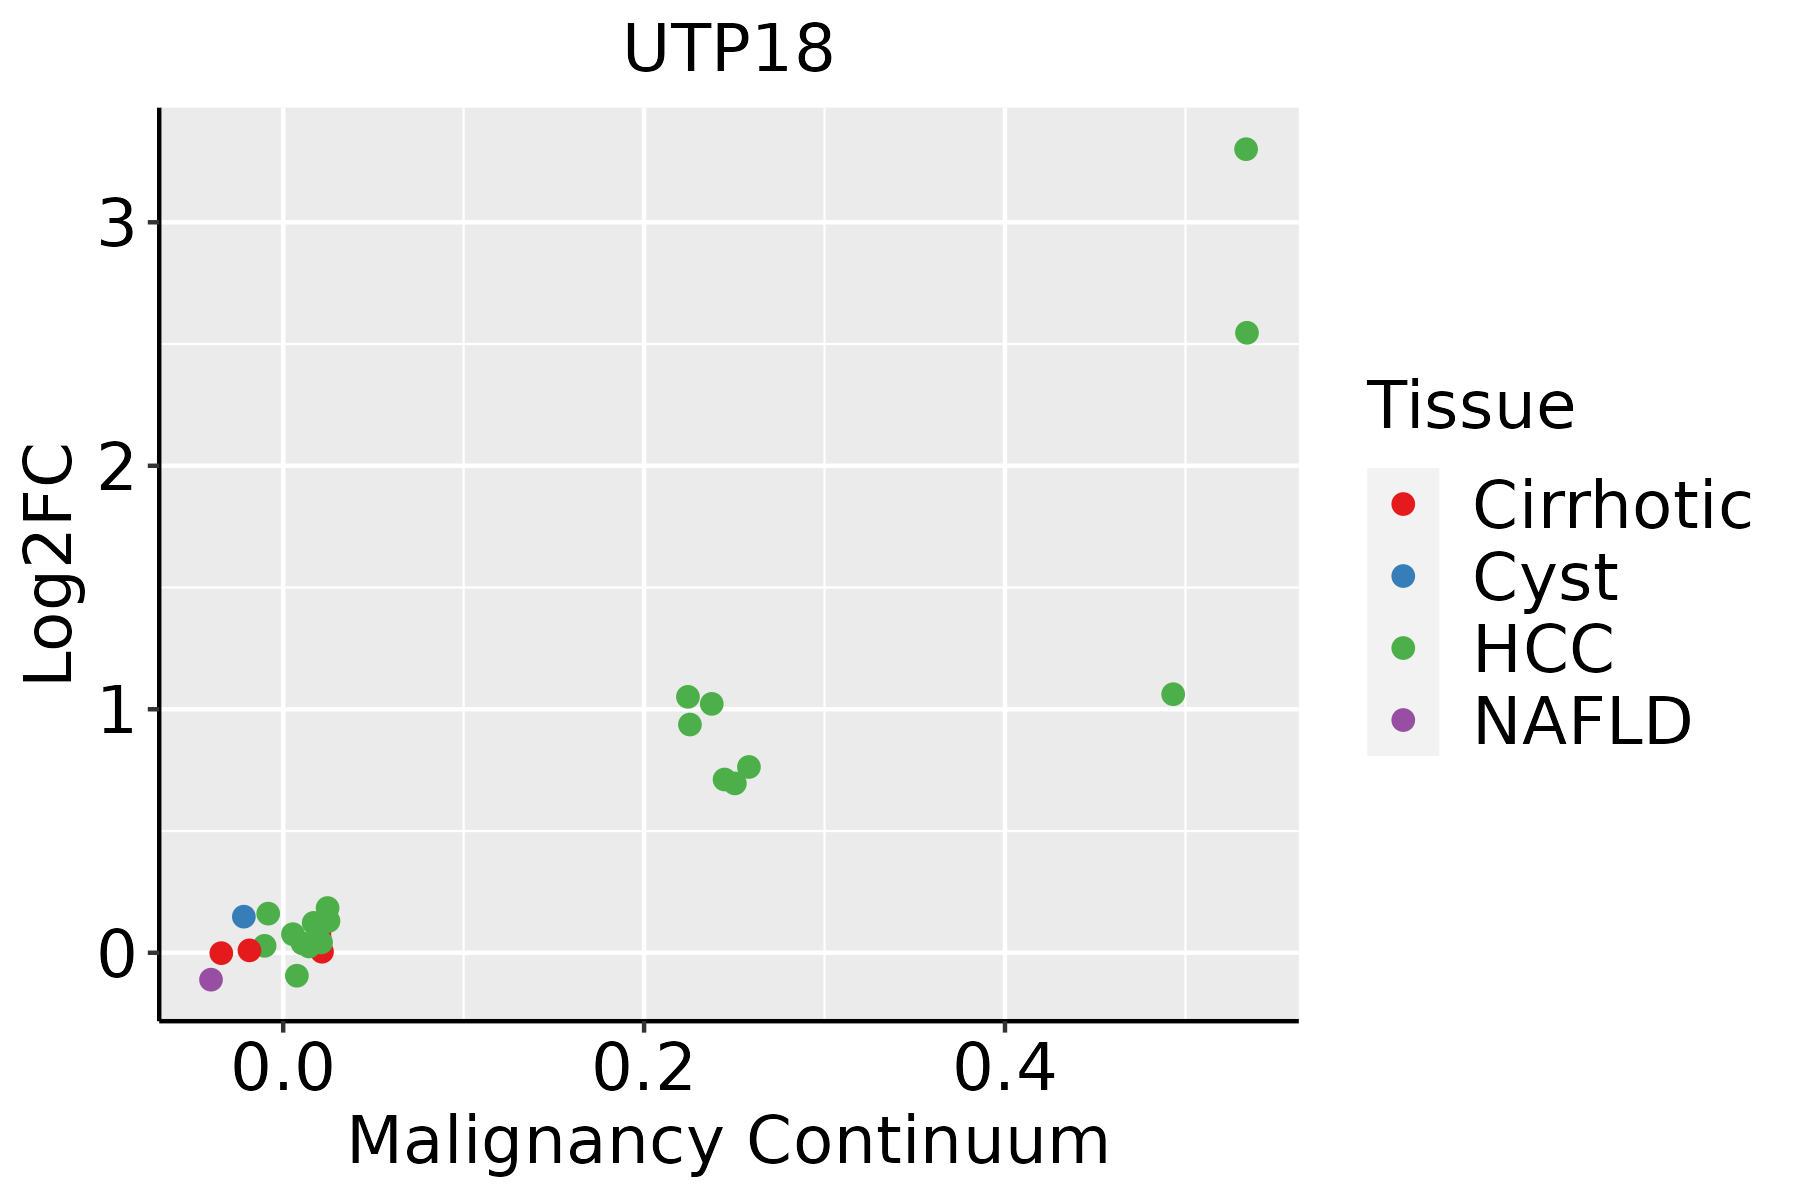 | HCC: Hepatocellular carcinoma |
| NAFLD: Non-alcoholic fatty liver disease | ||
| Oral Cavity | 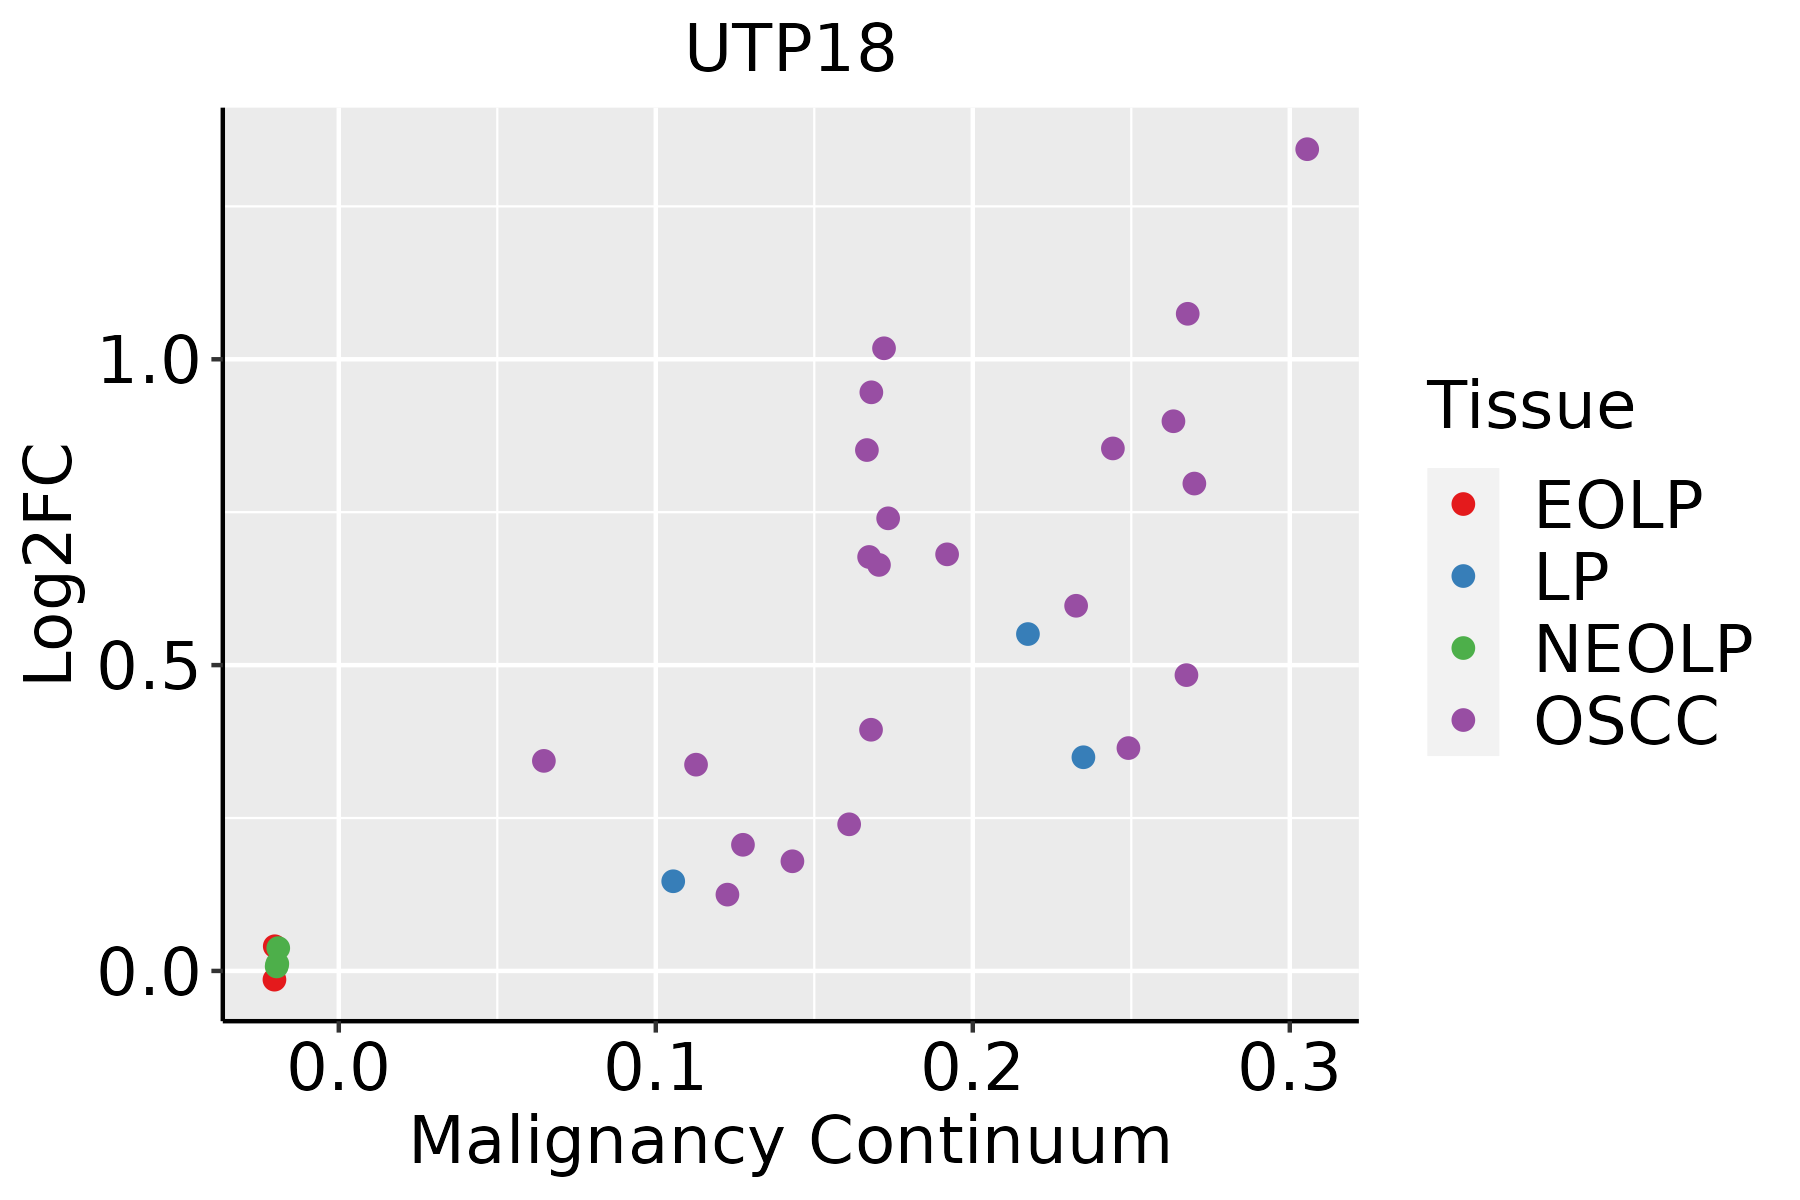 | EOLP: Erosive Oral lichen planus |
| LP: leukoplakia | ||
| NEOLP: Non-erosive oral lichen planus | ||
| OSCC: Oral squamous cell carcinoma | ||
| Skin | 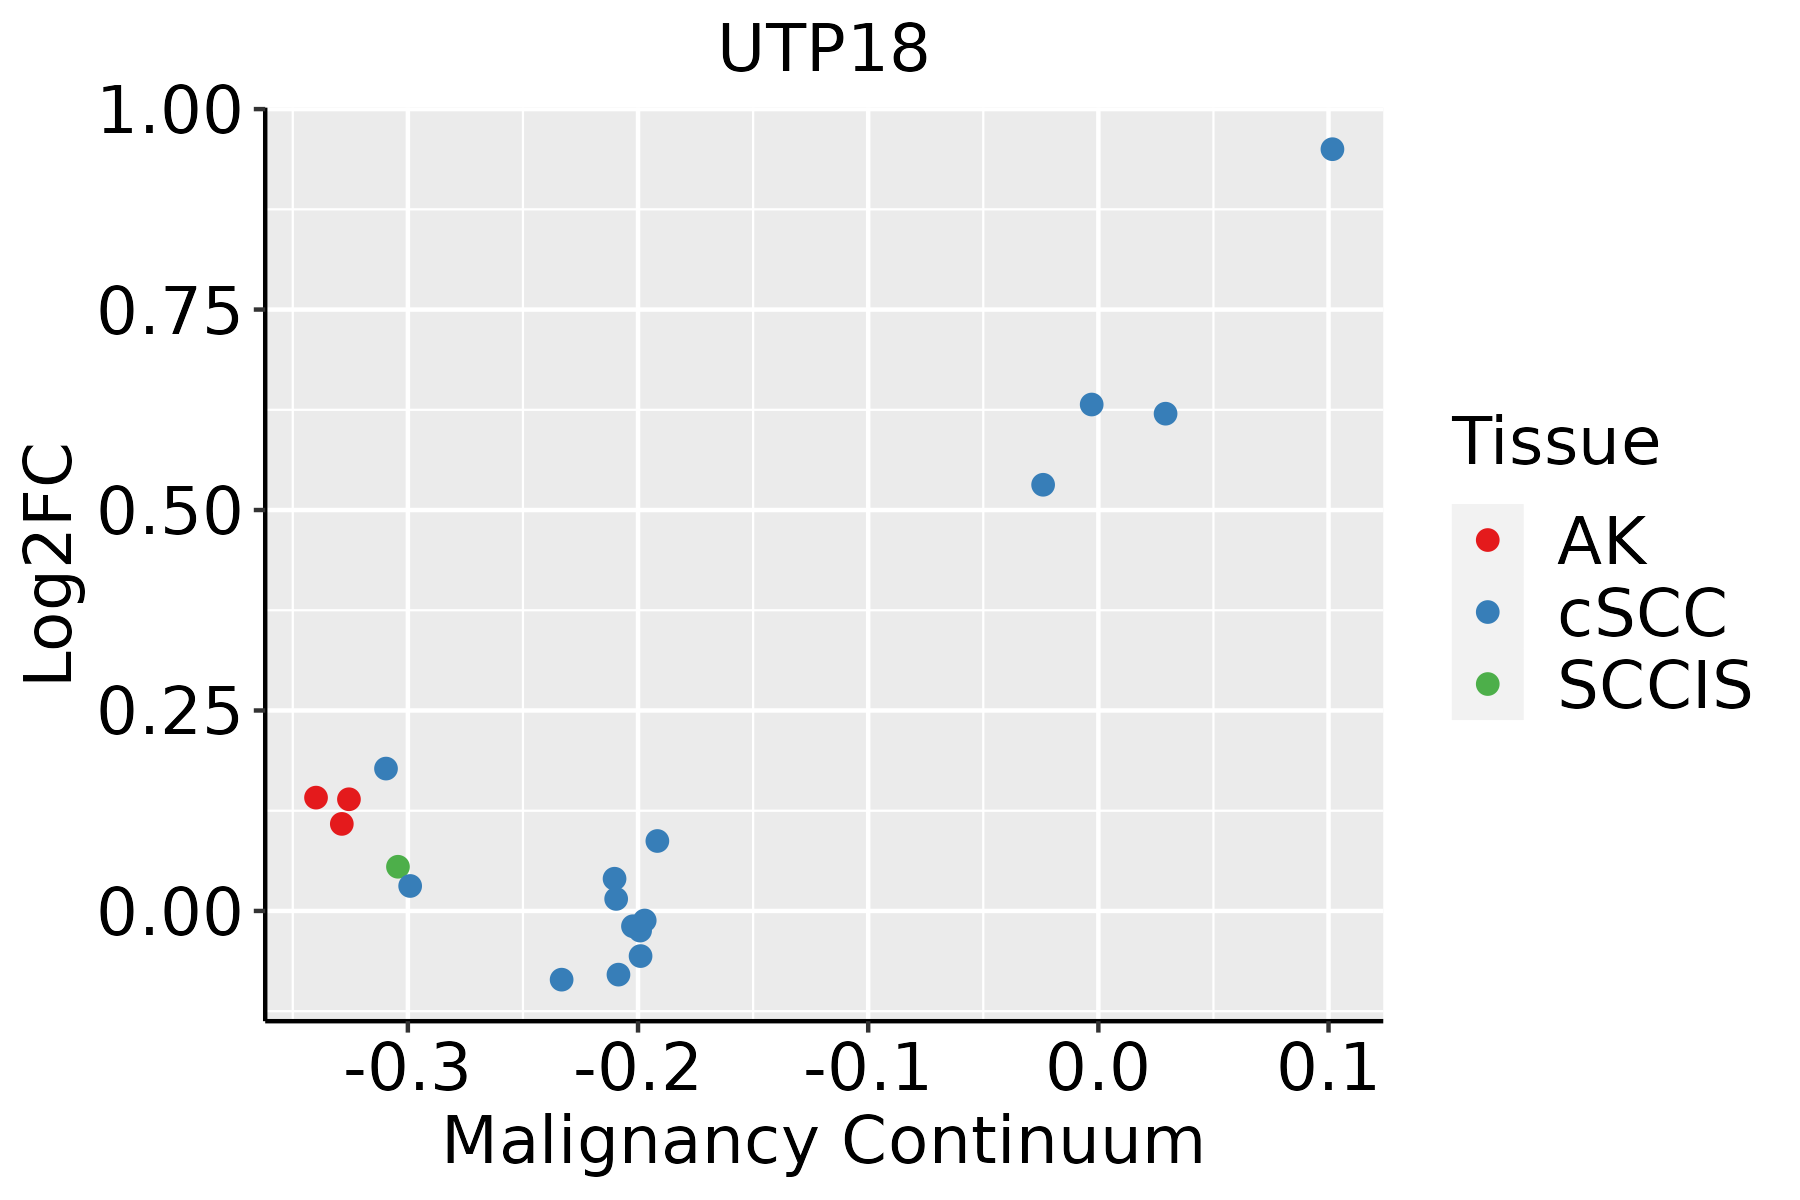 | AK: Actinic keratosis |
| cSCC: Cutaneous squamous cell carcinoma | ||
| SCCIS:squamous cell carcinoma in situ | ||
| Thyroid | 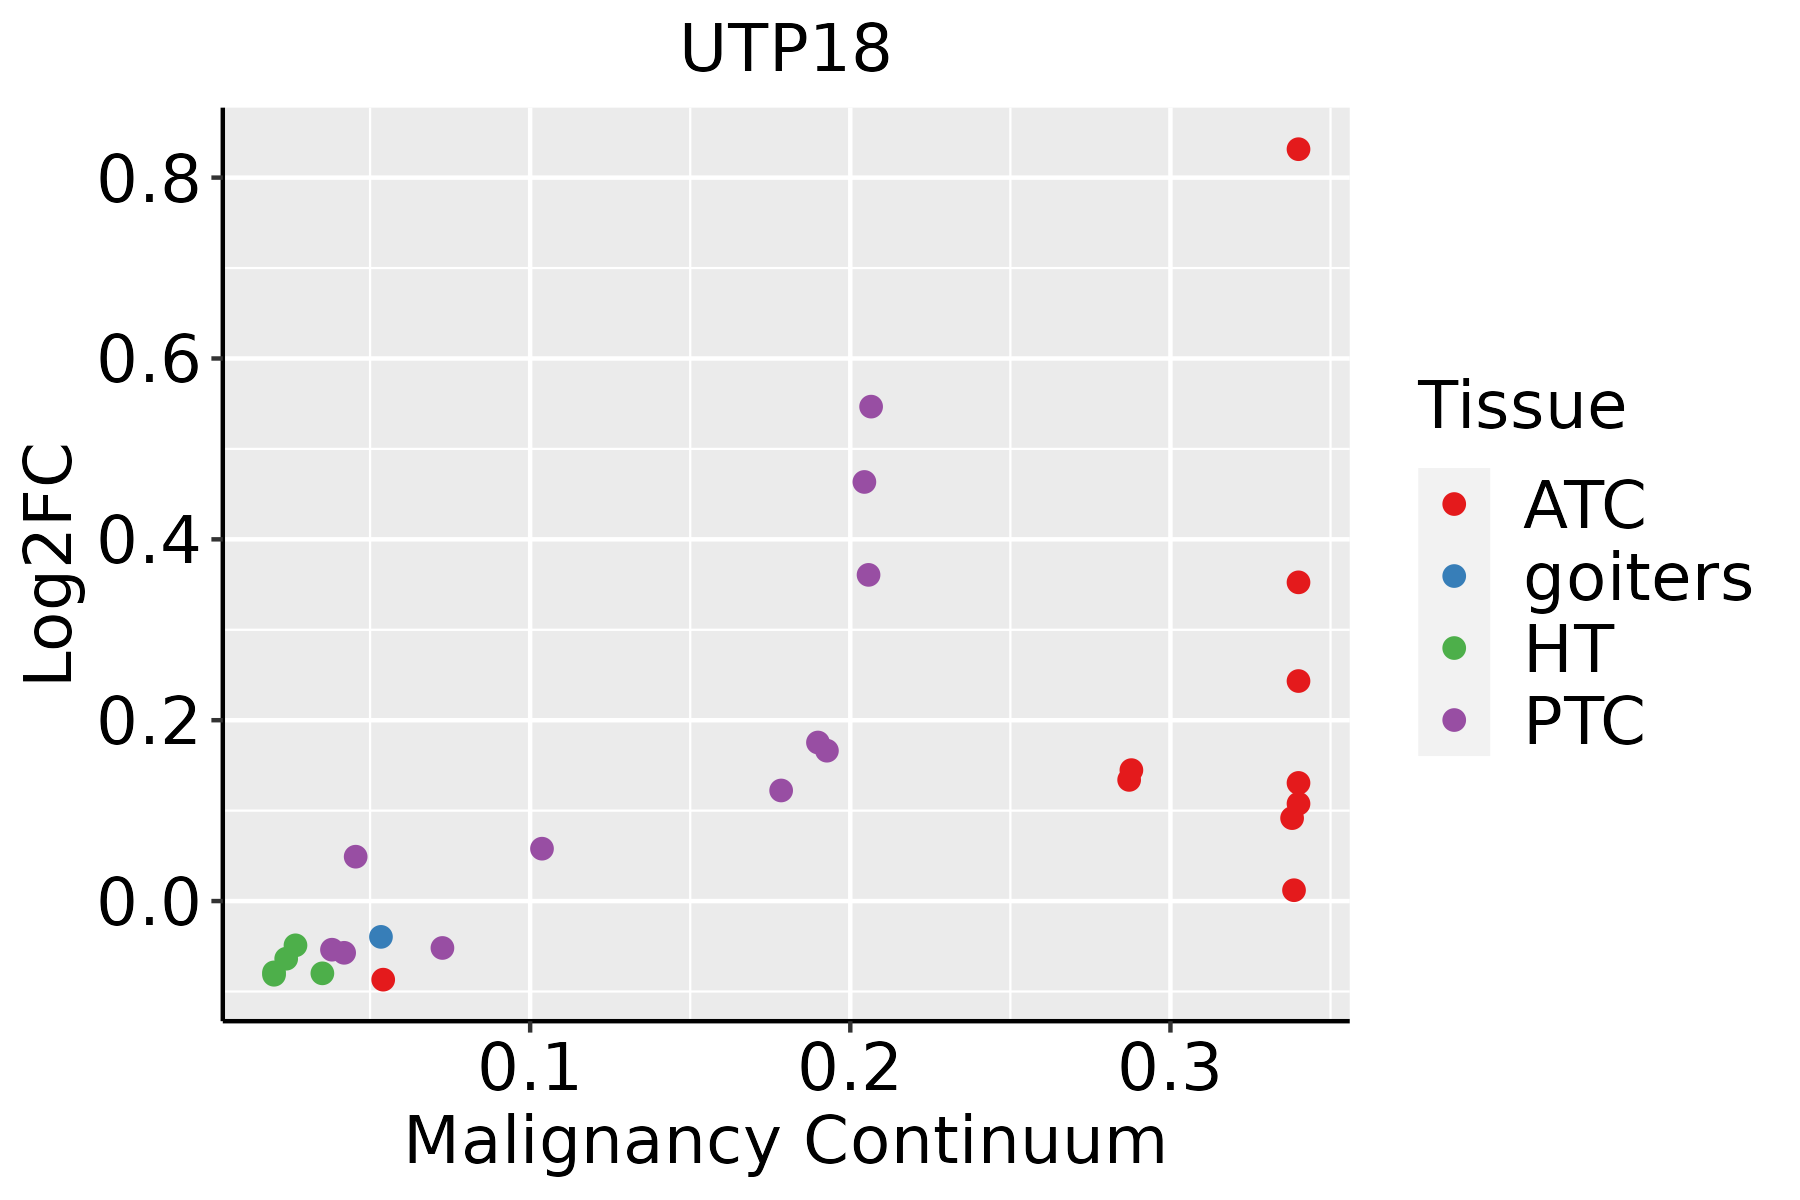 | ATC: Anaplastic thyroid cancer |
| HT: Hashimoto's thyroiditis | ||
| PTC: Papillary thyroid cancer |
| ∗log2FC in expression of this searched gene in stem-like cells from each diseased tissue sample relative to stem-like cells in normal samples in each tissue plotted against the malignancy continuum. Samples are colored based on if they are from different disease stage. |
Top |
Malignant transformation related pathway analysis |
| Find out the enriched GO biological processes and KEGG pathways involved in transition from healthy to precancer to cancer |
| Tissue | Disease Stage | Enriched GO biological Processes |
| Colorectum | AD |  |
| Colorectum | SER |  |
| Colorectum | MSS |  |
| Colorectum | MSI-H |  |
| Colorectum | FAP |  |
| ∗Top 15 enriched GO BP terms are showed in the bar plot of each disease state in each tissue. Each row represents a significant GO biological process which is colored according to the -log10(p.adjust). |
| Page: 1 2 3 4 5 6 7 8 9 |
| GO ID | Tissue | Disease Stage | Description | Gene Ratio | Bg Ratio | pvalue | p.adjust | Count |
| GO:000636418 | Oral cavity | LP | rRNA processing | 134/4623 | 225/18723 | 6.08e-29 | 4.23e-26 | 134 |
| GO:001607218 | Oral cavity | LP | rRNA metabolic process | 136/4623 | 236/18723 | 2.37e-27 | 1.48e-24 | 136 |
| GO:003447014 | Oral cavity | LP | ncRNA processing | 184/4623 | 395/18723 | 1.20e-21 | 3.12e-19 | 184 |
| GO:003466011 | Oral cavity | LP | ncRNA metabolic process | 205/4623 | 485/18723 | 6.46e-18 | 1.09e-15 | 205 |
| GO:002261329 | Skin | cSCC | ribonucleoprotein complex biogenesis | 302/4864 | 463/18723 | 5.13e-72 | 3.22e-68 | 302 |
| GO:004225428 | Skin | cSCC | ribosome biogenesis | 206/4864 | 299/18723 | 3.33e-55 | 1.04e-51 | 206 |
| GO:000636424 | Skin | cSCC | rRNA processing | 156/4864 | 225/18723 | 1.42e-42 | 1.48e-39 | 156 |
| GO:001607224 | Skin | cSCC | rRNA metabolic process | 158/4864 | 236/18723 | 4.06e-40 | 2.83e-37 | 158 |
| GO:003447017 | Skin | cSCC | ncRNA processing | 215/4864 | 395/18723 | 6.83e-34 | 4.28e-31 | 215 |
| GO:003466013 | Skin | cSCC | ncRNA metabolic process | 234/4864 | 485/18723 | 1.37e-26 | 4.77e-24 | 234 |
| GO:0022613113 | Thyroid | PTC | ribonucleoprotein complex biogenesis | 292/5968 | 463/18723 | 3.24e-44 | 2.05e-40 | 292 |
| GO:0042254113 | Thyroid | PTC | ribosome biogenesis | 202/5968 | 299/18723 | 3.47e-37 | 5.47e-34 | 202 |
| GO:0006364112 | Thyroid | PTC | rRNA processing | 156/5968 | 225/18723 | 5.58e-31 | 5.03e-28 | 156 |
| GO:0016072112 | Thyroid | PTC | rRNA metabolic process | 160/5968 | 236/18723 | 5.68e-30 | 3.58e-27 | 160 |
| GO:003447018 | Thyroid | PTC | ncRNA processing | 215/5968 | 395/18723 | 7.14e-21 | 1.22e-18 | 215 |
| GO:00346608 | Thyroid | PTC | ncRNA metabolic process | 239/5968 | 485/18723 | 5.54e-16 | 4.26e-14 | 239 |
| GO:002261334 | Thyroid | ATC | ribonucleoprotein complex biogenesis | 292/6293 | 463/18723 | 3.05e-39 | 9.63e-36 | 292 |
| GO:004225434 | Thyroid | ATC | ribosome biogenesis | 203/6293 | 299/18723 | 3.63e-34 | 4.59e-31 | 203 |
| GO:000636432 | Thyroid | ATC | rRNA processing | 157/6293 | 225/18723 | 9.02e-29 | 5.70e-26 | 157 |
| GO:001607232 | Thyroid | ATC | rRNA metabolic process | 161/6293 | 236/18723 | 1.02e-27 | 5.89e-25 | 161 |
| Page: 1 2 3 |
| Pathway ID | Tissue | Disease Stage | Description | Gene Ratio | Bg Ratio | pvalue | p.adjust | qvalue | Count |
| Page: 1 |
Top |
Cell-cell communication analysis |
| Identification of potential cell-cell interactions between two cell types and their ligand-receptor pairs for different disease states |
| Ligand | Receptor | LRpair | Pathway | Tissue | Disease Stage |
| Page: 1 |
Top |
Single-cell gene regulatory network inference analysis |
| Find out the significant the regulons (TFs) and the target genes of each regulon across cell types for different disease states |
| TF | Cell Type | Tissue | Disease Stage | Target Gene | RSS | Regulon Activity |
| UTP18 | cDC | Lung | AIS | TMEM63A,ZBTB33,CCL17, etc. | 2.27e-02 |  |
| UTP18 | D | Stomach | Healthy | CLEC2B,PHGR1,C16orf72, etc. | 9.42e-03 |  |
| ∗The dot plots of a searched regulon are shown for all cell subpopulations in each disease state of each tissue based on the regulon specific score inferred using pySCENIC and by calculating the average expression. |
| Page: 1 |
Top |
Somatic mutation of malignant transformation related genes |
| Annotation of somatic variants for genes involved in malignant transformation |
| Hugo Symbol | Variant Class | Variant Classification | dbSNP RS | HGVSc | HGVSp | HGVSp Short | SWISSPROT | BIOTYPE | SIFT | PolyPhen | Tumor Sample Barcode | Tissue | Histology | Sex | Age | Stage | Therapy Types | Drugs | Outcome |
| UTP18 | SNV | Missense_Mutation | novel | c.1565N>G | p.Ser522Cys | p.S522C | Q9Y5J1 | protein_coding | tolerated(0.14) | possibly_damaging(0.829) | TCGA-3C-AALI-01 | Breast | breast invasive carcinoma | Female | <65 | I/II | Unspecific | Poly E | Complete Response |
| UTP18 | SNV | Missense_Mutation | novel | c.862A>G | p.Ile288Val | p.I288V | Q9Y5J1 | protein_coding | deleterious(0.01) | probably_damaging(0.914) | TCGA-A8-A0A7-01 | Breast | breast invasive carcinoma | Female | <65 | I/II | Unknown | Unknown | SD |
| UTP18 | SNV | Missense_Mutation | c.1042N>A | p.Glu348Lys | p.E348K | Q9Y5J1 | protein_coding | tolerated(0.13) | benign(0.007) | TCGA-AC-A23H-01 | Breast | breast invasive carcinoma | Female | >=65 | I/II | Unknown | Unknown | PD | |
| UTP18 | SNV | Missense_Mutation | c.1609N>C | p.Ala537Pro | p.A537P | Q9Y5J1 | protein_coding | deleterious(0.01) | probably_damaging(0.959) | TCGA-AC-A23H-01 | Breast | breast invasive carcinoma | Female | >=65 | I/II | Unknown | Unknown | PD | |
| UTP18 | SNV | Missense_Mutation | novel | c.608N>C | p.Lys203Thr | p.K203T | Q9Y5J1 | protein_coding | tolerated(0.06) | benign(0.014) | TCGA-AN-A046-01 | Breast | breast invasive carcinoma | Female | >=65 | I/II | Unknown | Unknown | SD |
| UTP18 | insertion | Frame_Shift_Ins | novel | c.68_69insCTCAACAAGCAGT | p.Gly24SerfsTer100 | p.G24Sfs*100 | Q9Y5J1 | protein_coding | TCGA-EW-A6S9-01 | Breast | breast invasive carcinoma | Female | <65 | I/II | Unknown | Unknown | SD | ||
| UTP18 | insertion | In_Frame_Ins | novel | c.455_455+1insAATGGGATG | p.Met152delinsIleMetGlyTrp | p.M152delinsIMGW | Q9Y5J1 | protein_coding | TCGA-DS-A1OD-01 | Cervix | cervical & endocervical cancer | Female | <65 | I/II | Chemotherapy | cisplatin | SD | ||
| UTP18 | SNV | Missense_Mutation | novel | c.1486A>G | p.Lys496Glu | p.K496E | Q9Y5J1 | protein_coding | tolerated(0.23) | benign(0.372) | TCGA-A6-2678-01 | Colorectum | colon adenocarcinoma | Female | <65 | III/IV | Chemotherapy | 5-fluorouracil | SD |
| UTP18 | SNV | Missense_Mutation | c.233T>G | p.Leu78Arg | p.L78R | Q9Y5J1 | protein_coding | tolerated(0.08) | benign(0.259) | TCGA-AZ-5407-01 | Colorectum | colon adenocarcinoma | Female | <65 | I/II | Unknown | Unknown | SD | |
| UTP18 | SNV | Missense_Mutation | c.151C>T | p.Pro51Ser | p.P51S | Q9Y5J1 | protein_coding | tolerated(0.29) | benign(0.007) | TCGA-CK-4951-01 | Colorectum | colon adenocarcinoma | Female | >=65 | I/II | Unknown | Unknown | PD |
| Page: 1 2 3 4 5 |
Top |
Related drugs of malignant transformation related genes |
| Identification of chemicals and drugs interact with genes involved in malignant transfromation |
| (DGIdb 4.0) |
| Entrez ID | Symbol | Category | Interaction Types | Drug Claim Name | Drug Name | PMIDs |
| Page: 1 |

Copyright 2023-Present -The University of Texas Health Science Center at Houston |