
|
|||||
|
 | |
| |
| |
| |
| |
| |
|
Gene: UTP14A |
Gene summary for UTP14A |
| Gene information | Species | Human | Gene symbol | UTP14A | Gene ID | 10813 |
| Gene name | UTP14A small subunit processome component | |
| Gene Alias | NYCO16 | |
| Cytomap | Xq26.1 | |
| Gene Type | protein-coding | GO ID | GO:0006139 | UniProtAcc | Q9BVJ6 |
Top |
Malignant transformation analysis |
| Identification of the aberrant gene expression in precancerous and cancerous lesions by comparing the gene expression of stem-like cells in diseased tissues with normal stem cells |
| Entrez ID | Symbol | Replicates | Species | Organ | Tissue | Adj P-value | Log2FC | Malignancy |
| 10813 | UTP14A | LZE2T | Human | Esophagus | ESCC | 3.49e-02 | 4.81e-01 | 0.082 |
| 10813 | UTP14A | LZE4T | Human | Esophagus | ESCC | 2.73e-11 | 2.27e-01 | 0.0811 |
| 10813 | UTP14A | LZE7T | Human | Esophagus | ESCC | 1.02e-03 | 2.70e-01 | 0.0667 |
| 10813 | UTP14A | LZE20T | Human | Esophagus | ESCC | 5.74e-04 | 1.16e-01 | 0.0662 |
| 10813 | UTP14A | LZE24T | Human | Esophagus | ESCC | 1.21e-16 | 5.07e-01 | 0.0596 |
| 10813 | UTP14A | LZE6T | Human | Esophagus | ESCC | 3.78e-03 | 1.23e-01 | 0.0845 |
| 10813 | UTP14A | P2T-E | Human | Esophagus | ESCC | 3.62e-23 | 3.97e-01 | 0.1177 |
| 10813 | UTP14A | P4T-E | Human | Esophagus | ESCC | 2.38e-13 | 2.71e-01 | 0.1323 |
| 10813 | UTP14A | P5T-E | Human | Esophagus | ESCC | 1.79e-17 | 3.17e-01 | 0.1327 |
| 10813 | UTP14A | P8T-E | Human | Esophagus | ESCC | 1.09e-13 | 1.92e-01 | 0.0889 |
| 10813 | UTP14A | P9T-E | Human | Esophagus | ESCC | 8.17e-16 | 2.87e-01 | 0.1131 |
| 10813 | UTP14A | P10T-E | Human | Esophagus | ESCC | 5.47e-24 | 3.88e-01 | 0.116 |
| 10813 | UTP14A | P11T-E | Human | Esophagus | ESCC | 8.32e-06 | 2.68e-01 | 0.1426 |
| 10813 | UTP14A | P12T-E | Human | Esophagus | ESCC | 5.10e-11 | 1.61e-01 | 0.1122 |
| 10813 | UTP14A | P15T-E | Human | Esophagus | ESCC | 7.88e-11 | 2.24e-01 | 0.1149 |
| 10813 | UTP14A | P16T-E | Human | Esophagus | ESCC | 2.03e-12 | 1.68e-01 | 0.1153 |
| 10813 | UTP14A | P17T-E | Human | Esophagus | ESCC | 5.82e-06 | 4.02e-01 | 0.1278 |
| 10813 | UTP14A | P20T-E | Human | Esophagus | ESCC | 2.28e-08 | 3.15e-01 | 0.1124 |
| 10813 | UTP14A | P21T-E | Human | Esophagus | ESCC | 3.21e-28 | 4.75e-01 | 0.1617 |
| 10813 | UTP14A | P22T-E | Human | Esophagus | ESCC | 7.29e-25 | 4.36e-01 | 0.1236 |
| Page: 1 2 3 4 5 6 |
| Tissue | Expression Dynamics | Abbreviation |
| Esophagus | 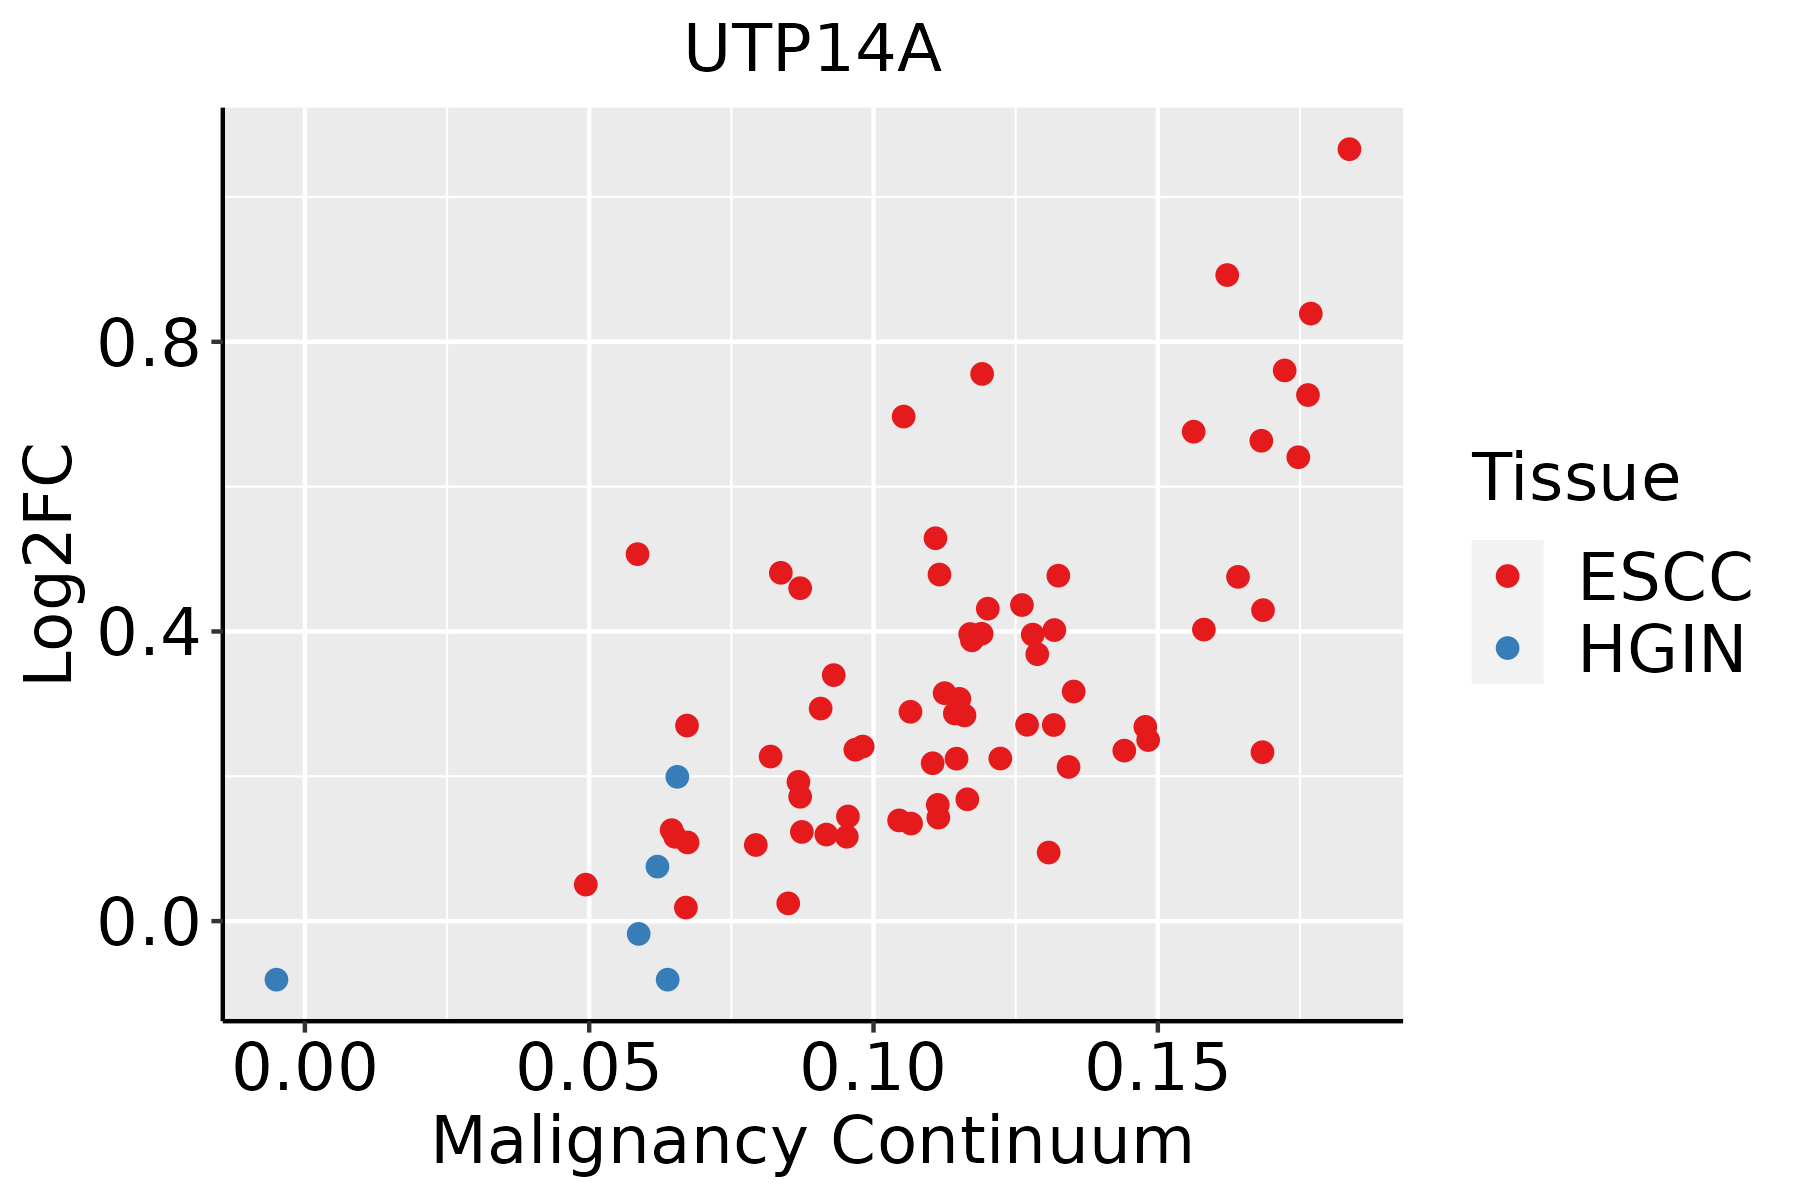 | ESCC: Esophageal squamous cell carcinoma |
| HGIN: High-grade intraepithelial neoplasias | ||
| LGIN: Low-grade intraepithelial neoplasias | ||
| Liver | 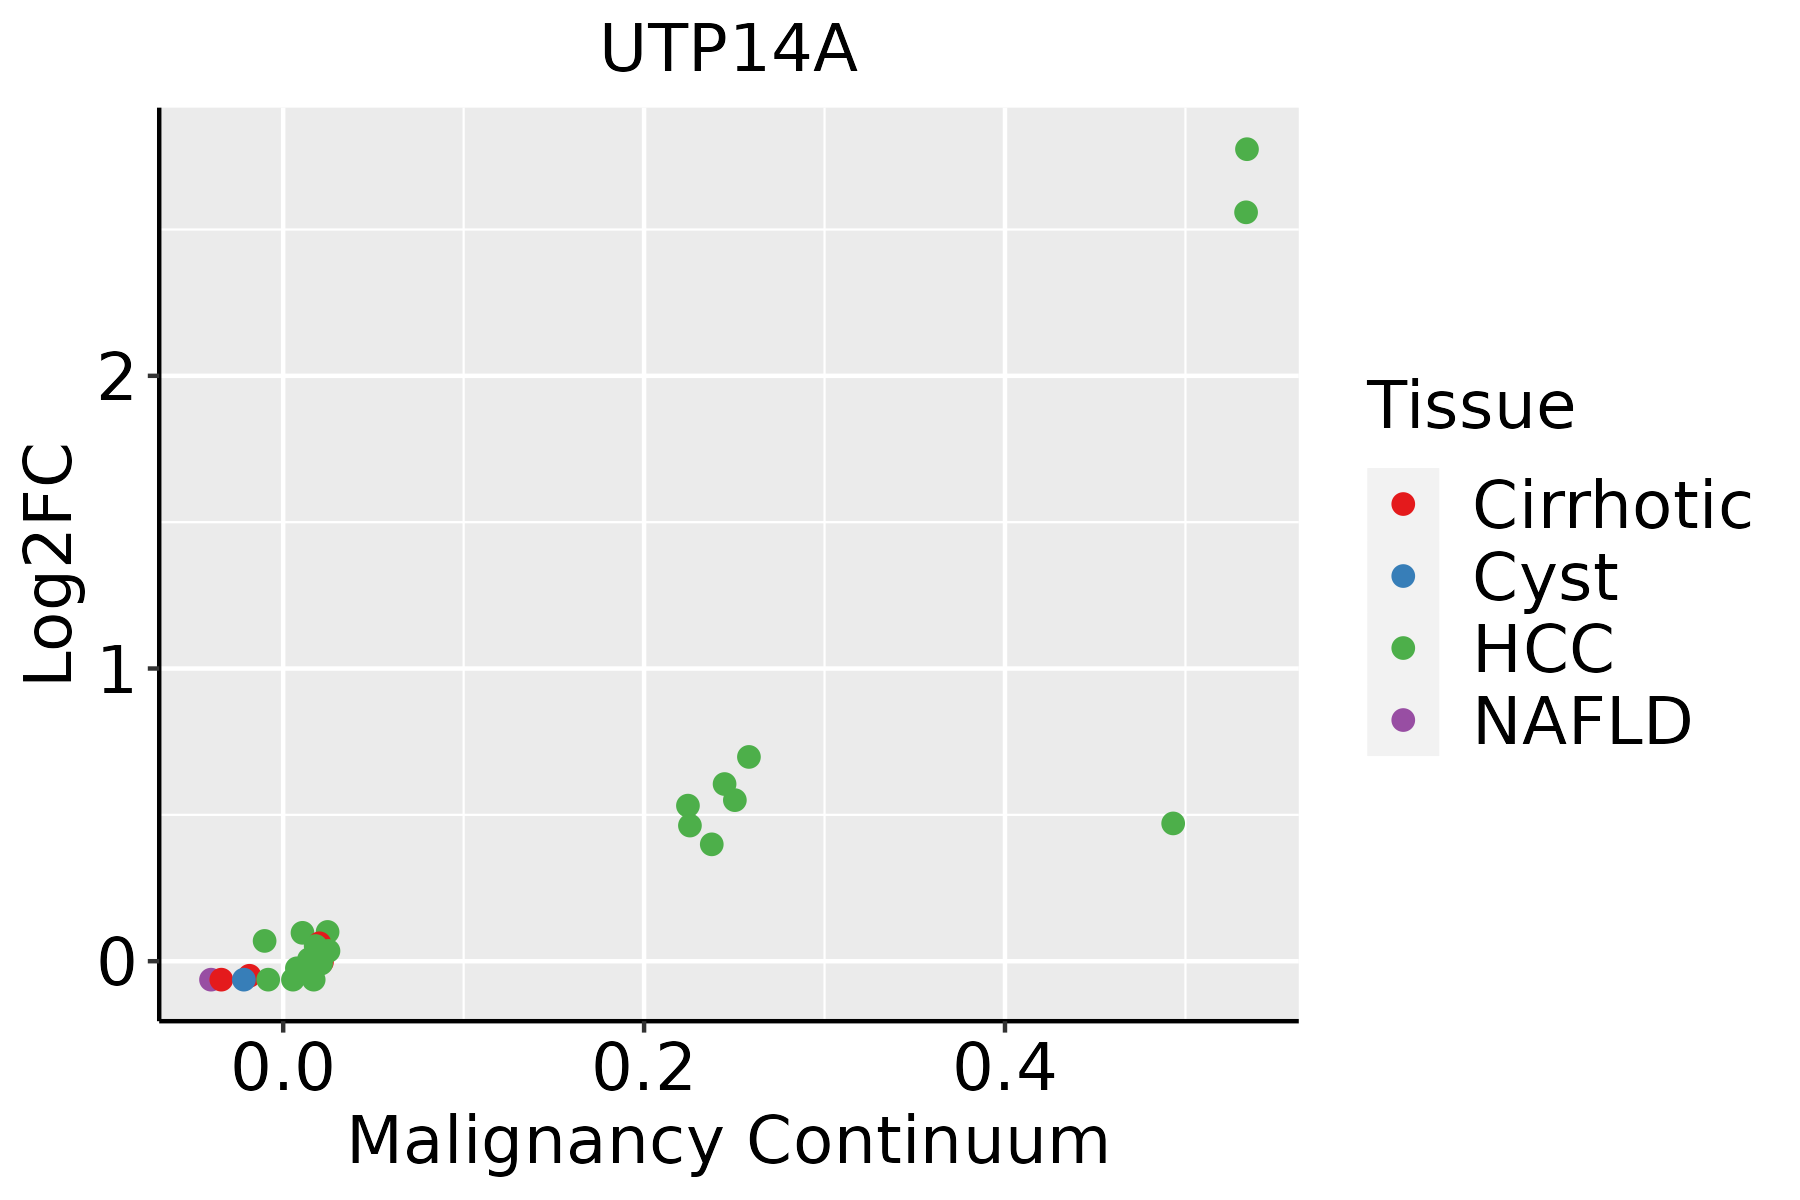 | HCC: Hepatocellular carcinoma |
| NAFLD: Non-alcoholic fatty liver disease | ||
| Oral Cavity | 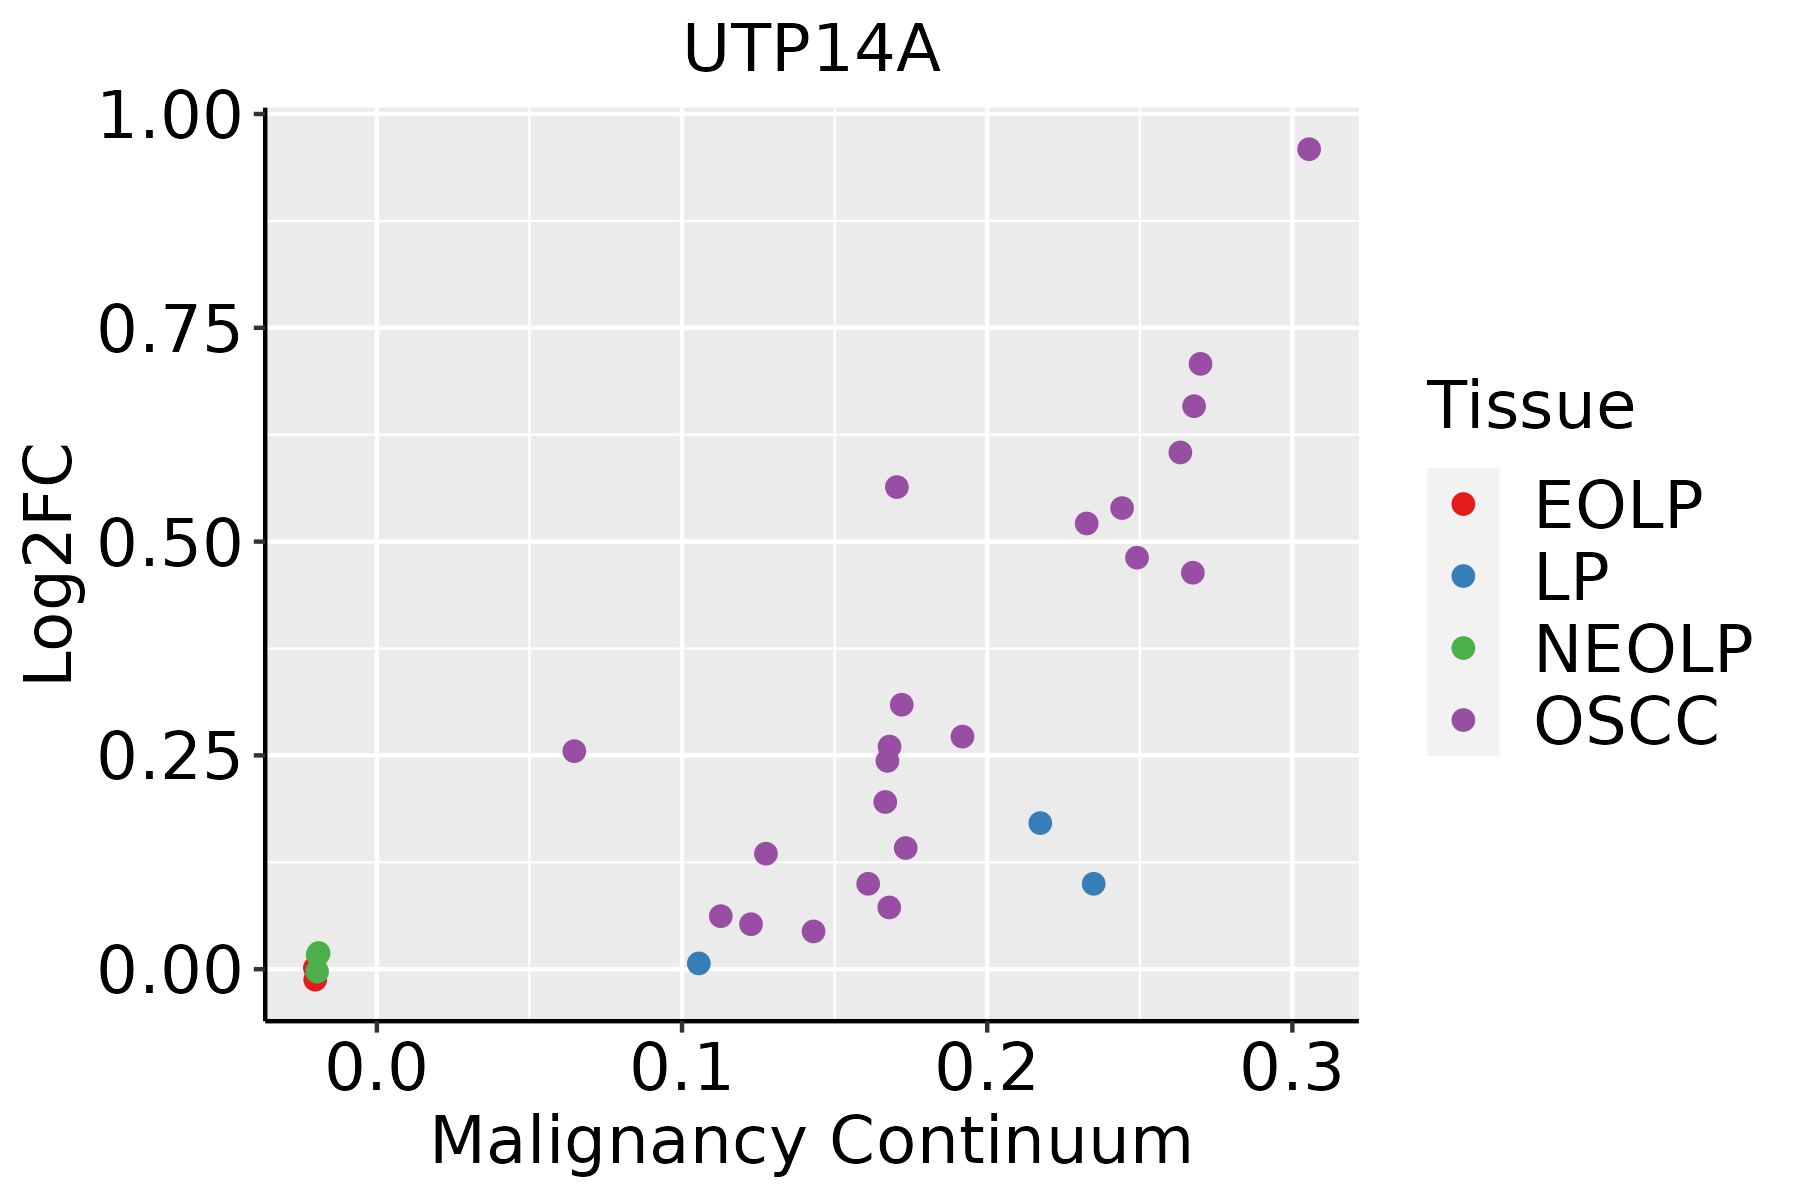 | EOLP: Erosive Oral lichen planus |
| LP: leukoplakia | ||
| NEOLP: Non-erosive oral lichen planus | ||
| OSCC: Oral squamous cell carcinoma | ||
| Skin | 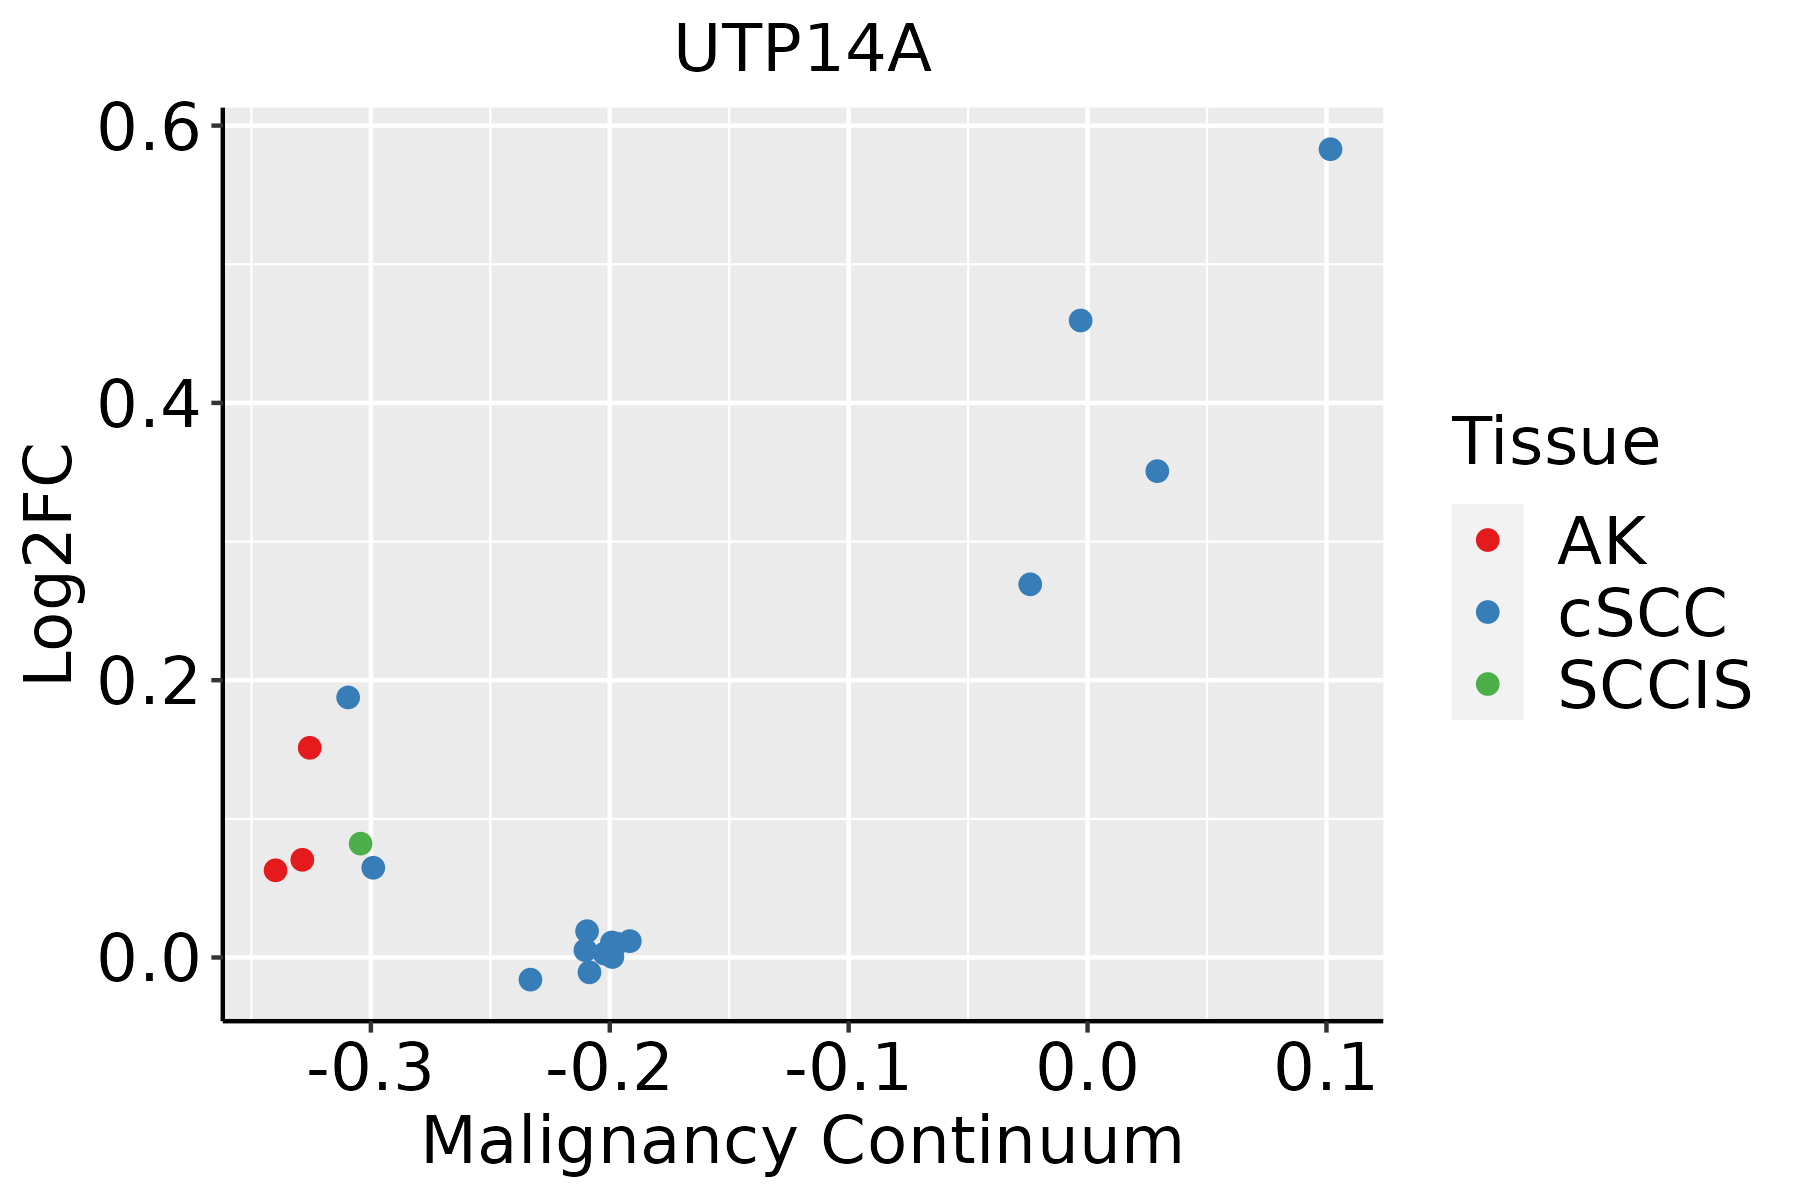 | AK: Actinic keratosis |
| cSCC: Cutaneous squamous cell carcinoma | ||
| SCCIS:squamous cell carcinoma in situ | ||
| Thyroid | 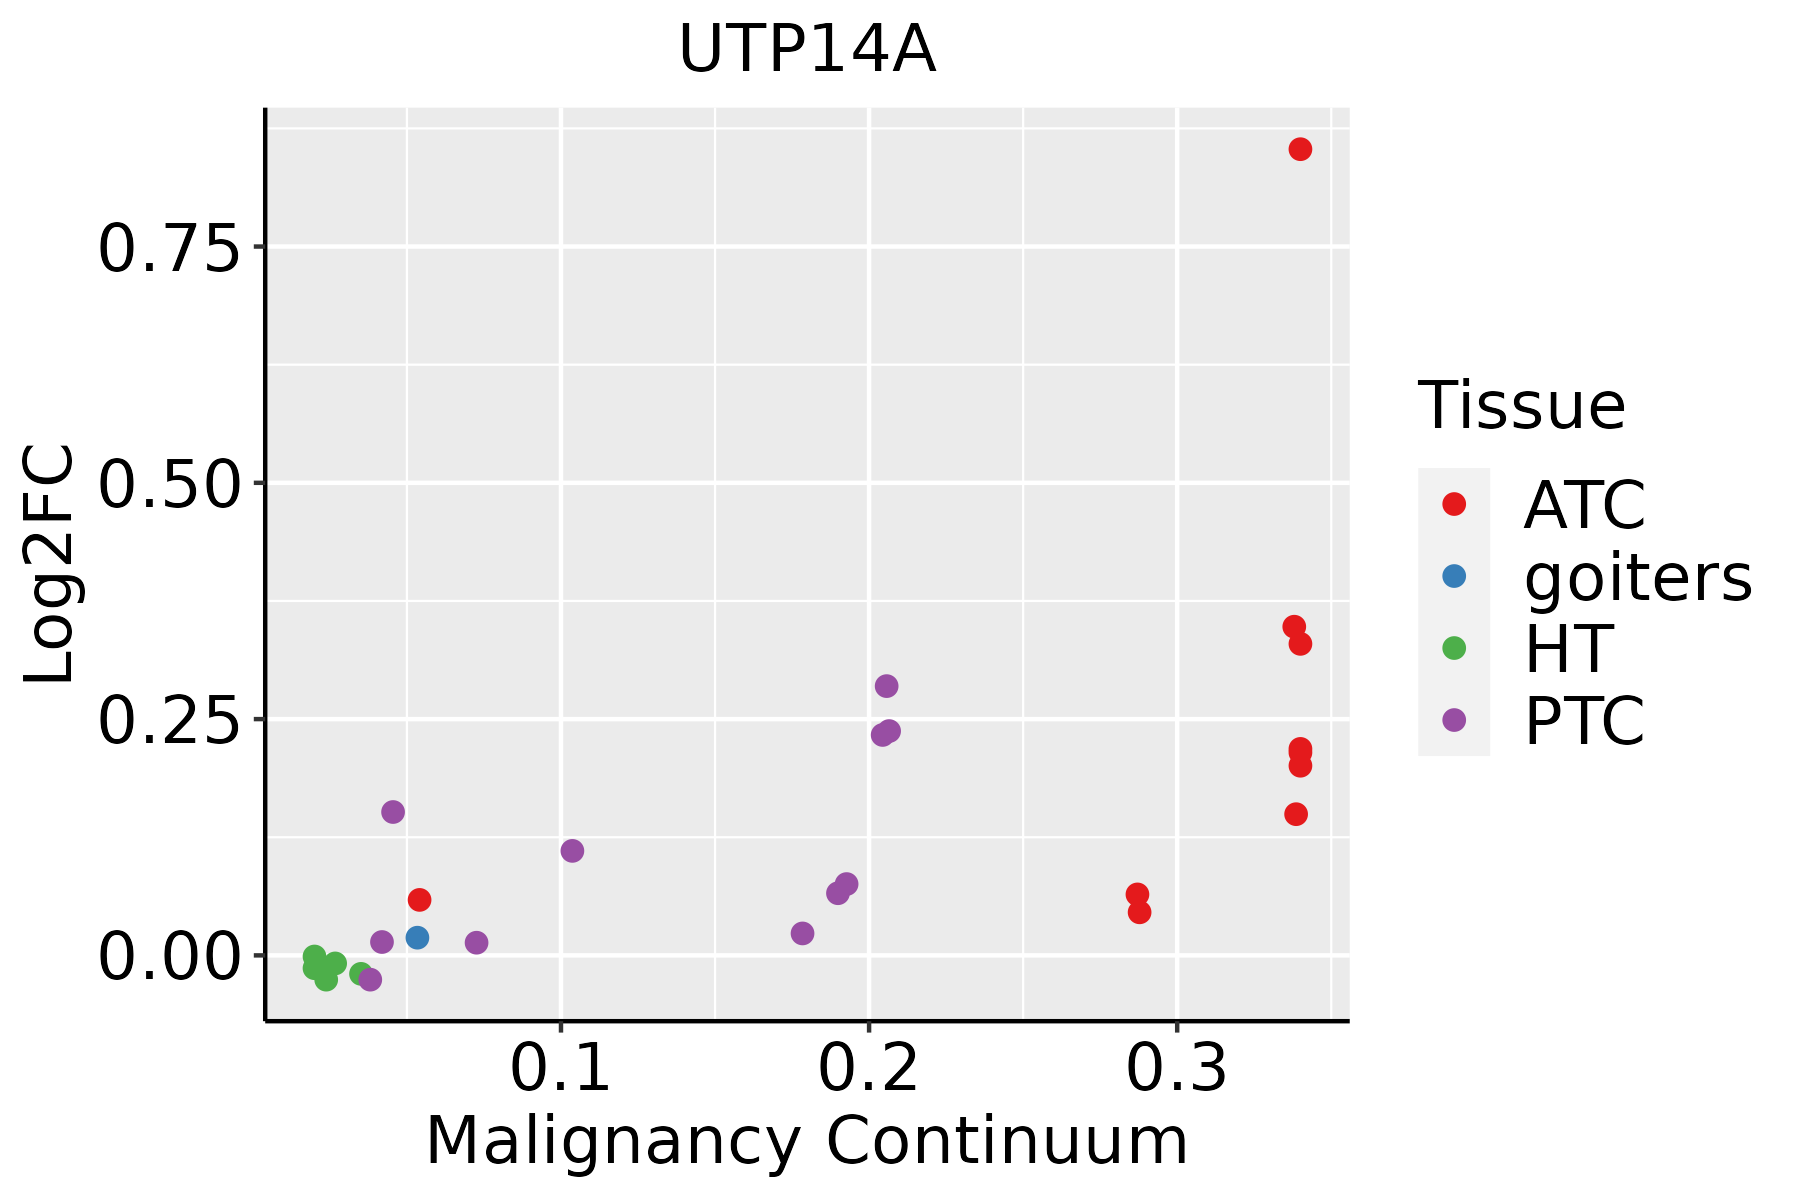 | ATC: Anaplastic thyroid cancer |
| HT: Hashimoto's thyroiditis | ||
| PTC: Papillary thyroid cancer |
| ∗log2FC in expression of this searched gene in stem-like cells from each diseased tissue sample relative to stem-like cells in normal samples in each tissue plotted against the malignancy continuum. Samples are colored based on if they are from different disease stage. |
Top |
Malignant transformation related pathway analysis |
| Find out the enriched GO biological processes and KEGG pathways involved in transition from healthy to precancer to cancer |
| Tissue | Disease Stage | Enriched GO biological Processes |
| Colorectum | AD |  |
| Colorectum | SER |  |
| Colorectum | MSS |  |
| Colorectum | MSI-H |  |
| Colorectum | FAP |  |
| ∗Top 15 enriched GO BP terms are showed in the bar plot of each disease state in each tissue. Each row represents a significant GO biological process which is colored according to the -log10(p.adjust). |
| Page: 1 2 3 4 5 6 7 8 9 |
| GO ID | Tissue | Disease Stage | Description | Gene Ratio | Bg Ratio | pvalue | p.adjust | Count |
| GO:000636410 | Oral cavity | OSCC | rRNA processing | 172/7305 | 225/18723 | 1.57e-30 | 1.24e-27 | 172 |
| GO:00344709 | Oral cavity | OSCC | ncRNA processing | 263/7305 | 395/18723 | 4.38e-29 | 2.78e-26 | 263 |
| GO:001607210 | Oral cavity | OSCC | rRNA metabolic process | 176/7305 | 236/18723 | 6.51e-29 | 3.24e-26 | 176 |
| GO:00346605 | Oral cavity | OSCC | ncRNA metabolic process | 296/7305 | 485/18723 | 2.94e-23 | 6.65e-21 | 296 |
| GO:002261328 | Skin | AK | ribonucleoprotein complex biogenesis | 108/1910 | 463/18723 | 8.48e-17 | 6.27e-14 | 108 |
| GO:004225427 | Skin | AK | ribosome biogenesis | 73/1910 | 299/18723 | 8.44e-13 | 2.08e-10 | 73 |
| GO:000636420 | Skin | AK | rRNA processing | 53/1910 | 225/18723 | 4.35e-09 | 3.30e-07 | 53 |
| GO:001607220 | Skin | AK | rRNA metabolic process | 54/1910 | 236/18723 | 9.23e-09 | 6.07e-07 | 54 |
| GO:003447016 | Skin | AK | ncRNA processing | 68/1910 | 395/18723 | 1.12e-05 | 2.33e-04 | 68 |
| GO:00346607 | Skin | AK | ncRNA metabolic process | 75/1910 | 485/18723 | 1.64e-04 | 1.93e-03 | 75 |
| GO:002261329 | Skin | cSCC | ribonucleoprotein complex biogenesis | 302/4864 | 463/18723 | 5.13e-72 | 3.22e-68 | 302 |
| GO:004225428 | Skin | cSCC | ribosome biogenesis | 206/4864 | 299/18723 | 3.33e-55 | 1.04e-51 | 206 |
| GO:000636424 | Skin | cSCC | rRNA processing | 156/4864 | 225/18723 | 1.42e-42 | 1.48e-39 | 156 |
| GO:001607224 | Skin | cSCC | rRNA metabolic process | 158/4864 | 236/18723 | 4.06e-40 | 2.83e-37 | 158 |
| GO:003447017 | Skin | cSCC | ncRNA processing | 215/4864 | 395/18723 | 6.83e-34 | 4.28e-31 | 215 |
| GO:003466013 | Skin | cSCC | ncRNA metabolic process | 234/4864 | 485/18723 | 1.37e-26 | 4.77e-24 | 234 |
| GO:0022613113 | Thyroid | PTC | ribonucleoprotein complex biogenesis | 292/5968 | 463/18723 | 3.24e-44 | 2.05e-40 | 292 |
| GO:0042254113 | Thyroid | PTC | ribosome biogenesis | 202/5968 | 299/18723 | 3.47e-37 | 5.47e-34 | 202 |
| GO:0006364112 | Thyroid | PTC | rRNA processing | 156/5968 | 225/18723 | 5.58e-31 | 5.03e-28 | 156 |
| GO:0016072112 | Thyroid | PTC | rRNA metabolic process | 160/5968 | 236/18723 | 5.68e-30 | 3.58e-27 | 160 |
| Page: 1 2 3 |
| Pathway ID | Tissue | Disease Stage | Description | Gene Ratio | Bg Ratio | pvalue | p.adjust | qvalue | Count |
| Page: 1 |
Top |
Cell-cell communication analysis |
| Identification of potential cell-cell interactions between two cell types and their ligand-receptor pairs for different disease states |
| Ligand | Receptor | LRpair | Pathway | Tissue | Disease Stage |
| Page: 1 |
Top |
Single-cell gene regulatory network inference analysis |
| Find out the significant the regulons (TFs) and the target genes of each regulon across cell types for different disease states |
| TF | Cell Type | Tissue | Disease Stage | Target Gene | RSS | Regulon Activity |
| ∗The dot plots of a searched regulon are shown for all cell subpopulations in each disease state of each tissue based on the regulon specific score inferred using pySCENIC and by calculating the average expression. |
| Page: 1 |
Top |
Somatic mutation of malignant transformation related genes |
| Annotation of somatic variants for genes involved in malignant transformation |
| Hugo Symbol | Variant Class | Variant Classification | dbSNP RS | HGVSc | HGVSp | HGVSp Short | SWISSPROT | BIOTYPE | SIFT | PolyPhen | Tumor Sample Barcode | Tissue | Histology | Sex | Age | Stage | Therapy Types | Drugs | Outcome |
| UTP14A | SNV | Missense_Mutation | c.1178C>T | p.Pro393Leu | p.P393L | Q9BVJ6 | protein_coding | tolerated(0.13) | benign(0.034) | TCGA-A2-A04N-01 | Breast | breast invasive carcinoma | Female | >=65 | I/II | Chemotherapy | cytoxan | SD | |
| UTP14A | SNV | Missense_Mutation | rs754696456 | c.1874N>C | p.Asp625Ala | p.D625A | Q9BVJ6 | protein_coding | deleterious(0) | probably_damaging(0.963) | TCGA-A2-A0CS-01 | Breast | breast invasive carcinoma | Female | >=65 | III/IV | Hormone Therapy | anastrozole | SD |
| UTP14A | SNV | Missense_Mutation | c.1544N>C | p.Glu515Ala | p.E515A | Q9BVJ6 | protein_coding | deleterious(0.01) | benign(0.32) | TCGA-A8-A081-01 | Breast | breast invasive carcinoma | Female | >=65 | I/II | Unknown | Unknown | SD | |
| UTP14A | SNV | Missense_Mutation | c.1948N>G | p.Leu650Val | p.L650V | Q9BVJ6 | protein_coding | deleterious(0.01) | possibly_damaging(0.557) | TCGA-AC-A23H-01 | Breast | breast invasive carcinoma | Female | >=65 | I/II | Unknown | Unknown | PD | |
| UTP14A | SNV | Missense_Mutation | c.1516N>A | p.Glu506Lys | p.E506K | Q9BVJ6 | protein_coding | tolerated(0.22) | benign(0.09) | TCGA-B6-A1KF-01 | Breast | breast invasive carcinoma | Female | >=65 | I/II | Unknown | Unknown | SD | |
| UTP14A | SNV | Missense_Mutation | novel | c.224N>G | p.Asn75Ser | p.N75S | Q9BVJ6 | protein_coding | tolerated(0.57) | benign(0.005) | TCGA-B6-A400-01 | Breast | breast invasive carcinoma | Female | <65 | III/IV | Unknown | Unknown | SD |
| UTP14A | SNV | Missense_Mutation | c.2258N>T | p.Asn753Ile | p.N753I | Q9BVJ6 | protein_coding | tolerated_low_confidence(0.13) | benign(0.01) | TCGA-E2-A14V-01 | Breast | breast invasive carcinoma | Female | <65 | I/II | Chemotherapy | cyclophosphamide | SD | |
| UTP14A | SNV | Missense_Mutation | novel | c.122N>C | p.Arg41Thr | p.R41T | Q9BVJ6 | protein_coding | deleterious(0) | probably_damaging(0.925) | TCGA-EA-A3HU-01 | Cervix | cervical & endocervical cancer | Female | <65 | I/II | Unknown | Unknown | SD |
| UTP14A | SNV | Missense_Mutation | c.1600G>A | p.Glu534Lys | p.E534K | Q9BVJ6 | protein_coding | tolerated(0.6) | benign(0.01) | TCGA-HM-A3JK-01 | Cervix | cervical & endocervical cancer | Female | <65 | I/II | Chemotherapy | cisplatin | SD | |
| UTP14A | SNV | Missense_Mutation | novel | c.1246N>C | p.Glu416Gln | p.E416Q | Q9BVJ6 | protein_coding | deleterious(0.01) | possibly_damaging(0.756) | TCGA-JW-A5VL-01 | Cervix | cervical & endocervical cancer | Female | <65 | I/II | Unknown | Unknown | SD |
| Page: 1 2 3 4 5 6 7 8 9 10 11 |
Top |
Related drugs of malignant transformation related genes |
| Identification of chemicals and drugs interact with genes involved in malignant transfromation |
| (DGIdb 4.0) |
| Entrez ID | Symbol | Category | Interaction Types | Drug Claim Name | Drug Name | PMIDs |
| Page: 1 |

Copyright 2023-Present -The University of Texas Health Science Center at Houston |