
|
|||||
|
 | |
| |
| |
| |
| |
| |
|
Gene: USP39 |
Gene summary for USP39 |
| Gene information | Species | Human | Gene symbol | USP39 | Gene ID | 10713 |
| Gene name | ubiquitin specific peptidase 39 | |
| Gene Alias | 65K | |
| Cytomap | 2p11.2 | |
| Gene Type | protein-coding | GO ID | GO:0000245 | UniProtAcc | Q53GS9 |
Top |
Malignant transformation analysis |
| Identification of the aberrant gene expression in precancerous and cancerous lesions by comparing the gene expression of stem-like cells in diseased tissues with normal stem cells |
| Entrez ID | Symbol | Replicates | Species | Organ | Tissue | Adj P-value | Log2FC | Malignancy |
| 10713 | USP39 | LZE2T | Human | Esophagus | ESCC | 3.84e-08 | 5.19e-01 | 0.082 |
| 10713 | USP39 | LZE4T | Human | Esophagus | ESCC | 4.25e-18 | 4.18e-01 | 0.0811 |
| 10713 | USP39 | LZE7T | Human | Esophagus | ESCC | 1.29e-13 | 7.91e-01 | 0.0667 |
| 10713 | USP39 | LZE8T | Human | Esophagus | ESCC | 5.17e-08 | 2.28e-01 | 0.067 |
| 10713 | USP39 | LZE20T | Human | Esophagus | ESCC | 1.25e-04 | 8.65e-02 | 0.0662 |
| 10713 | USP39 | LZE22T | Human | Esophagus | ESCC | 4.72e-03 | 4.26e-01 | 0.068 |
| 10713 | USP39 | LZE24T | Human | Esophagus | ESCC | 8.48e-23 | 4.34e-01 | 0.0596 |
| 10713 | USP39 | LZE21T | Human | Esophagus | ESCC | 8.97e-10 | 4.96e-01 | 0.0655 |
| 10713 | USP39 | LZE6T | Human | Esophagus | ESCC | 1.38e-07 | 4.40e-01 | 0.0845 |
| 10713 | USP39 | P1T-E | Human | Esophagus | ESCC | 4.65e-07 | 3.90e-01 | 0.0875 |
| 10713 | USP39 | P2T-E | Human | Esophagus | ESCC | 1.20e-43 | 8.92e-01 | 0.1177 |
| 10713 | USP39 | P4T-E | Human | Esophagus | ESCC | 5.66e-25 | 6.70e-01 | 0.1323 |
| 10713 | USP39 | P5T-E | Human | Esophagus | ESCC | 1.56e-13 | 3.54e-01 | 0.1327 |
| 10713 | USP39 | P8T-E | Human | Esophagus | ESCC | 1.14e-18 | 3.95e-01 | 0.0889 |
| 10713 | USP39 | P9T-E | Human | Esophagus | ESCC | 3.33e-17 | 3.74e-01 | 0.1131 |
| 10713 | USP39 | P10T-E | Human | Esophagus | ESCC | 1.56e-13 | 1.78e-01 | 0.116 |
| 10713 | USP39 | P11T-E | Human | Esophagus | ESCC | 1.53e-17 | 5.19e-01 | 0.1426 |
| 10713 | USP39 | P12T-E | Human | Esophagus | ESCC | 2.15e-38 | 8.36e-01 | 0.1122 |
| 10713 | USP39 | P15T-E | Human | Esophagus | ESCC | 3.82e-44 | 8.49e-01 | 0.1149 |
| 10713 | USP39 | P16T-E | Human | Esophagus | ESCC | 3.52e-43 | 7.96e-01 | 0.1153 |
| Page: 1 2 3 4 5 |
| Tissue | Expression Dynamics | Abbreviation |
| Esophagus | 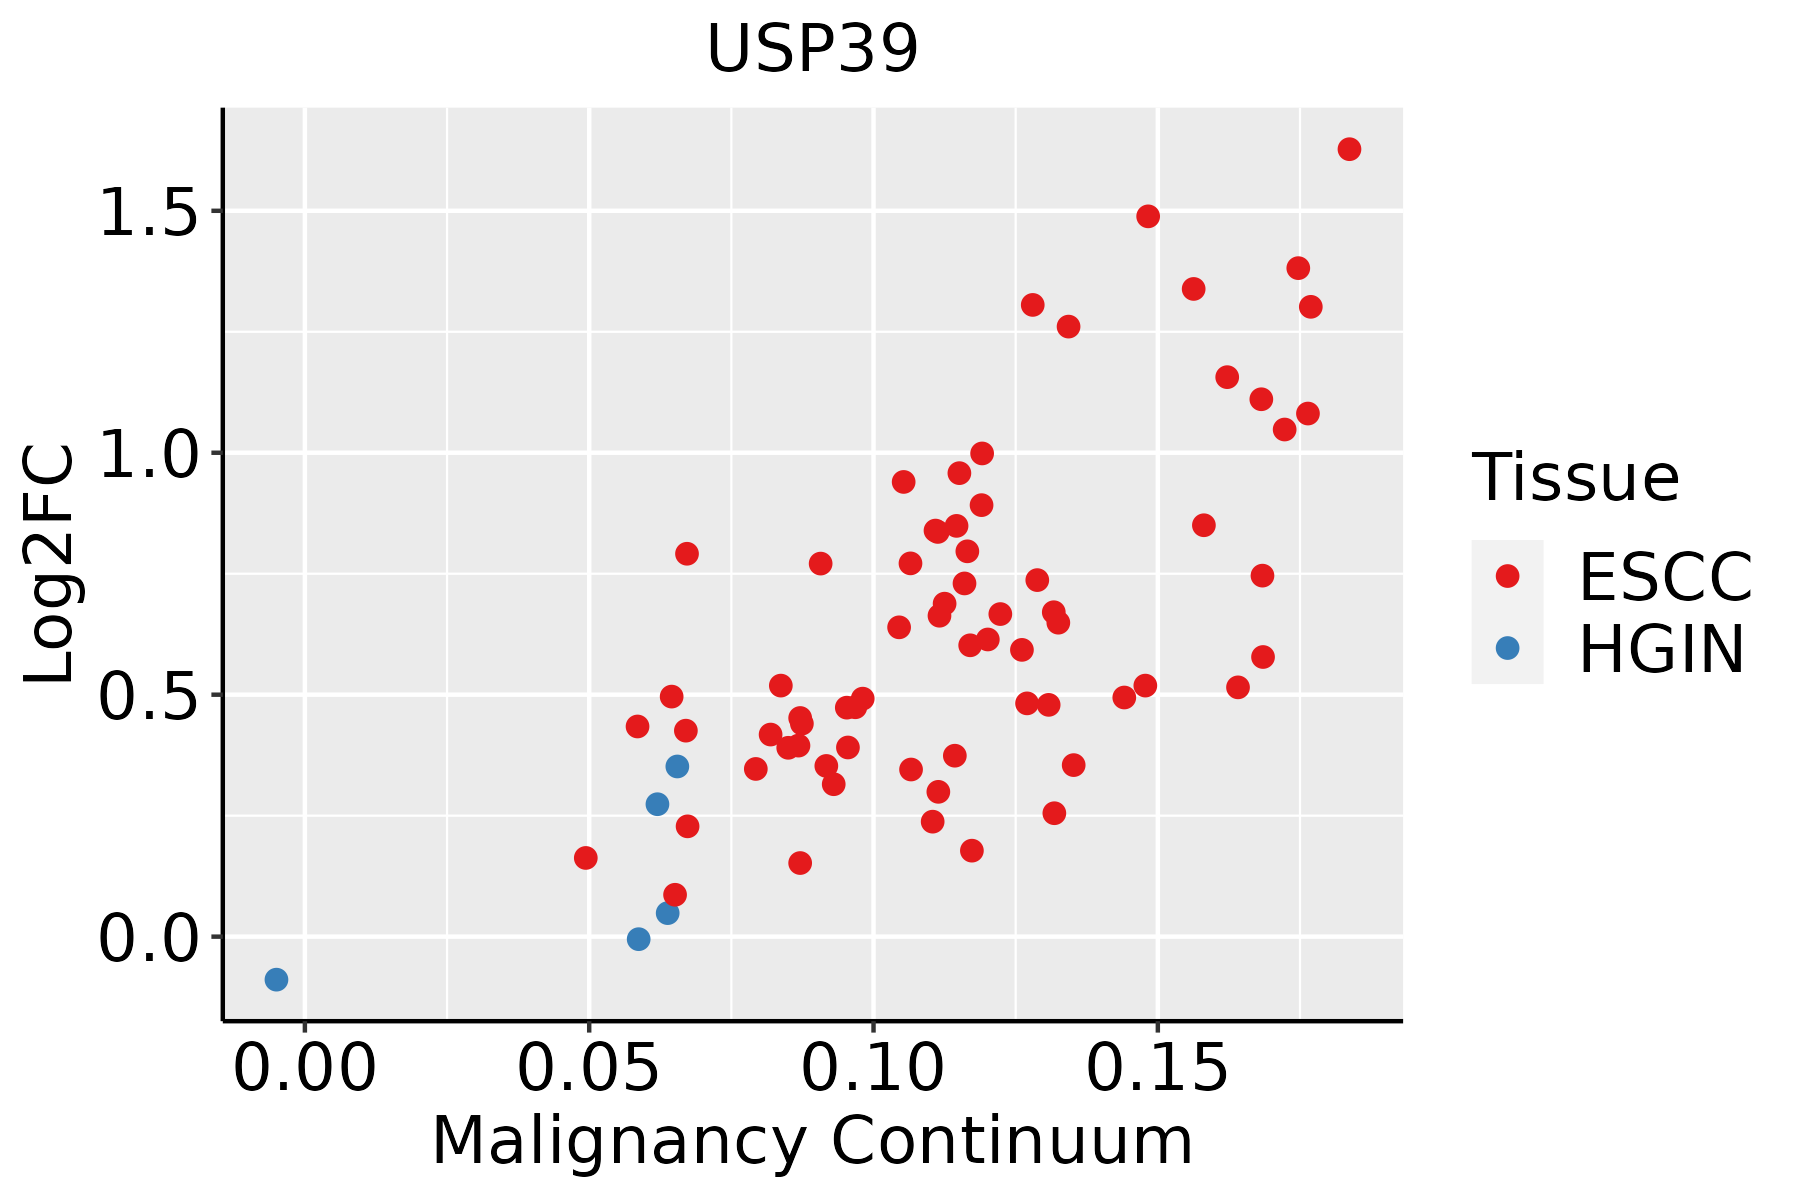 | ESCC: Esophageal squamous cell carcinoma |
| HGIN: High-grade intraepithelial neoplasias | ||
| LGIN: Low-grade intraepithelial neoplasias | ||
| Liver | 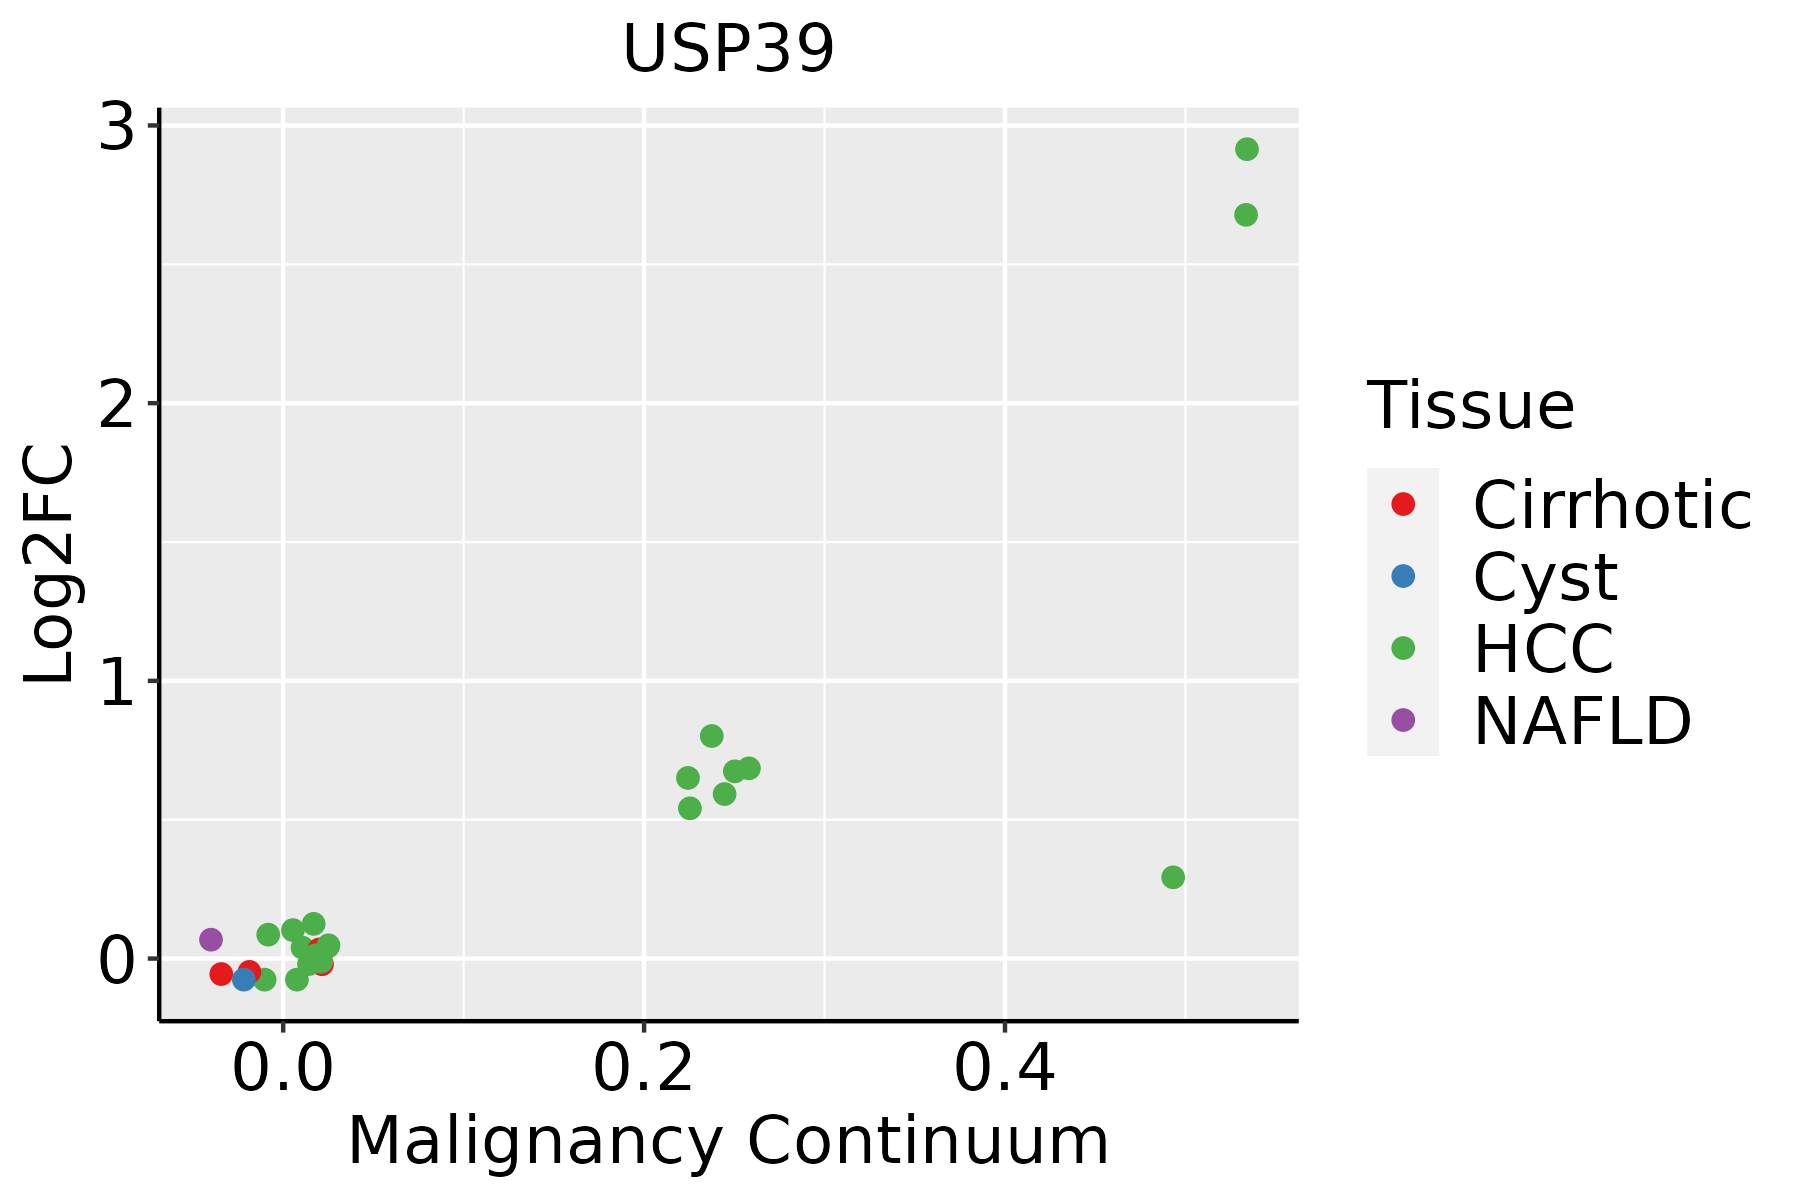 | HCC: Hepatocellular carcinoma |
| NAFLD: Non-alcoholic fatty liver disease | ||
| Oral Cavity | 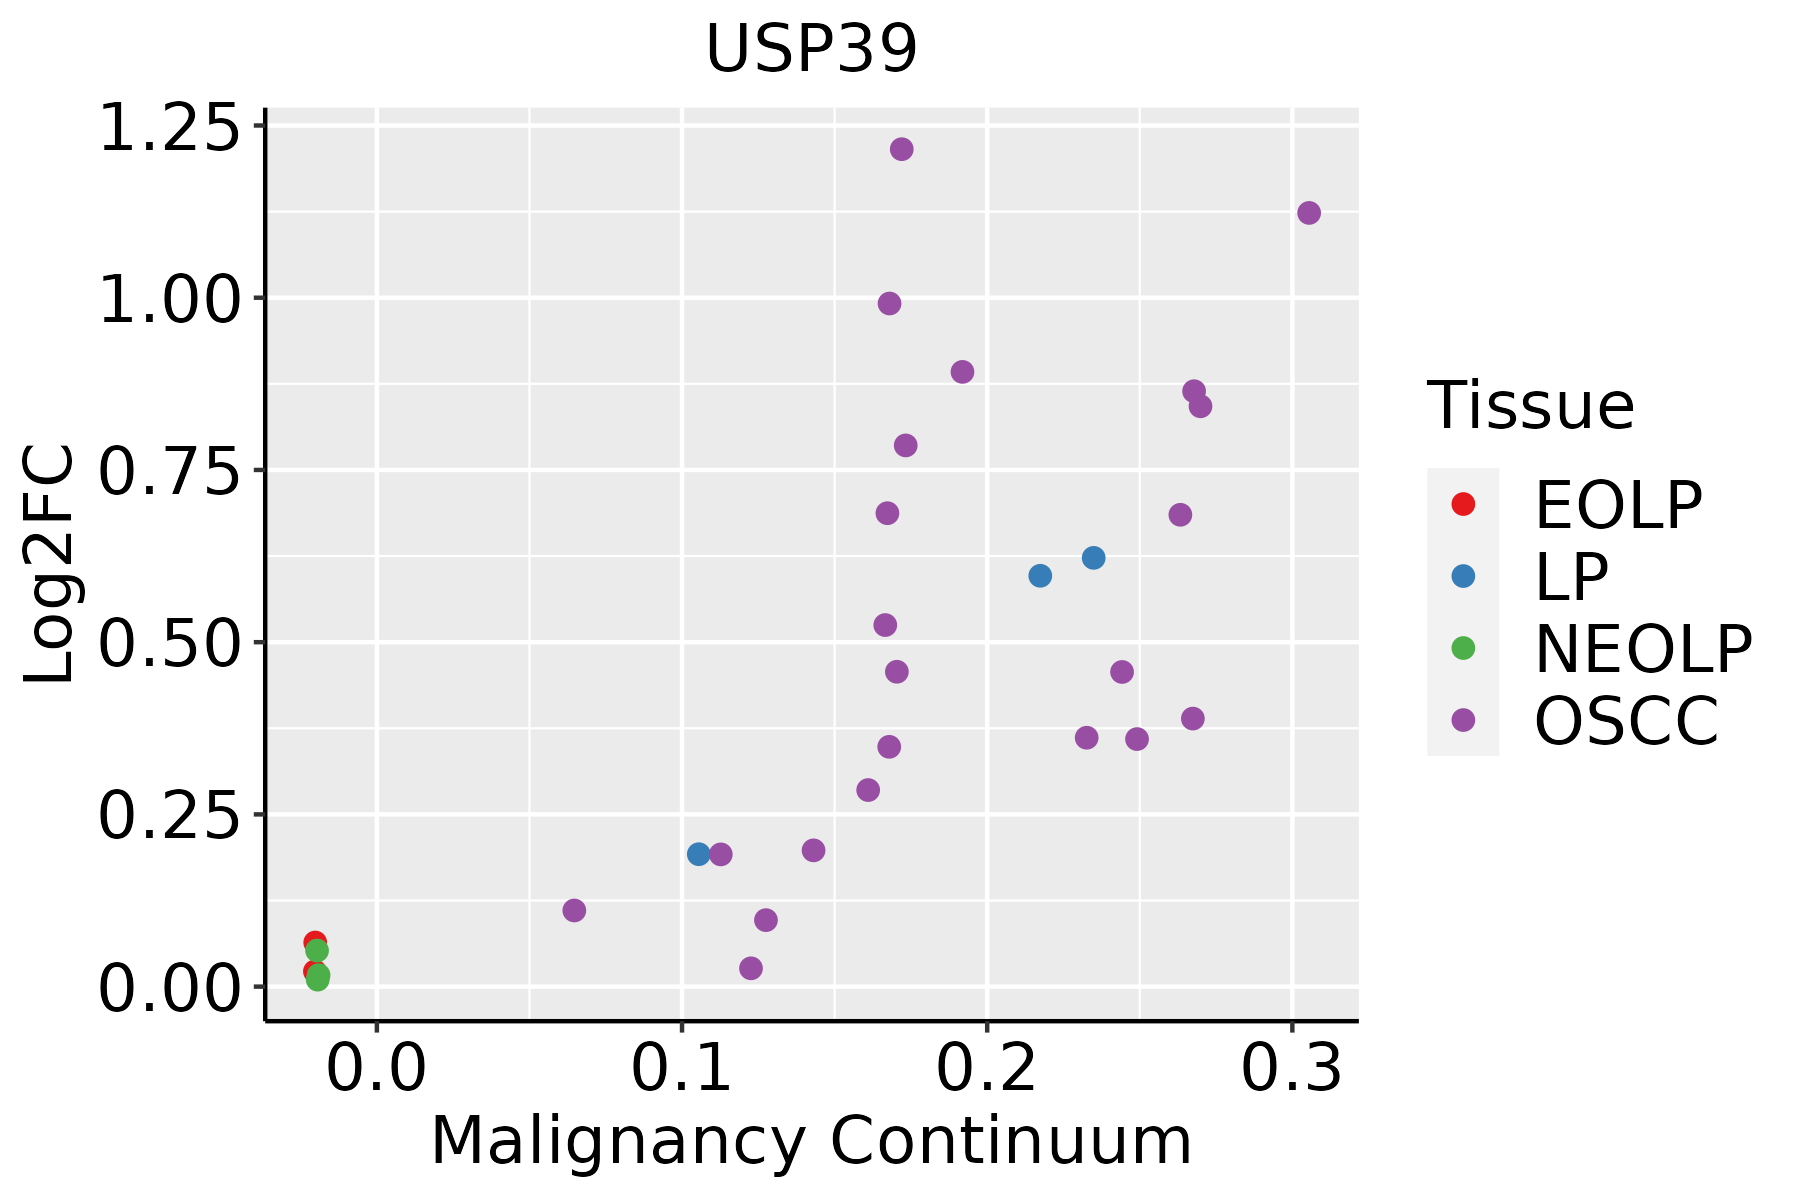 | EOLP: Erosive Oral lichen planus |
| LP: leukoplakia | ||
| NEOLP: Non-erosive oral lichen planus | ||
| OSCC: Oral squamous cell carcinoma | ||
| Skin | 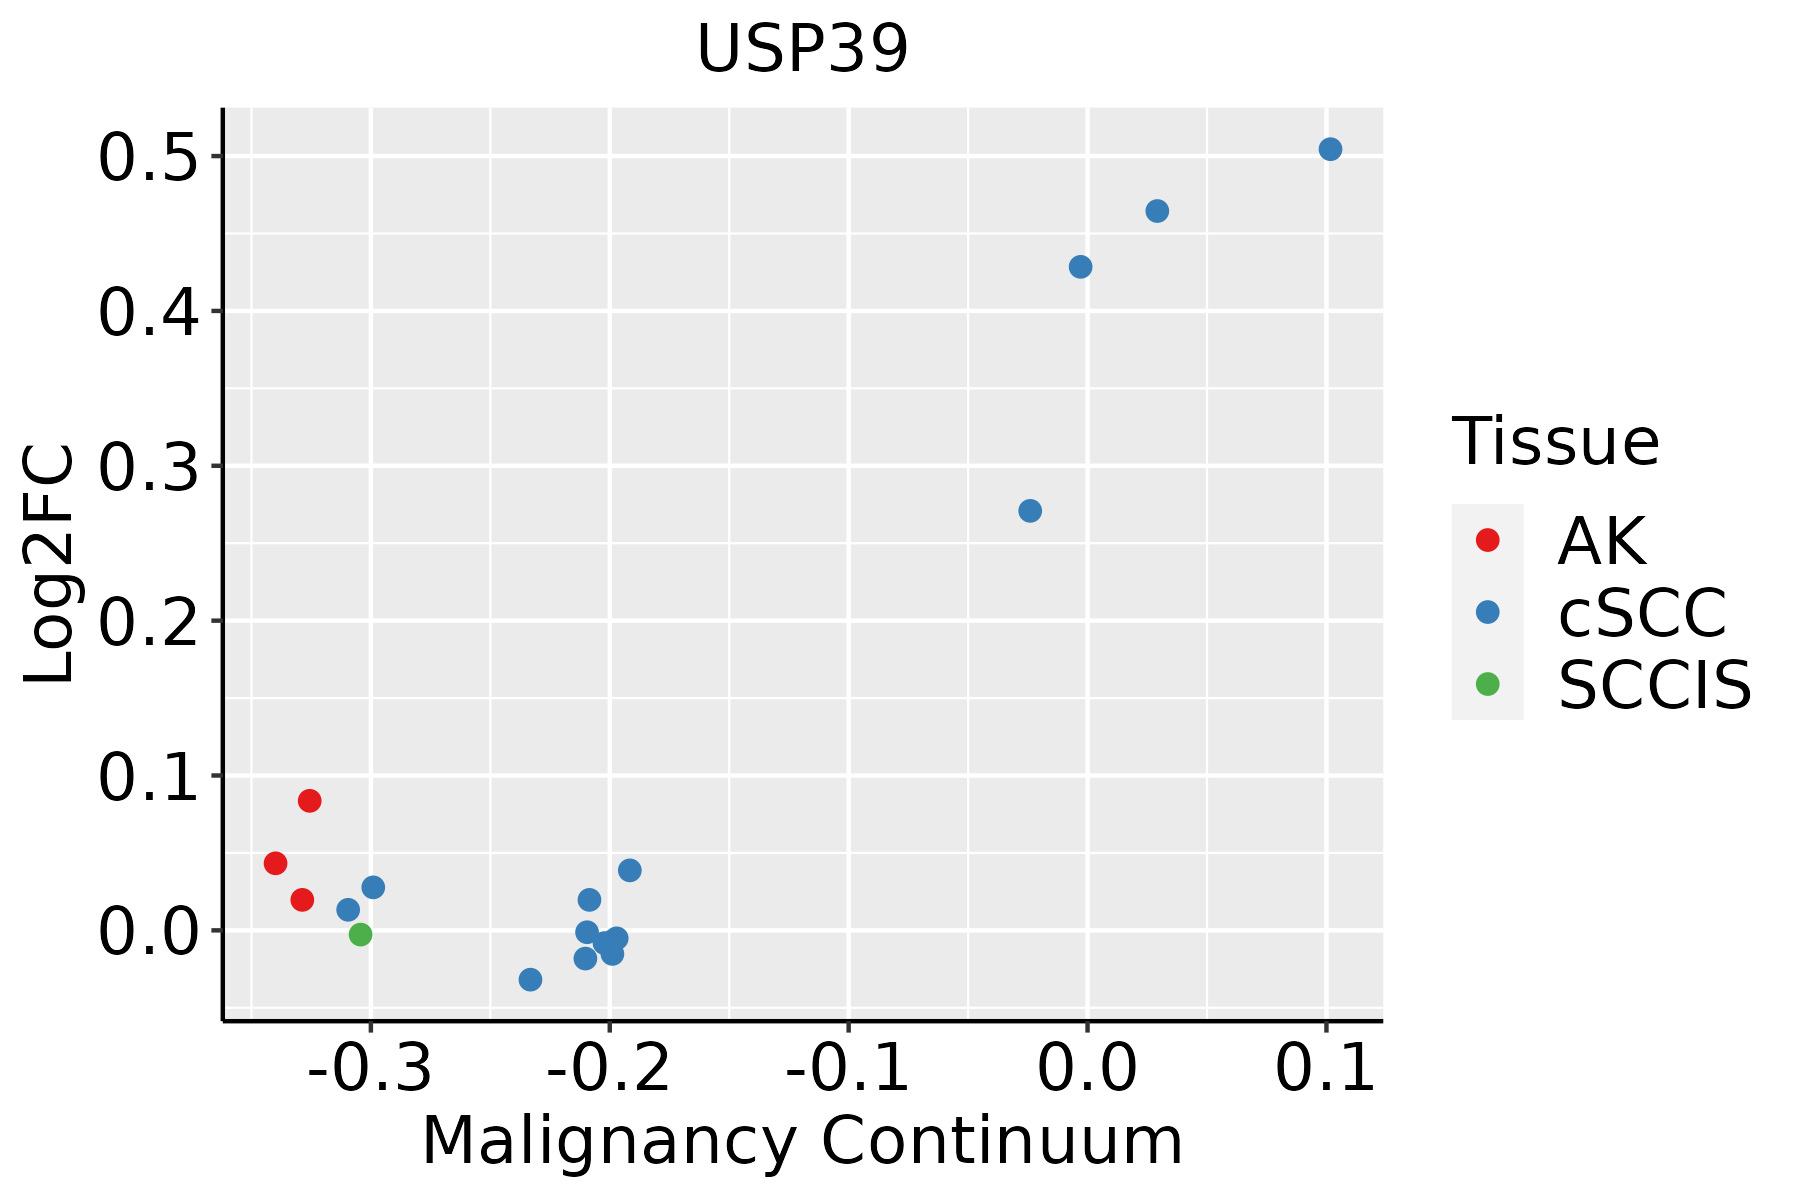 | AK: Actinic keratosis |
| cSCC: Cutaneous squamous cell carcinoma | ||
| SCCIS:squamous cell carcinoma in situ |
| ∗log2FC in expression of this searched gene in stem-like cells from each diseased tissue sample relative to stem-like cells in normal samples in each tissue plotted against the malignancy continuum. Samples are colored based on if they are from different disease stage. |
Top |
Malignant transformation related pathway analysis |
| Find out the enriched GO biological processes and KEGG pathways involved in transition from healthy to precancer to cancer |
| Tissue | Disease Stage | Enriched GO biological Processes |
| Colorectum | AD |  |
| Colorectum | SER |  |
| Colorectum | MSS |  |
| Colorectum | MSI-H |  |
| Colorectum | FAP |  |
| ∗Top 15 enriched GO BP terms are showed in the bar plot of each disease state in each tissue. Each row represents a significant GO biological process which is colored according to the -log10(p.adjust). |
| Page: 1 2 3 4 5 6 7 8 9 |
| GO ID | Tissue | Disease Stage | Description | Gene Ratio | Bg Ratio | pvalue | p.adjust | Count |
| GO:002261320 | Oral cavity | OSCC | ribonucleoprotein complex biogenesis | 333/7305 | 463/18723 | 8.28e-48 | 5.24e-44 | 333 |
| GO:000838020 | Oral cavity | OSCC | RNA splicing | 308/7305 | 434/18723 | 2.43e-42 | 7.70e-39 | 308 |
| GO:000037519 | Oral cavity | OSCC | RNA splicing, via transesterification reactions | 225/7305 | 324/18723 | 5.20e-29 | 2.99e-26 | 225 |
| GO:000037719 | Oral cavity | OSCC | RNA splicing, via transesterification reactions with bulged adenosine as nucleophile | 221/7305 | 320/18723 | 5.50e-28 | 2.18e-25 | 221 |
| GO:000039819 | Oral cavity | OSCC | mRNA splicing, via spliceosome | 221/7305 | 320/18723 | 5.50e-28 | 2.18e-25 | 221 |
| GO:007182620 | Oral cavity | OSCC | ribonucleoprotein complex subunit organization | 152/7305 | 227/18723 | 1.05e-17 | 1.01e-15 | 152 |
| GO:002261820 | Oral cavity | OSCC | ribonucleoprotein complex assembly | 146/7305 | 220/18723 | 1.53e-16 | 1.23e-14 | 146 |
| GO:00002456 | Oral cavity | OSCC | spliceosomal complex assembly | 45/7305 | 79/18723 | 9.13e-04 | 4.81e-03 | 45 |
| GO:00706462 | Oral cavity | OSCC | protein modification by small protein removal | 77/7305 | 157/18723 | 6.55e-03 | 2.43e-02 | 77 |
| GO:0022613110 | Oral cavity | LP | ribonucleoprotein complex biogenesis | 259/4623 | 463/18723 | 7.20e-48 | 2.25e-44 | 259 |
| GO:0008380110 | Oral cavity | LP | RNA splicing | 237/4623 | 434/18723 | 1.82e-41 | 3.79e-38 | 237 |
| GO:0000375110 | Oral cavity | LP | RNA splicing, via transesterification reactions | 181/4623 | 324/18723 | 1.36e-33 | 1.70e-30 | 181 |
| GO:0000377110 | Oral cavity | LP | RNA splicing, via transesterification reactions with bulged adenosine as nucleophile | 179/4623 | 320/18723 | 2.48e-33 | 2.22e-30 | 179 |
| GO:0000398110 | Oral cavity | LP | mRNA splicing, via spliceosome | 179/4623 | 320/18723 | 2.48e-33 | 2.22e-30 | 179 |
| GO:0071826110 | Oral cavity | LP | ribonucleoprotein complex subunit organization | 130/4623 | 227/18723 | 7.54e-26 | 3.63e-23 | 130 |
| GO:0022618110 | Oral cavity | LP | ribonucleoprotein complex assembly | 125/4623 | 220/18723 | 1.76e-24 | 6.91e-22 | 125 |
| GO:000024513 | Oral cavity | LP | spliceosomal complex assembly | 34/4623 | 79/18723 | 2.65e-04 | 2.75e-03 | 34 |
| GO:002261329 | Skin | cSCC | ribonucleoprotein complex biogenesis | 302/4864 | 463/18723 | 5.13e-72 | 3.22e-68 | 302 |
| GO:0008380112 | Skin | cSCC | RNA splicing | 263/4864 | 434/18723 | 2.45e-53 | 5.13e-50 | 263 |
| GO:0000375112 | Skin | cSCC | RNA splicing, via transesterification reactions | 201/4864 | 324/18723 | 4.07e-43 | 5.10e-40 | 201 |
| Page: 1 2 3 |
| Pathway ID | Tissue | Disease Stage | Description | Gene Ratio | Bg Ratio | pvalue | p.adjust | qvalue | Count |
| hsa0304027 | Esophagus | ESCC | Spliceosome | 128/4205 | 217/8465 | 3.31e-03 | 8.79e-03 | 4.50e-03 | 128 |
| hsa0304037 | Esophagus | ESCC | Spliceosome | 128/4205 | 217/8465 | 3.31e-03 | 8.79e-03 | 4.50e-03 | 128 |
| hsa0304022 | Liver | HCC | Spliceosome | 122/4020 | 217/8465 | 5.55e-03 | 1.60e-02 | 8.91e-03 | 122 |
| hsa0304032 | Liver | HCC | Spliceosome | 122/4020 | 217/8465 | 5.55e-03 | 1.60e-02 | 8.91e-03 | 122 |
| hsa0304016 | Oral cavity | OSCC | Spliceosome | 123/3704 | 217/8465 | 7.21e-05 | 2.74e-04 | 1.40e-04 | 123 |
| hsa0304017 | Oral cavity | OSCC | Spliceosome | 123/3704 | 217/8465 | 7.21e-05 | 2.74e-04 | 1.40e-04 | 123 |
| hsa0304026 | Oral cavity | LP | Spliceosome | 106/2418 | 217/8465 | 1.30e-10 | 2.40e-09 | 1.55e-09 | 106 |
| hsa0304036 | Oral cavity | LP | Spliceosome | 106/2418 | 217/8465 | 1.30e-10 | 2.40e-09 | 1.55e-09 | 106 |
| Page: 1 |
Top |
Cell-cell communication analysis |
| Identification of potential cell-cell interactions between two cell types and their ligand-receptor pairs for different disease states |
| Ligand | Receptor | LRpair | Pathway | Tissue | Disease Stage |
| Page: 1 |
Top |
Single-cell gene regulatory network inference analysis |
| Find out the significant the regulons (TFs) and the target genes of each regulon across cell types for different disease states |
| TF | Cell Type | Tissue | Disease Stage | Target Gene | RSS | Regulon Activity |
| ∗The dot plots of a searched regulon are shown for all cell subpopulations in each disease state of each tissue based on the regulon specific score inferred using pySCENIC and by calculating the average expression. |
| Page: 1 |
Top |
Somatic mutation of malignant transformation related genes |
| Annotation of somatic variants for genes involved in malignant transformation |
| Hugo Symbol | Variant Class | Variant Classification | dbSNP RS | HGVSc | HGVSp | HGVSp Short | SWISSPROT | BIOTYPE | SIFT | PolyPhen | Tumor Sample Barcode | Tissue | Histology | Sex | Age | Stage | Therapy Types | Drugs | Outcome |
| USP39 | SNV | Missense_Mutation | c.786N>G | p.Ile262Met | p.I262M | Q53GS9 | protein_coding | tolerated(0.11) | possibly_damaging(0.544) | TCGA-AC-A23H-01 | Breast | breast invasive carcinoma | Female | >=65 | I/II | Unknown | Unknown | PD | |
| USP39 | SNV | Missense_Mutation | novel | c.863N>A | p.Arg288Gln | p.R288Q | Q53GS9 | protein_coding | deleterious(0.03) | possibly_damaging(0.701) | TCGA-AN-A046-01 | Breast | breast invasive carcinoma | Female | >=65 | I/II | Unknown | Unknown | SD |
| USP39 | SNV | Missense_Mutation | c.344N>C | p.Val115Ala | p.V115A | Q53GS9 | protein_coding | tolerated(0.07) | benign(0.038) | TCGA-D8-A1XQ-01 | Breast | breast invasive carcinoma | Female | >=65 | I/II | Unknown | Unknown | SD | |
| USP39 | SNV | Missense_Mutation | c.1235N>G | p.Gln412Arg | p.Q412R | Q53GS9 | protein_coding | deleterious(0) | probably_damaging(0.955) | TCGA-D8-A1XQ-01 | Breast | breast invasive carcinoma | Female | >=65 | I/II | Unknown | Unknown | SD | |
| USP39 | SNV | Missense_Mutation | rs769633859 | c.569C>T | p.Thr190Met | p.T190M | Q53GS9 | protein_coding | tolerated(0.07) | benign(0.134) | TCGA-EW-A3U0-01 | Breast | breast invasive carcinoma | Female | <65 | III/IV | Chemotherapy | cisplatin | CR |
| USP39 | SNV | Missense_Mutation | c.469G>A | p.Val157Ile | p.V157I | Q53GS9 | protein_coding | deleterious(0.04) | possibly_damaging(0.531) | TCGA-GI-A2C8-01 | Breast | breast invasive carcinoma | Female | <65 | III/IV | Unspecific | Adriamycin | SD | |
| USP39 | insertion | Nonsense_Mutation | novel | c.429_430insGGCTAGGAATACCTAACTTCCTGGGAATGCAGCCTGTCAAGGCC | p.Gln144GlyfsTer2 | p.Q144Gfs*2 | Q53GS9 | protein_coding | TCGA-A8-A0A4-01 | Breast | breast invasive carcinoma | Female | >=65 | I/II | Hormone Therapy | tamoxiphen | CR | ||
| USP39 | deletion | Frame_Shift_Del | novel | c.722delN | p.Gln241ArgfsTer40 | p.Q241Rfs*40 | Q53GS9 | protein_coding | TCGA-EW-A2FV-01 | Breast | breast invasive carcinoma | Female | <65 | III/IV | Chemotherapy | docetaxel | SD | ||
| USP39 | SNV | Missense_Mutation | rs749981625 | c.1544G>A | p.Arg515Gln | p.R515Q | Q53GS9 | protein_coding | deleterious(0) | possibly_damaging(0.731) | TCGA-2W-A8YY-01 | Cervix | cervical & endocervical cancer | Female | <65 | I/II | Chemotherapy | cisplatin | CR |
| USP39 | SNV | Missense_Mutation | novel | c.121G>A | p.Ala41Thr | p.A41T | Q53GS9 | protein_coding | tolerated_low_confidence(0.62) | benign(0) | TCGA-IR-A3LL-01 | Cervix | cervical & endocervical cancer | Female | <65 | I/II | Chemotherapy | cisplatin | CR |
| Page: 1 2 3 4 |
Top |
Related drugs of malignant transformation related genes |
| Identification of chemicals and drugs interact with genes involved in malignant transfromation |
| (DGIdb 4.0) |
| Entrez ID | Symbol | Category | Interaction Types | Drug Claim Name | Drug Name | PMIDs |
| Page: 1 |

Copyright 2023-Present -The University of Texas Health Science Center at Houston |