| Tissue | Expression Dynamics | Abbreviation |
| Cervix |  | CC: Cervix cancer |
| HSIL_HPV: HPV-infected high-grade squamous intraepithelial lesions |
| N_HPV: HPV-infected normal cervix |
| Colorectum (GSE201348) |  | FAP: Familial adenomatous polyposis |
| CRC: Colorectal cancer |
| Colorectum (HTA11) | 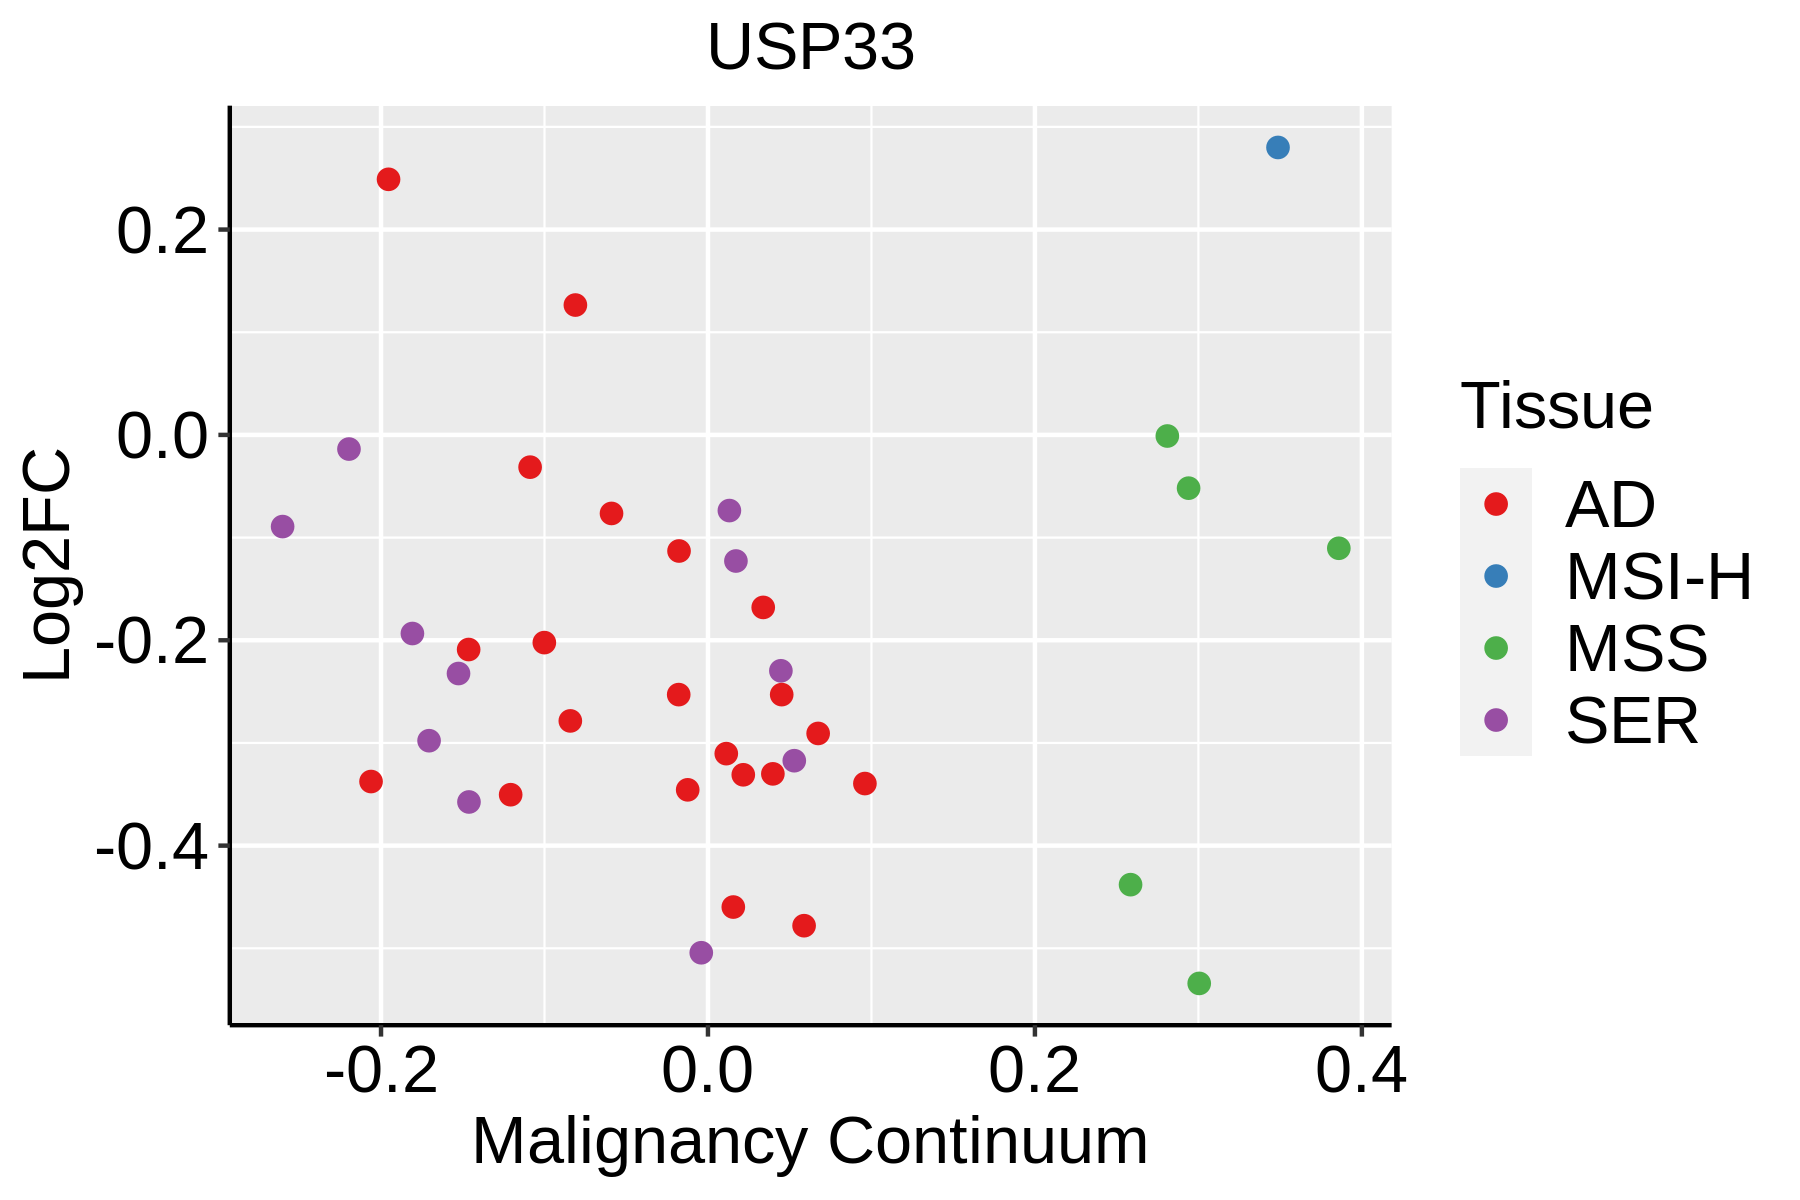 | AD: Adenomas |
| SER: Sessile serrated lesions |
| MSI-H: Microsatellite-high colorectal cancer |
| MSS: Microsatellite stable colorectal cancer |
| Esophagus | 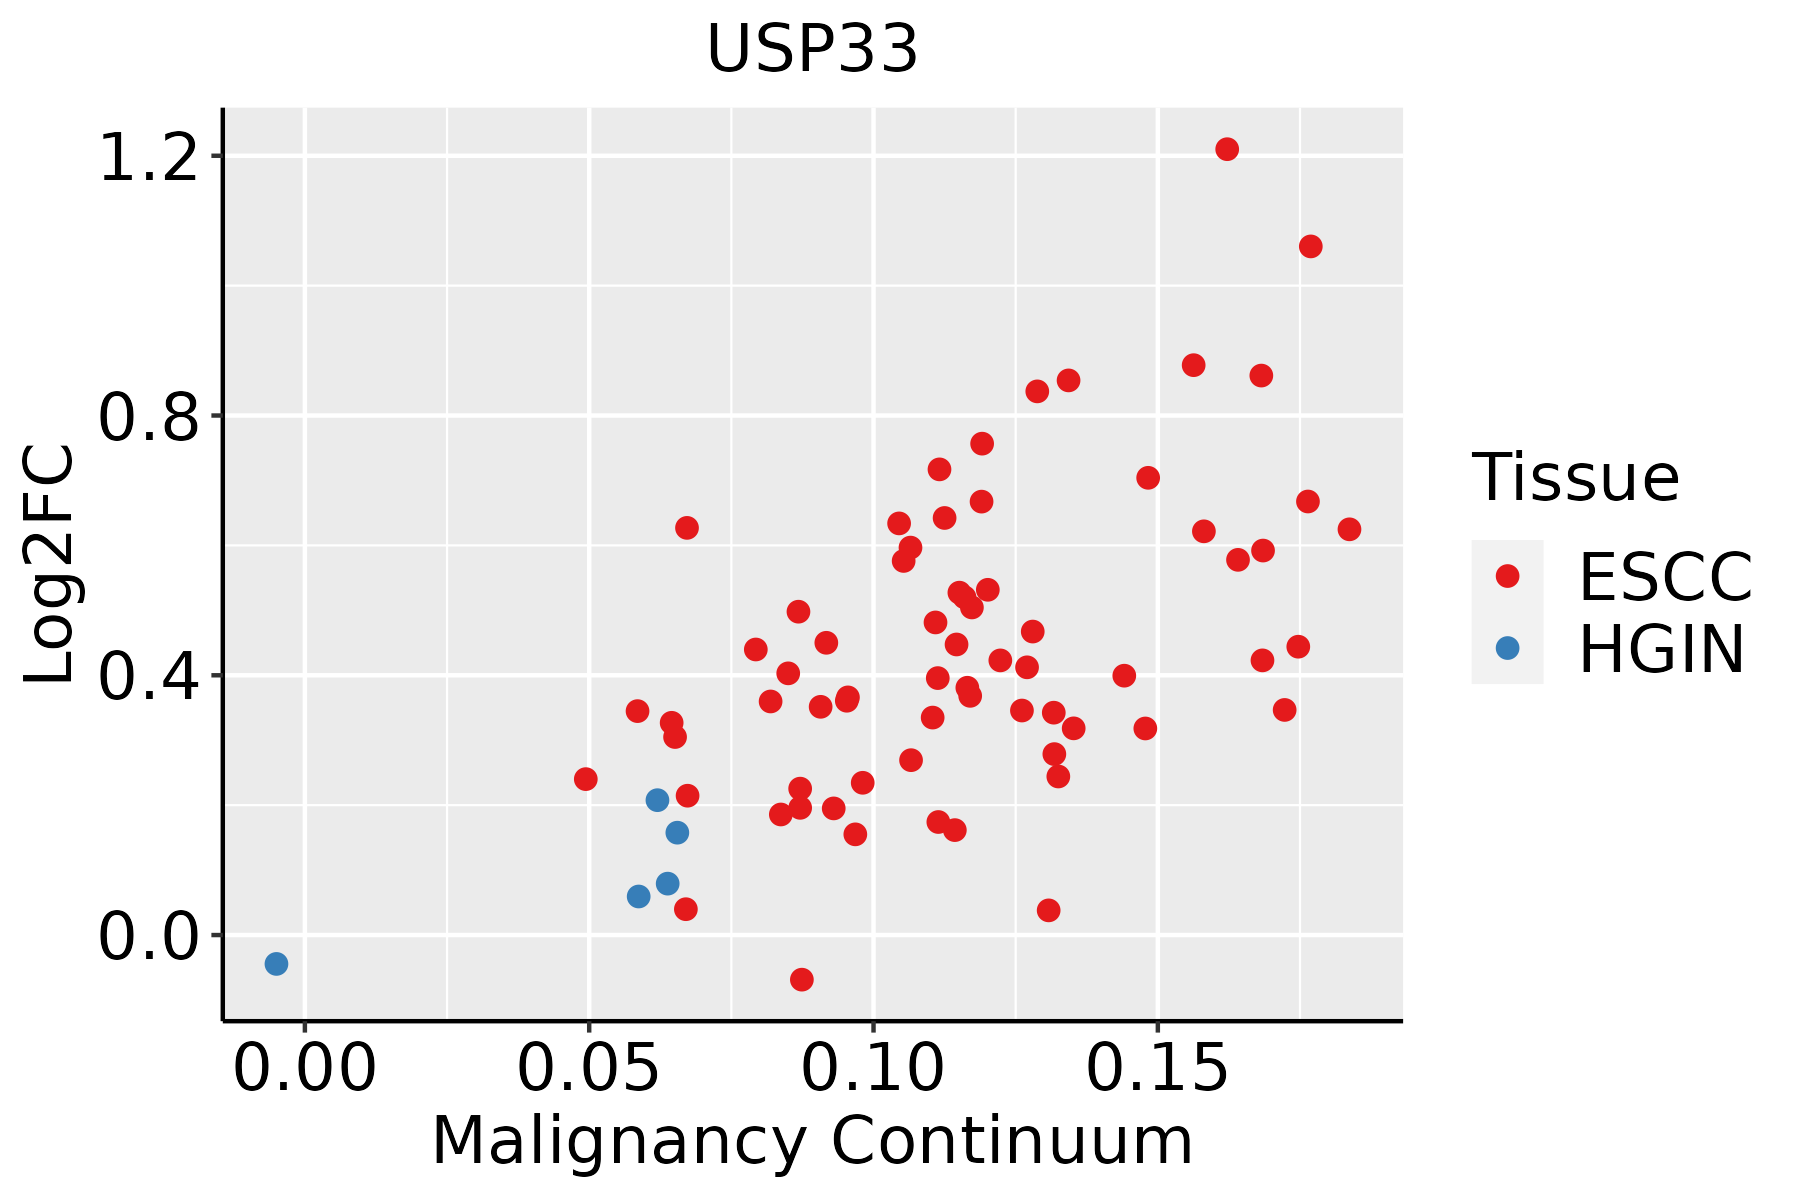 | ESCC: Esophageal squamous cell carcinoma |
| HGIN: High-grade intraepithelial neoplasias |
| LGIN: Low-grade intraepithelial neoplasias |
| Liver |  | HCC: Hepatocellular carcinoma |
| NAFLD: Non-alcoholic fatty liver disease |
| Oral Cavity | 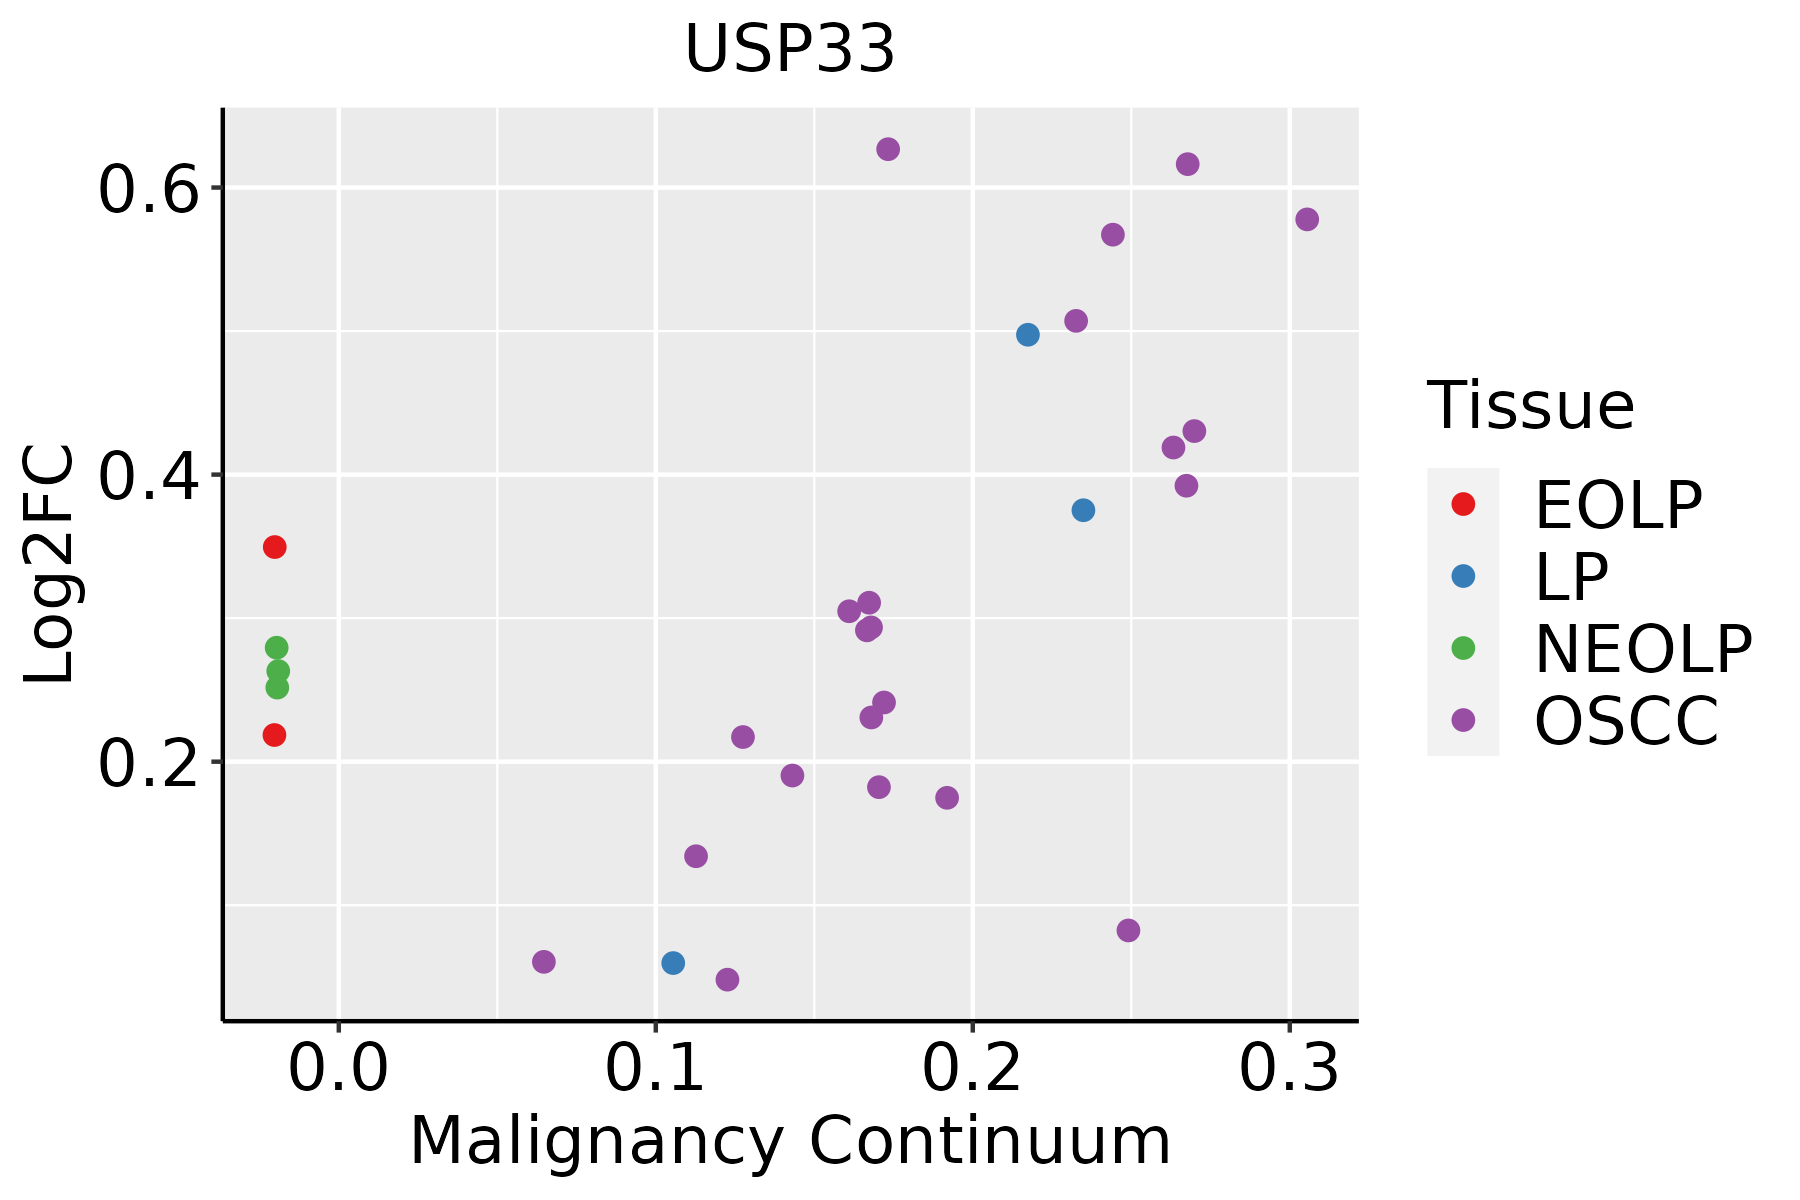 | EOLP: Erosive Oral lichen planus |
| LP: leukoplakia |
| NEOLP: Non-erosive oral lichen planus |
| OSCC: Oral squamous cell carcinoma |
| Prostate | 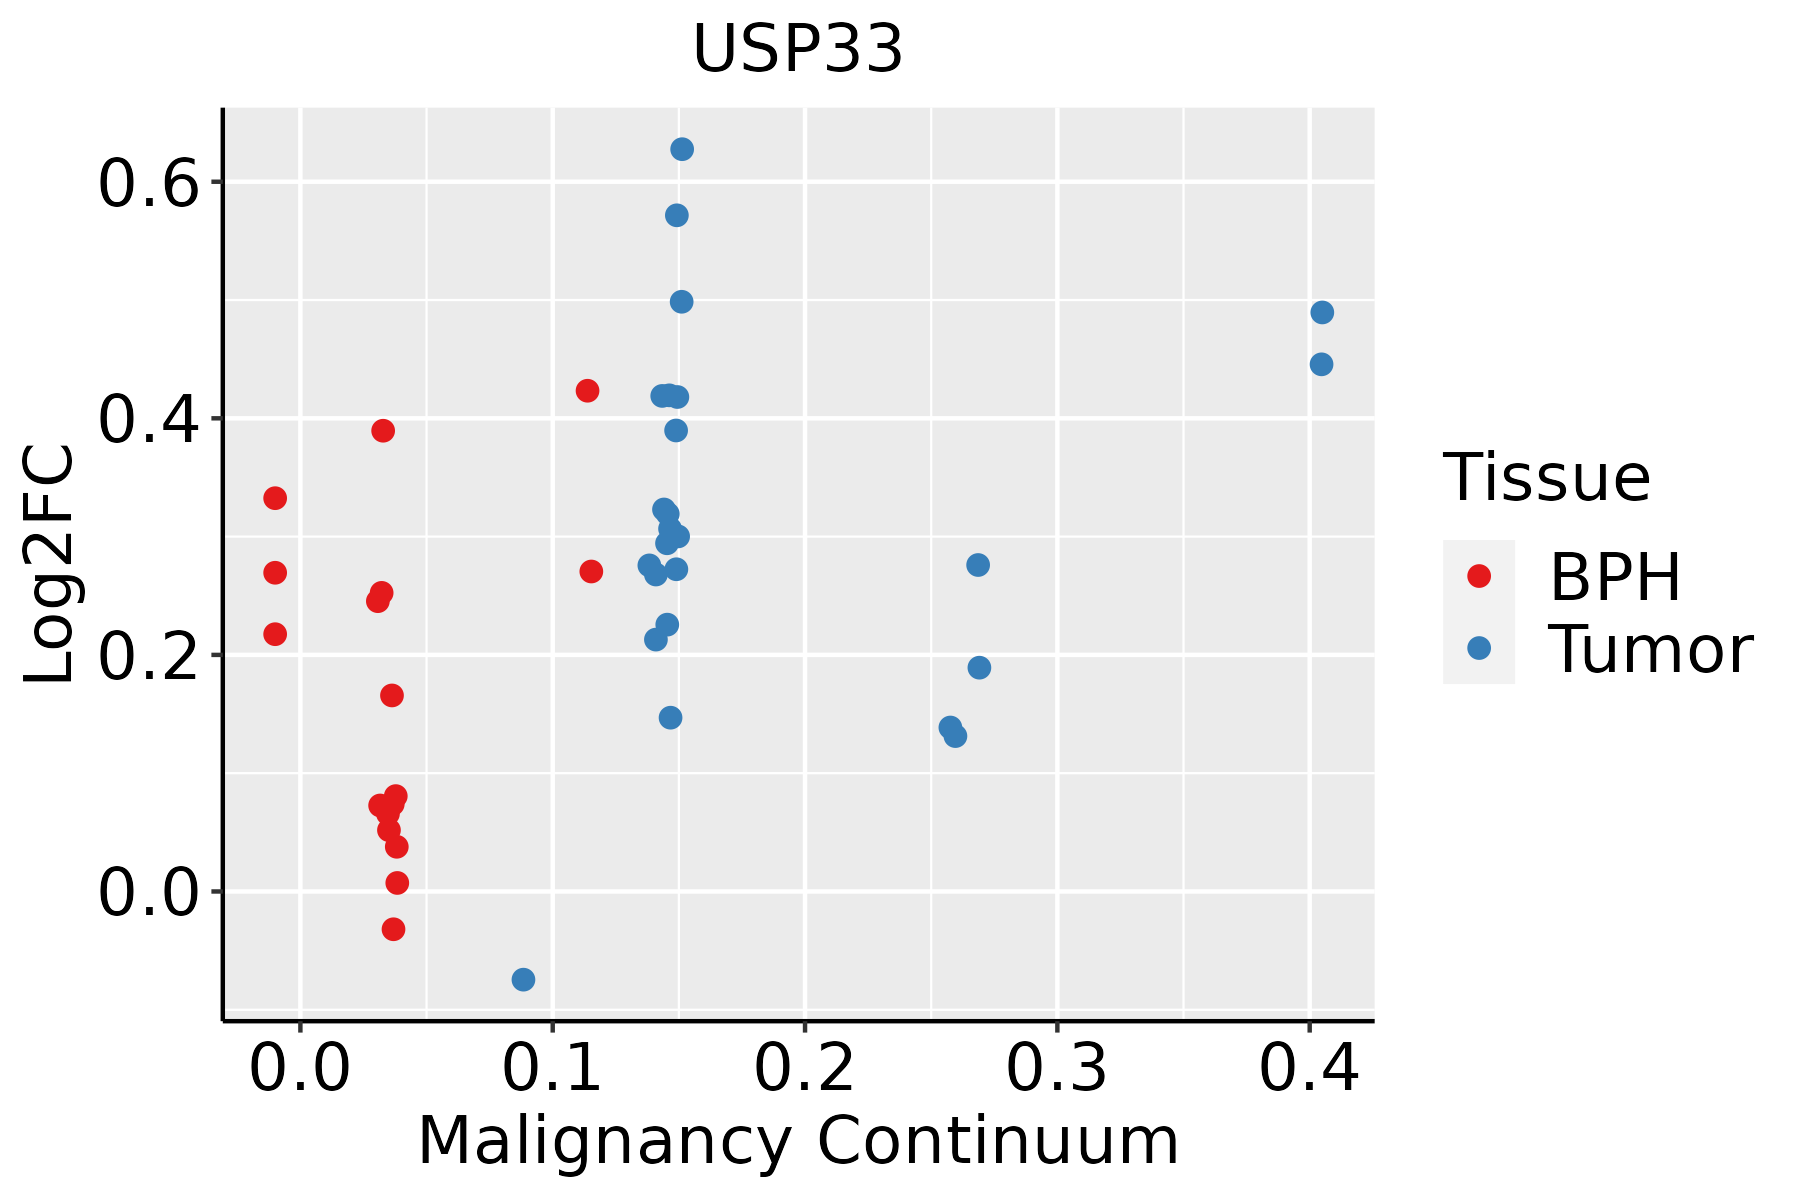 | BPH: Benign Prostatic Hyperplasia |
| Skin | 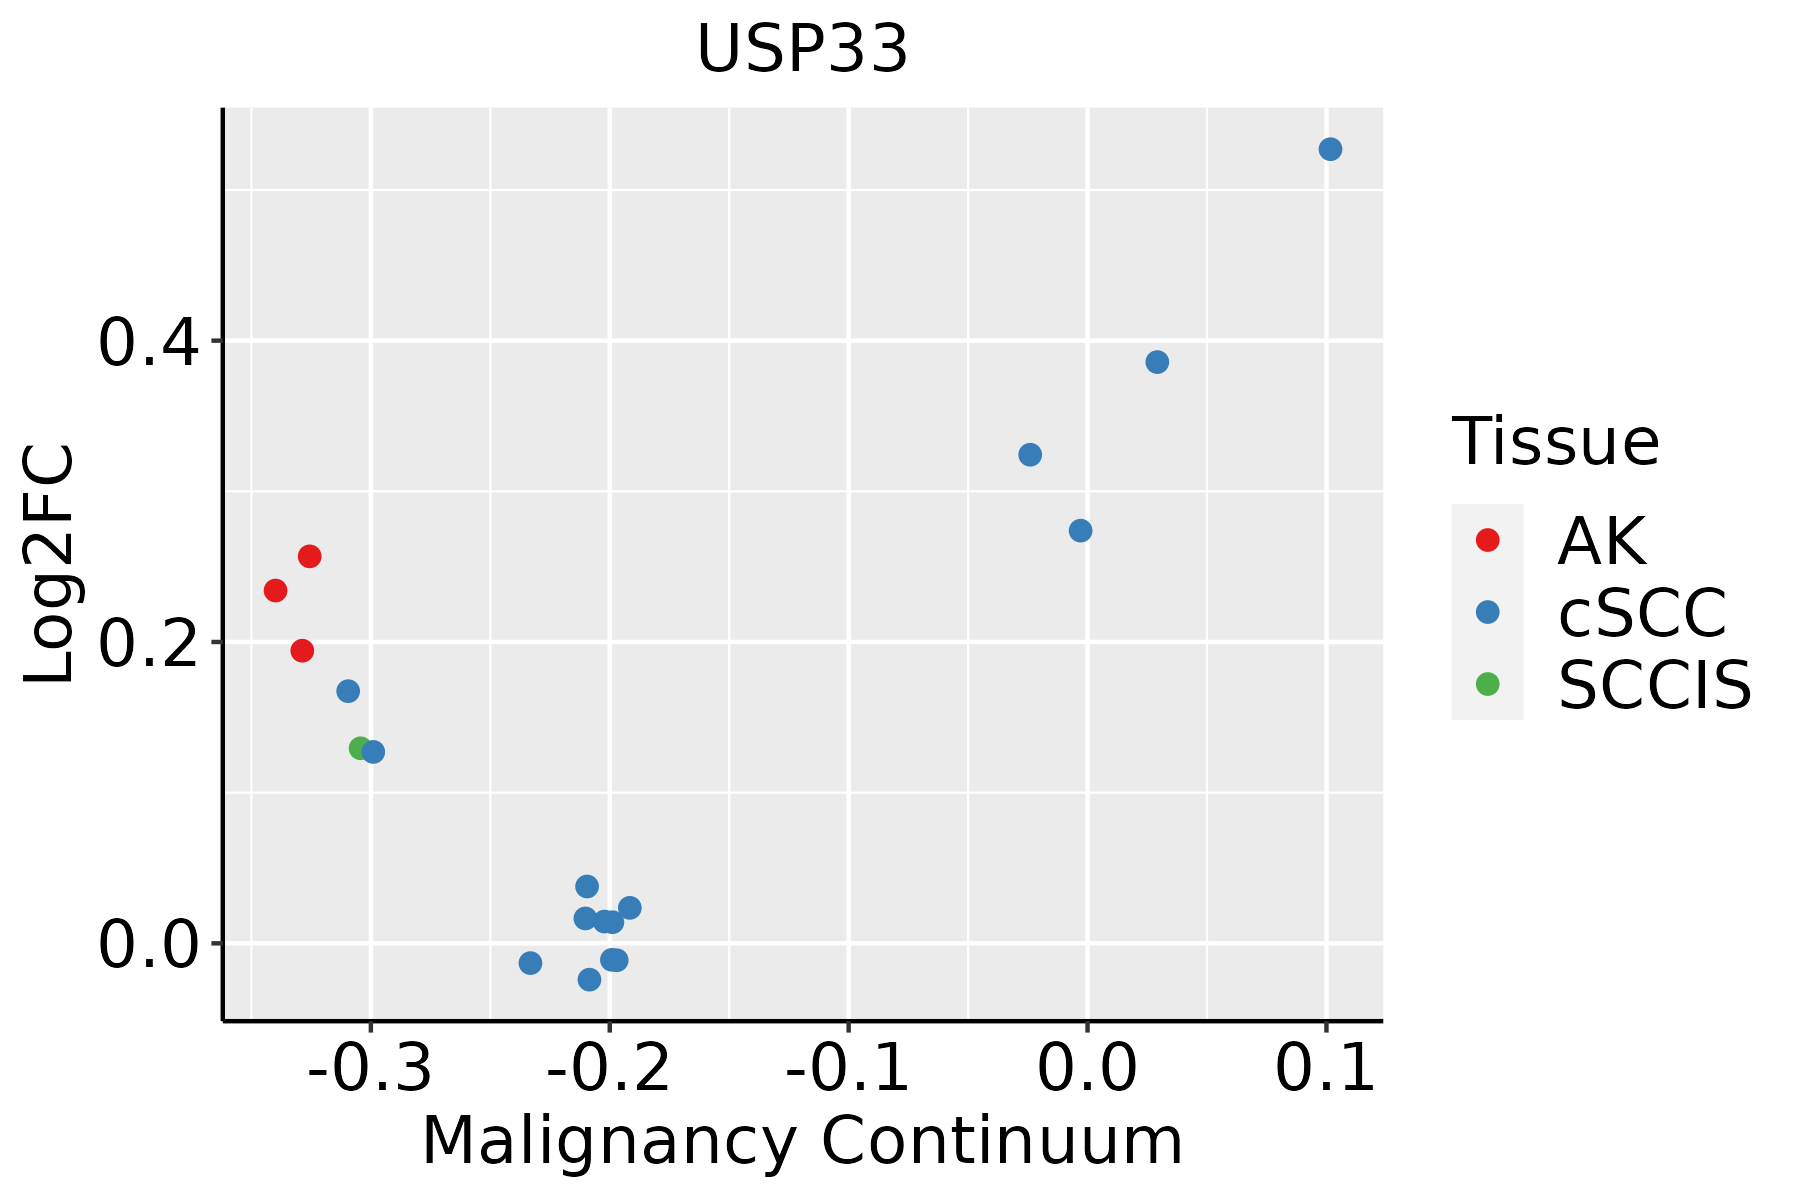 | AK: Actinic keratosis |
| cSCC: Cutaneous squamous cell carcinoma |
| SCCIS:squamous cell carcinoma in situ |
| Thyroid |  | ATC: Anaplastic thyroid cancer |
| HT: Hashimoto's thyroiditis |
| PTC: Papillary thyroid cancer |
| GO ID | Tissue | Disease Stage | Description | Gene Ratio | Bg Ratio | pvalue | p.adjust | Count |
| GO:0010506 | Colorectum | AD | regulation of autophagy | 111/3918 | 317/18723 | 3.57e-09 | 2.35e-07 | 111 |
| GO:0050821 | Colorectum | AD | protein stabilization | 73/3918 | 191/18723 | 3.02e-08 | 1.64e-06 | 73 |
| GO:0051099 | Colorectum | AD | positive regulation of binding | 66/3918 | 173/18723 | 1.47e-07 | 6.64e-06 | 66 |
| GO:0043393 | Colorectum | AD | regulation of protein binding | 68/3918 | 196/18723 | 5.17e-06 | 1.34e-04 | 68 |
| GO:0031667 | Colorectum | AD | response to nutrient levels | 138/3918 | 474/18723 | 1.22e-05 | 2.68e-04 | 138 |
| GO:0007409 | Colorectum | AD | axonogenesis | 122/3918 | 418/18723 | 3.36e-05 | 6.15e-04 | 122 |
| GO:0061564 | Colorectum | AD | axon development | 132/3918 | 467/18723 | 8.40e-05 | 1.31e-03 | 132 |
| GO:0032092 | Colorectum | AD | positive regulation of protein binding | 33/3918 | 85/18723 | 1.22e-04 | 1.78e-03 | 33 |
| GO:0042594 | Colorectum | AD | response to starvation | 63/3918 | 197/18723 | 1.77e-04 | 2.38e-03 | 63 |
| GO:0071496 | Colorectum | AD | cellular response to external stimulus | 94/3918 | 320/18723 | 1.98e-04 | 2.64e-03 | 94 |
| GO:0009267 | Colorectum | AD | cellular response to starvation | 51/3918 | 156/18723 | 3.90e-04 | 4.44e-03 | 51 |
| GO:0051100 | Colorectum | AD | negative regulation of binding | 50/3918 | 162/18723 | 1.84e-03 | 1.51e-02 | 50 |
| GO:0031668 | Colorectum | AD | cellular response to extracellular stimulus | 71/3918 | 246/18723 | 1.86e-03 | 1.52e-02 | 71 |
| GO:0031669 | Colorectum | AD | cellular response to nutrient levels | 63/3918 | 215/18723 | 2.19e-03 | 1.73e-02 | 63 |
| GO:0007411 | Colorectum | AD | axon guidance | 64/3918 | 227/18723 | 5.41e-03 | 3.55e-02 | 64 |
| GO:0097485 | Colorectum | AD | neuron projection guidance | 64/3918 | 228/18723 | 6.02e-03 | 3.78e-02 | 64 |
| GO:0032091 | Colorectum | AD | negative regulation of protein binding | 30/3918 | 94/18723 | 8.26e-03 | 4.85e-02 | 30 |
| GO:00316472 | Colorectum | MSS | regulation of protein stability | 103/3467 | 298/18723 | 2.52e-11 | 3.49e-09 | 103 |
| GO:00510982 | Colorectum | MSS | regulation of binding | 113/3467 | 363/18723 | 3.55e-09 | 2.41e-07 | 113 |
| GO:00508212 | Colorectum | MSS | protein stabilization | 68/3467 | 191/18723 | 1.53e-08 | 8.81e-07 | 68 |
| Hugo Symbol | Variant Class | Variant Classification | dbSNP RS | HGVSc | HGVSp | HGVSp Short | SWISSPROT | BIOTYPE | SIFT | PolyPhen | Tumor Sample Barcode | Tissue | Histology | Sex | Age | Stage | Therapy Types | Drugs | Outcome |
| USP33 | SNV | Missense_Mutation | | c.1236C>G | p.Ile412Met | p.I412M | Q8TEY7 | protein_coding | tolerated(0.23) | benign(0.015) | TCGA-A2-A0CX-01 | Breast | breast invasive carcinoma | Female | <65 | I/II | Chemotherapy | adriamycin | SD |
| USP33 | SNV | Missense_Mutation | novel | c.1978C>A | p.Leu660Met | p.L660M | Q8TEY7 | protein_coding | tolerated(0.07) | possibly_damaging(0.688) | TCGA-A2-A25A-01 | Breast | breast invasive carcinoma | Female | <65 | I/II | Unspecific | Cytoxan | SD |
| USP33 | SNV | Missense_Mutation | | c.1728N>G | p.Phe576Leu | p.F576L | Q8TEY7 | protein_coding | deleterious(0) | probably_damaging(1) | TCGA-A8-A085-01 | Breast | breast invasive carcinoma | Male | <65 | I/II | Hormone Therapy | tamoxiphen | SD |
| USP33 | SNV | Missense_Mutation | | c.318C>A | p.Asn106Lys | p.N106K | Q8TEY7 | protein_coding | deleterious(0) | probably_damaging(1) | TCGA-AC-A23C-01 | Breast | breast invasive carcinoma | Female | <65 | I/II | Chemotherapy | chemo | CR |
| USP33 | SNV | Missense_Mutation | novel | c.61A>C | p.Ser21Arg | p.S21R | Q8TEY7 | protein_coding | deleterious_low_confidence(0.05) | benign(0.076) | TCGA-AN-A046-01 | Breast | breast invasive carcinoma | Female | >=65 | I/II | Unknown | Unknown | SD |
| USP33 | SNV | Missense_Mutation | | c.1031N>T | p.Asn344Ile | p.N344I | Q8TEY7 | protein_coding | tolerated(0.2) | benign(0.102) | TCGA-E2-A150-01 | Breast | breast invasive carcinoma | Female | <65 | I/II | Chemotherapy | doxorubicin | SD |
| USP33 | insertion | Nonsense_Mutation | novel | c.2806_2807insCAGATCCATAGTATCCTTTGTAGTGTTGTAAAT | p.Glu936delinsAlaAspProTerTyrProLeuTerCysCysLysTer | p.E936delinsADP*YPL*CCK* | Q8TEY7 | protein_coding | | | TCGA-AN-A0FX-01 | Breast | breast invasive carcinoma | Female | <65 | I/II | Unknown | Unknown | SD |
| USP33 | SNV | Missense_Mutation | novel | c.2081T>C | p.Val694Ala | p.V694A | Q8TEY7 | protein_coding | deleterious(0) | probably_damaging(1) | TCGA-2W-A8YY-01 | Cervix | cervical & endocervical cancer | Female | <65 | I/II | Chemotherapy | cisplatin | CR |
| USP33 | SNV | Missense_Mutation | | c.968N>T | p.Ser323Phe | p.S323F | Q8TEY7 | protein_coding | deleterious(0) | probably_damaging(0.996) | TCGA-C5-A1BQ-01 | Cervix | cervical & endocervical cancer | Female | >=65 | III/IV | Chemotherapy | cisplatin | CR |
| USP33 | SNV | Missense_Mutation | | c.968N>T | p.Ser323Phe | p.S323F | Q8TEY7 | protein_coding | deleterious(0) | probably_damaging(0.996) | TCGA-C5-A3HL-01 | Cervix | cervical & endocervical cancer | Female | >=65 | I/II | Unknown | Unknown | SD |


