
|
|||||
|
 | |
| |
| |
| |
| |
| |
|
Gene: USE1 |
Gene summary for USE1 |
| Gene information | Species | Human | Gene symbol | USE1 | Gene ID | 55850 |
| Gene name | unconventional SNARE in the ER 1 | |
| Gene Alias | D12 | |
| Cytomap | 19p13.11 | |
| Gene Type | protein-coding | GO ID | GO:0006807 | UniProtAcc | Q9NZ43 |
Top |
Malignant transformation analysis |
| Identification of the aberrant gene expression in precancerous and cancerous lesions by comparing the gene expression of stem-like cells in diseased tissues with normal stem cells |
| Entrez ID | Symbol | Replicates | Species | Organ | Tissue | Adj P-value | Log2FC | Malignancy |
| 55850 | USE1 | GSM4909293 | Human | Breast | IDC | 1.08e-05 | 2.21e-01 | 0.1581 |
| 55850 | USE1 | GSM4909308 | Human | Breast | IDC | 2.01e-02 | 2.21e-01 | 0.158 |
| 55850 | USE1 | GSM4909311 | Human | Breast | IDC | 1.20e-07 | -7.69e-02 | 0.1534 |
| 55850 | USE1 | GSM4909319 | Human | Breast | IDC | 1.21e-16 | -1.09e-01 | 0.1563 |
| 55850 | USE1 | GSM4909320 | Human | Breast | IDC | 5.22e-12 | 5.88e-01 | 0.1575 |
| 55850 | USE1 | GSM4909321 | Human | Breast | IDC | 1.56e-31 | 7.22e-01 | 0.1559 |
| 55850 | USE1 | NCCBC5 | Human | Breast | DCIS | 1.80e-04 | -1.18e-01 | 0.2046 |
| 55850 | USE1 | DCIS2 | Human | Breast | DCIS | 1.38e-49 | 1.41e-01 | 0.0085 |
| 55850 | USE1 | LZE4T | Human | Esophagus | ESCC | 2.38e-10 | 4.17e-01 | 0.0811 |
| 55850 | USE1 | LZE5T | Human | Esophagus | ESCC | 5.14e-03 | 5.36e-01 | 0.0514 |
| 55850 | USE1 | LZE7T | Human | Esophagus | ESCC | 1.80e-12 | 7.77e-01 | 0.0667 |
| 55850 | USE1 | LZE20T | Human | Esophagus | ESCC | 4.91e-05 | 9.22e-02 | 0.0662 |
| 55850 | USE1 | LZE22D1 | Human | Esophagus | HGIN | 1.98e-03 | 1.54e-01 | 0.0595 |
| 55850 | USE1 | LZE22T | Human | Esophagus | ESCC | 7.39e-06 | 5.15e-01 | 0.068 |
| 55850 | USE1 | LZE24T | Human | Esophagus | ESCC | 5.22e-23 | 7.05e-01 | 0.0596 |
| 55850 | USE1 | LZE6T | Human | Esophagus | ESCC | 1.01e-06 | 3.92e-01 | 0.0845 |
| 55850 | USE1 | P1T-E | Human | Esophagus | ESCC | 2.11e-10 | 5.19e-01 | 0.0875 |
| 55850 | USE1 | P2T-E | Human | Esophagus | ESCC | 3.03e-22 | 3.67e-01 | 0.1177 |
| 55850 | USE1 | P4T-E | Human | Esophagus | ESCC | 1.70e-44 | 9.85e-01 | 0.1323 |
| 55850 | USE1 | P5T-E | Human | Esophagus | ESCC | 5.47e-52 | 9.58e-01 | 0.1327 |
| Page: 1 2 3 4 5 6 7 |
| Tissue | Expression Dynamics | Abbreviation |
| Breast |  | IDC: Invasive ductal carcinoma |
| DCIS: Ductal carcinoma in situ | ||
| Precancer(BRCA1-mut): Precancerous lesion from BRCA1 mutation carriers | ||
| Esophagus | 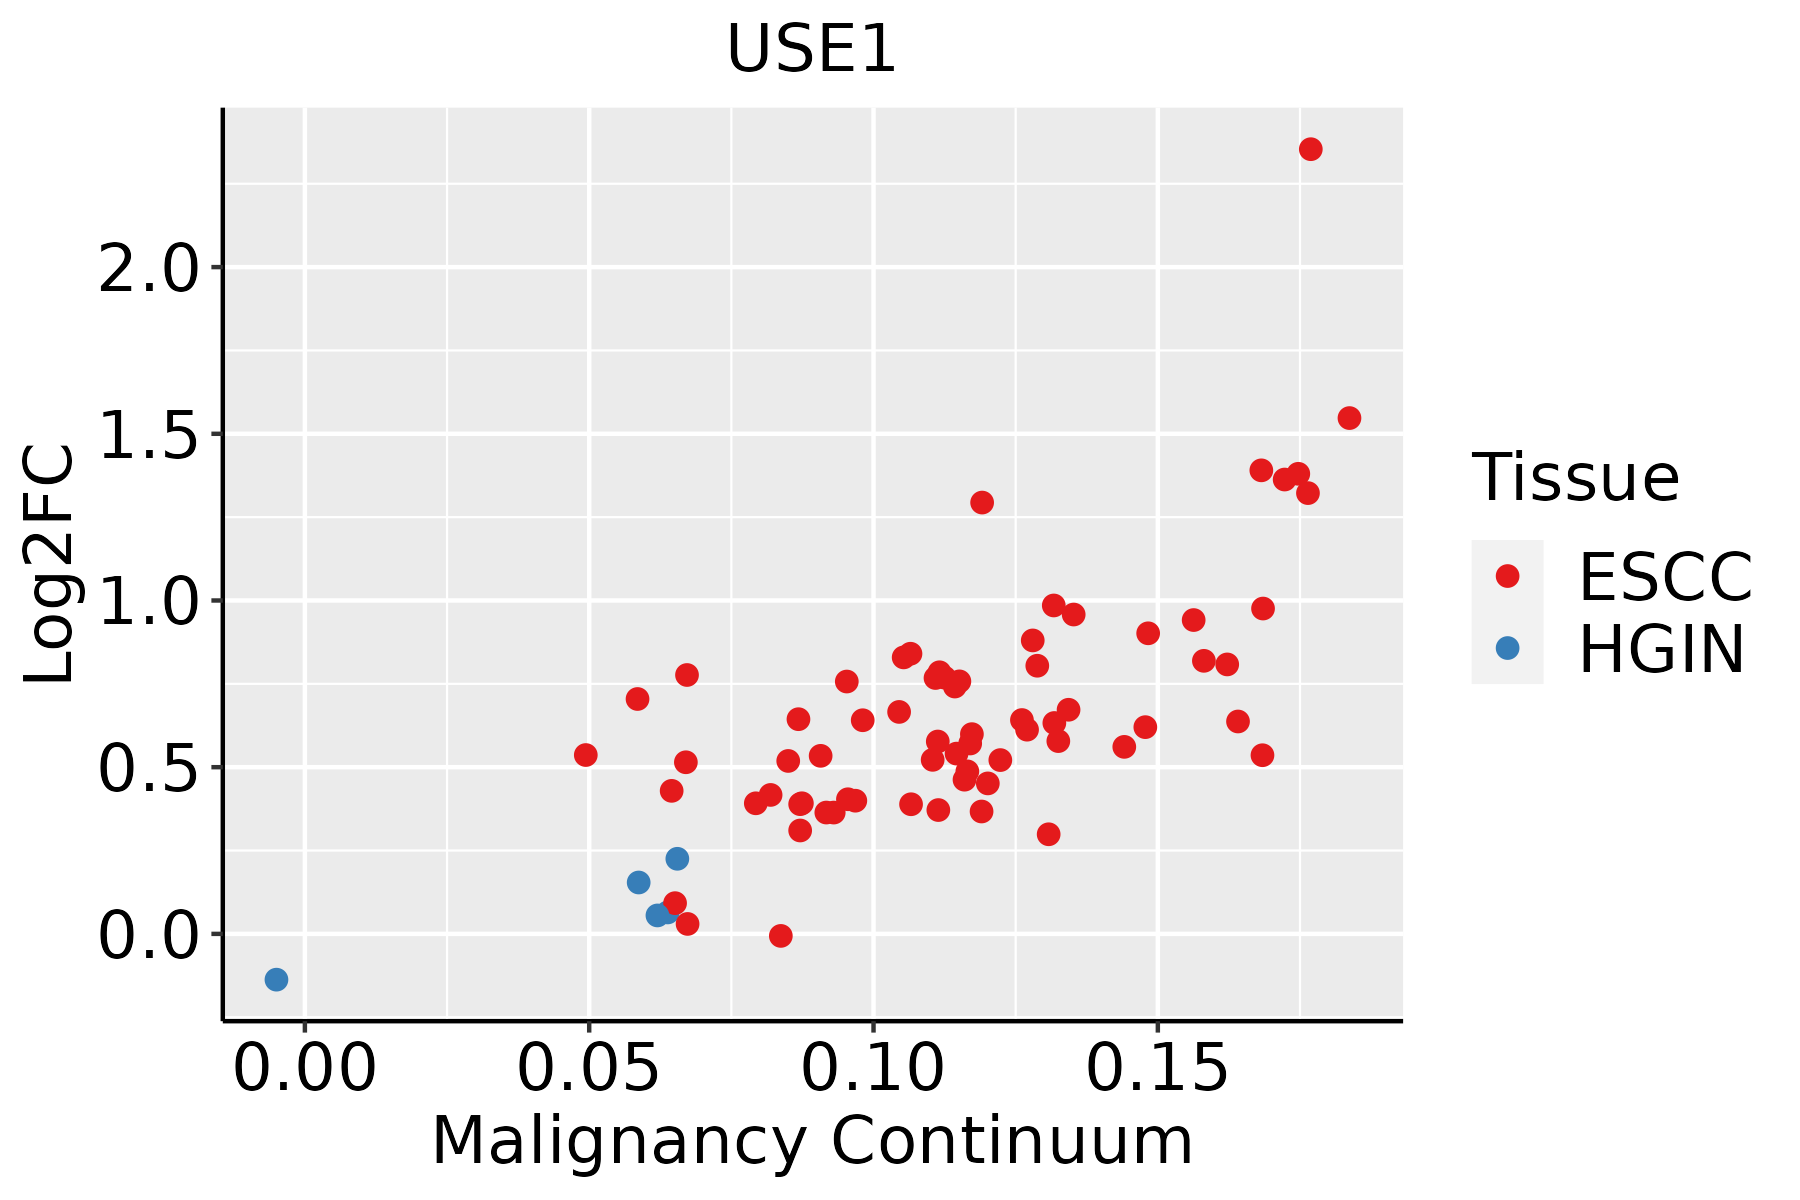 | ESCC: Esophageal squamous cell carcinoma |
| HGIN: High-grade intraepithelial neoplasias | ||
| LGIN: Low-grade intraepithelial neoplasias | ||
| Liver | 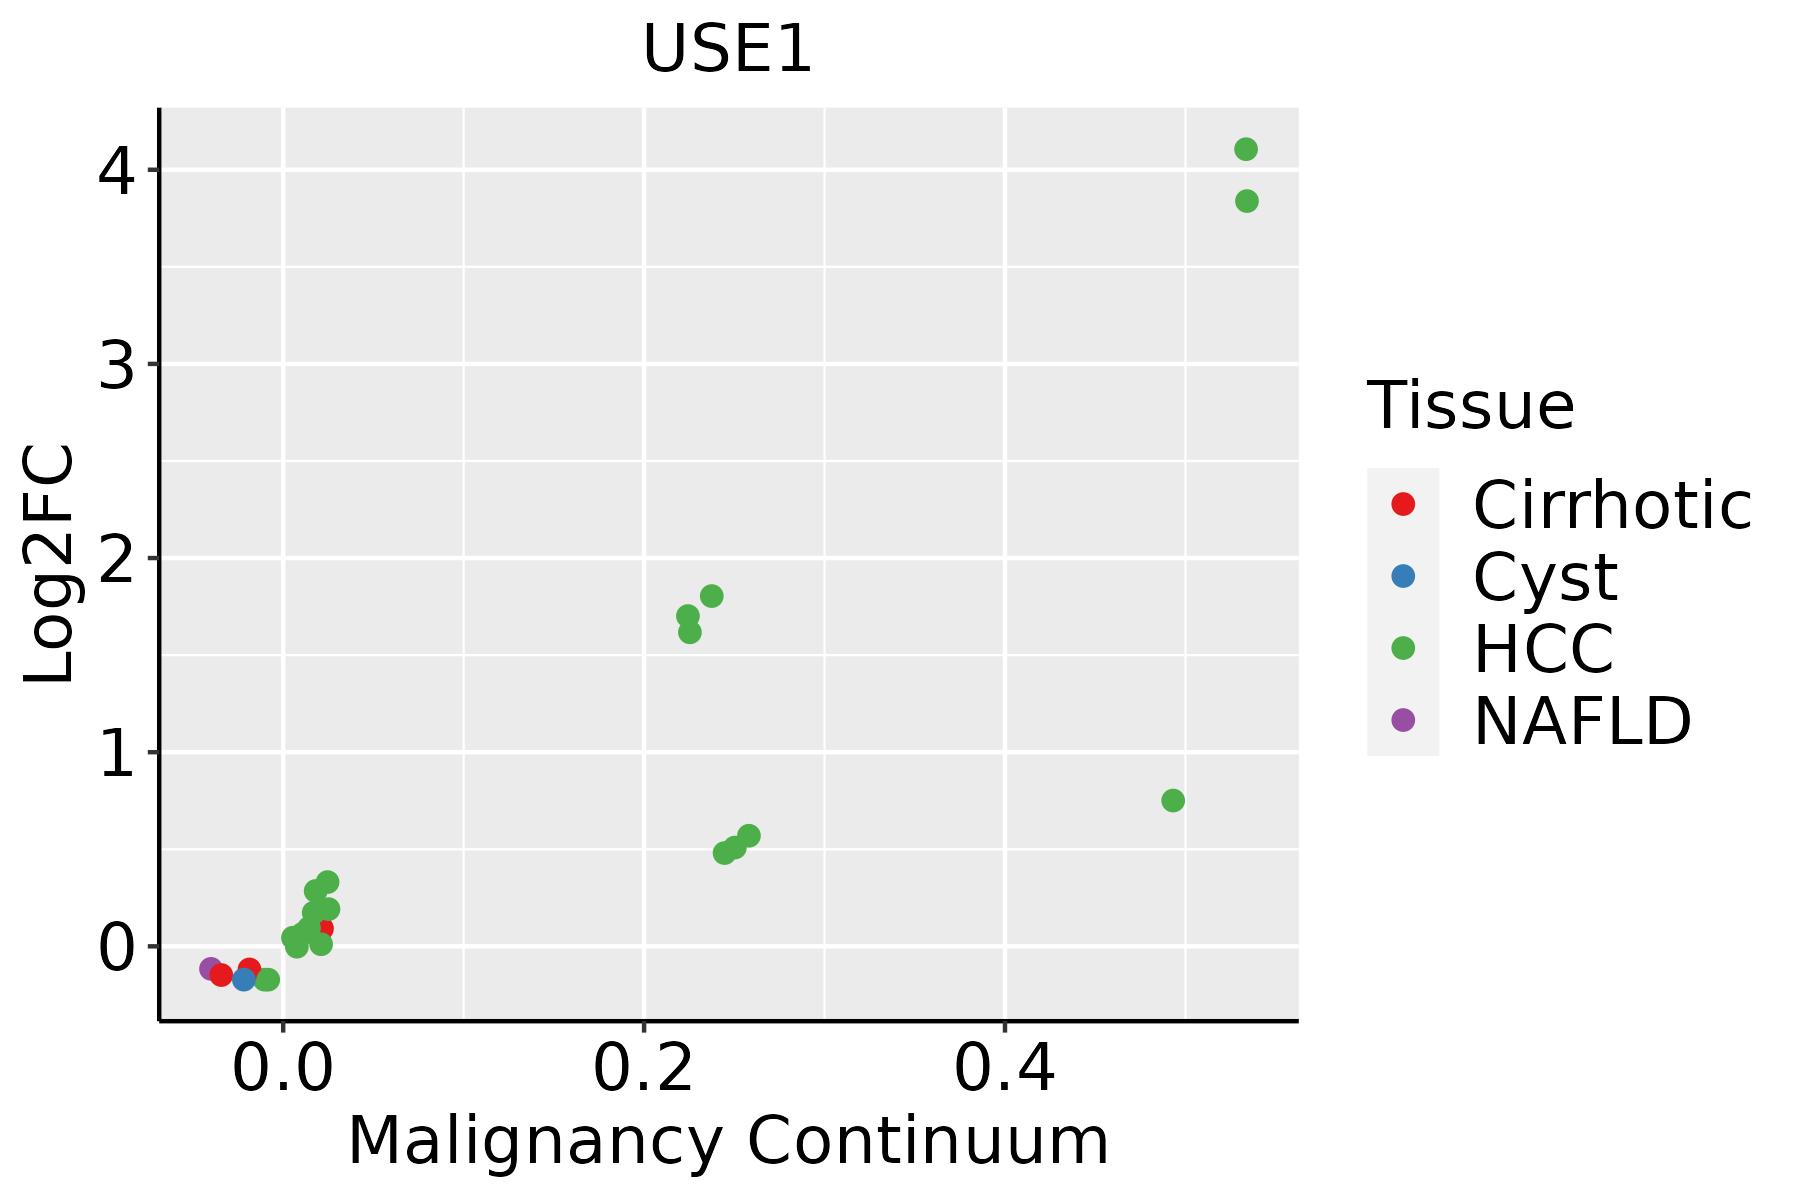 | HCC: Hepatocellular carcinoma |
| NAFLD: Non-alcoholic fatty liver disease | ||
| Oral Cavity | 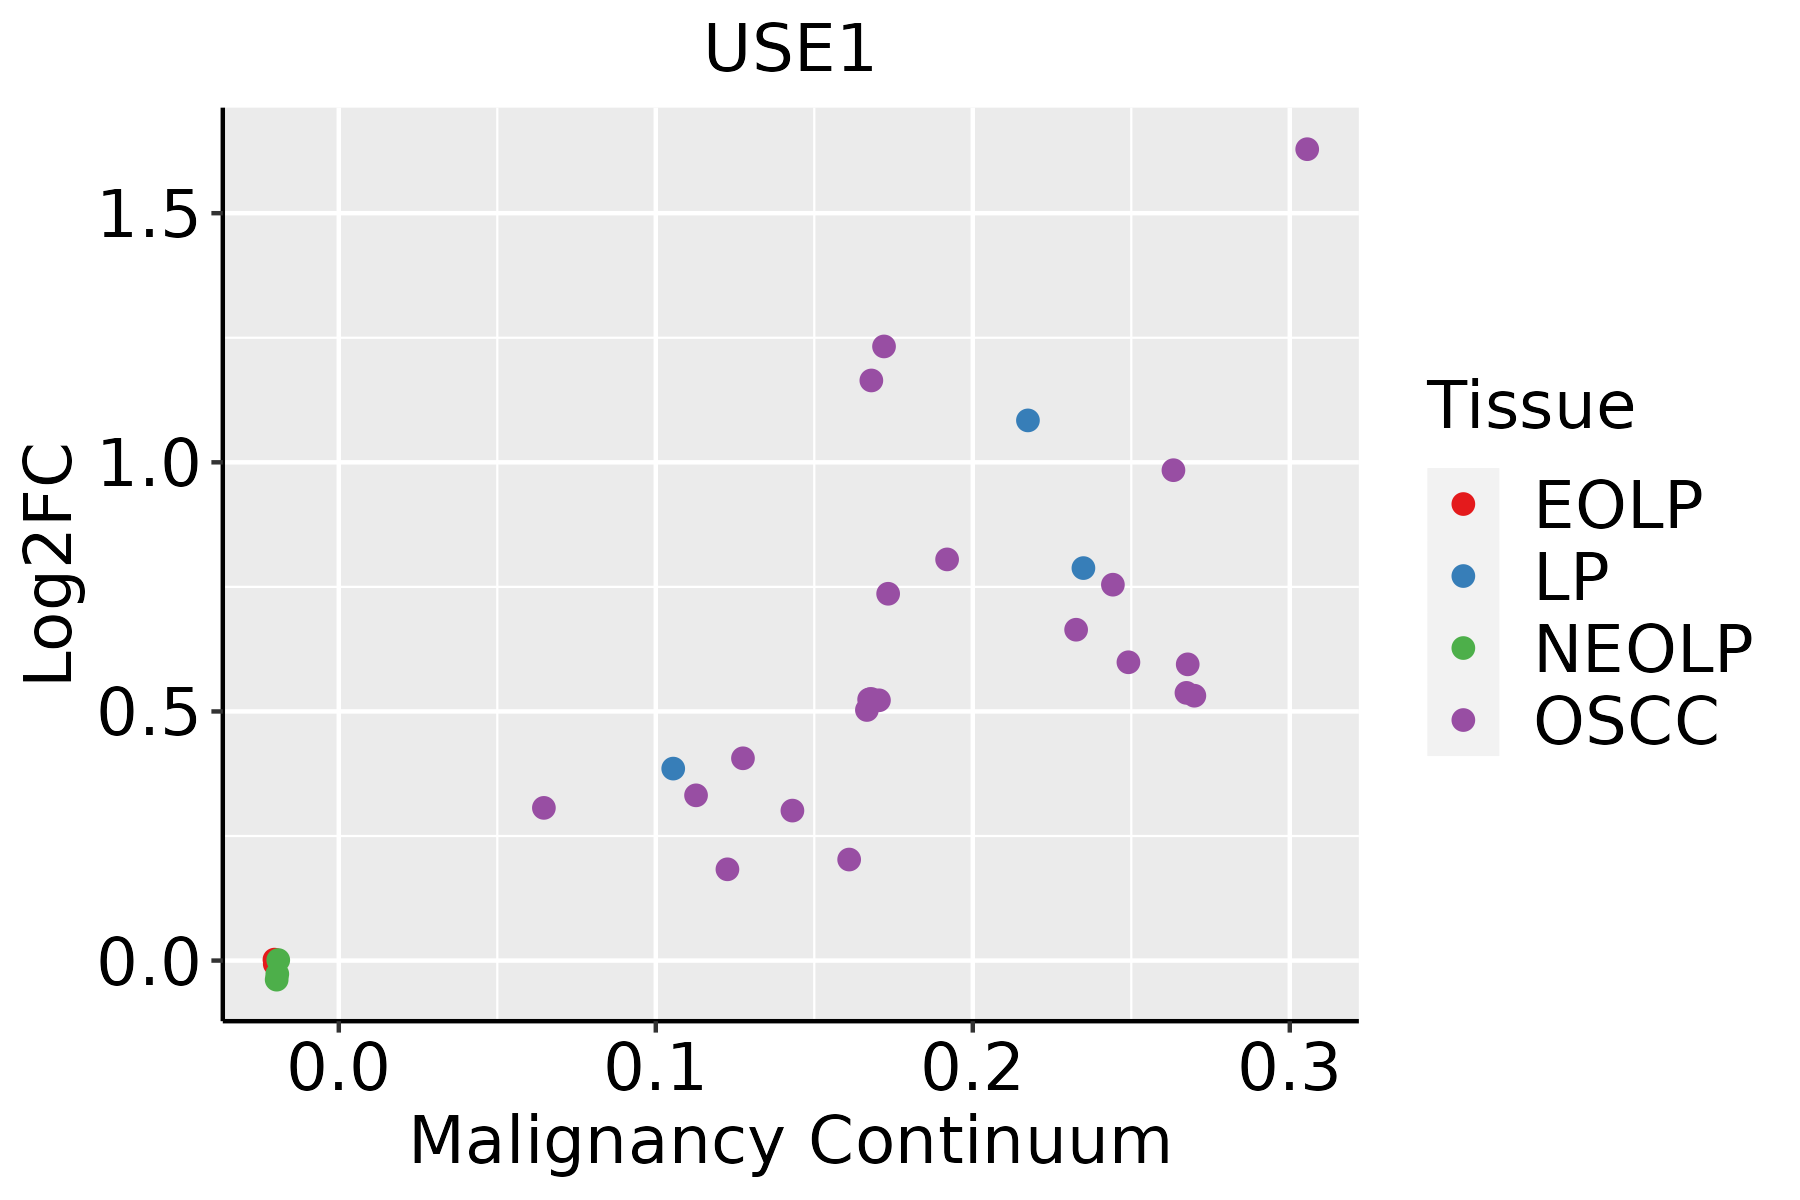 | EOLP: Erosive Oral lichen planus |
| LP: leukoplakia | ||
| NEOLP: Non-erosive oral lichen planus | ||
| OSCC: Oral squamous cell carcinoma | ||
| Skin |  | AK: Actinic keratosis |
| cSCC: Cutaneous squamous cell carcinoma | ||
| SCCIS:squamous cell carcinoma in situ | ||
| Thyroid |  | ATC: Anaplastic thyroid cancer |
| HT: Hashimoto's thyroiditis | ||
| PTC: Papillary thyroid cancer |
| ∗log2FC in expression of this searched gene in stem-like cells from each diseased tissue sample relative to stem-like cells in normal samples in each tissue plotted against the malignancy continuum. Samples are colored based on if they are from different disease stage. |
Top |
Malignant transformation related pathway analysis |
| Find out the enriched GO biological processes and KEGG pathways involved in transition from healthy to precancer to cancer |
| Tissue | Disease Stage | Enriched GO biological Processes |
| Colorectum | AD |  |
| Colorectum | SER |  |
| Colorectum | MSS |  |
| Colorectum | MSI-H |  |
| Colorectum | FAP |  |
| ∗Top 15 enriched GO BP terms are showed in the bar plot of each disease state in each tissue. Each row represents a significant GO biological process which is colored according to the -log10(p.adjust). |
| Page: 1 2 3 4 5 6 7 8 9 |
| GO ID | Tissue | Disease Stage | Description | Gene Ratio | Bg Ratio | pvalue | p.adjust | Count |
| GO:000703410 | Oral cavity | OSCC | vacuolar transport | 103/7305 | 157/18723 | 1.25e-11 | 4.44e-10 | 103 |
| GO:000689010 | Oral cavity | OSCC | retrograde vesicle-mediated transport, Golgi to endoplasmic reticulum | 40/7305 | 52/18723 | 2.86e-08 | 5.50e-07 | 40 |
| GO:00070418 | Oral cavity | OSCC | lysosomal transport | 69/7305 | 114/18723 | 2.62e-06 | 3.26e-05 | 69 |
| GO:00610253 | Oral cavity | OSCC | membrane fusion | 84/7305 | 163/18723 | 7.56e-04 | 4.12e-03 | 84 |
| GO:004819316 | Oral cavity | LP | Golgi vesicle transport | 141/4623 | 296/18723 | 6.11e-18 | 1.06e-15 | 141 |
| GO:000703415 | Oral cavity | LP | vacuolar transport | 74/4623 | 157/18723 | 7.85e-10 | 3.70e-08 | 74 |
| GO:000689015 | Oral cavity | LP | retrograde vesicle-mediated transport, Golgi to endoplasmic reticulum | 29/4623 | 52/18723 | 1.60e-06 | 3.79e-05 | 29 |
| GO:000704114 | Oral cavity | LP | lysosomal transport | 49/4623 | 114/18723 | 1.38e-05 | 2.45e-04 | 49 |
| GO:00610251 | Oral cavity | LP | membrane fusion | 58/4623 | 163/18723 | 1.19e-03 | 9.62e-03 | 58 |
| GO:0048193110 | Skin | cSCC | Golgi vesicle transport | 153/4864 | 296/18723 | 1.85e-21 | 3.41e-19 | 153 |
| GO:000703419 | Skin | cSCC | vacuolar transport | 74/4864 | 157/18723 | 8.60e-09 | 2.72e-07 | 74 |
| GO:000689018 | Skin | cSCC | retrograde vesicle-mediated transport, Golgi to endoplasmic reticulum | 27/4864 | 52/18723 | 5.68e-05 | 5.67e-04 | 27 |
| GO:000704110 | Skin | cSCC | lysosomal transport | 49/4864 | 114/18723 | 5.78e-05 | 5.74e-04 | 49 |
| GO:00610255 | Skin | cSCC | membrane fusion | 63/4864 | 163/18723 | 2.49e-04 | 2.03e-03 | 63 |
| GO:004819320 | Thyroid | PTC | Golgi vesicle transport | 186/5968 | 296/18723 | 3.09e-28 | 1.22e-25 | 186 |
| GO:0007034110 | Thyroid | PTC | vacuolar transport | 90/5968 | 157/18723 | 3.74e-11 | 1.35e-09 | 90 |
| GO:000689019 | Thyroid | PTC | retrograde vesicle-mediated transport, Golgi to endoplasmic reticulum | 37/5968 | 52/18723 | 6.98e-09 | 1.75e-07 | 37 |
| GO:000704115 | Thyroid | PTC | lysosomal transport | 63/5968 | 114/18723 | 1.97e-07 | 3.54e-06 | 63 |
| GO:00610256 | Thyroid | PTC | membrane fusion | 77/5968 | 163/18723 | 2.86e-05 | 2.78e-04 | 77 |
| GO:0048193111 | Thyroid | ATC | Golgi vesicle transport | 189/6293 | 296/18723 | 9.58e-27 | 5.05e-24 | 189 |
| Page: 1 2 3 |
| Pathway ID | Tissue | Disease Stage | Description | Gene Ratio | Bg Ratio | pvalue | p.adjust | qvalue | Count |
| hsa041305 | Esophagus | ESCC | SNARE interactions in vesicular transport | 28/4205 | 33/8465 | 2.75e-05 | 1.32e-04 | 6.75e-05 | 28 |
| hsa0413012 | Esophagus | ESCC | SNARE interactions in vesicular transport | 28/4205 | 33/8465 | 2.75e-05 | 1.32e-04 | 6.75e-05 | 28 |
| hsa04130 | Liver | Cirrhotic | SNARE interactions in vesicular transport | 18/2530 | 33/8465 | 2.64e-03 | 1.10e-02 | 6.76e-03 | 18 |
| hsa041301 | Liver | Cirrhotic | SNARE interactions in vesicular transport | 18/2530 | 33/8465 | 2.64e-03 | 1.10e-02 | 6.76e-03 | 18 |
| hsa041302 | Liver | HCC | SNARE interactions in vesicular transport | 25/4020 | 33/8465 | 8.78e-04 | 3.38e-03 | 1.88e-03 | 25 |
| hsa041303 | Liver | HCC | SNARE interactions in vesicular transport | 25/4020 | 33/8465 | 8.78e-04 | 3.38e-03 | 1.88e-03 | 25 |
| hsa041304 | Oral cavity | OSCC | SNARE interactions in vesicular transport | 28/3704 | 33/8465 | 1.31e-06 | 7.18e-06 | 3.66e-06 | 28 |
| hsa0413011 | Oral cavity | OSCC | SNARE interactions in vesicular transport | 28/3704 | 33/8465 | 1.31e-06 | 7.18e-06 | 3.66e-06 | 28 |
| hsa0413021 | Oral cavity | LP | SNARE interactions in vesicular transport | 22/2418 | 33/8465 | 6.00e-06 | 4.76e-05 | 3.07e-05 | 22 |
| hsa0413031 | Oral cavity | LP | SNARE interactions in vesicular transport | 22/2418 | 33/8465 | 6.00e-06 | 4.76e-05 | 3.07e-05 | 22 |
| Page: 1 |
Top |
Cell-cell communication analysis |
| Identification of potential cell-cell interactions between two cell types and their ligand-receptor pairs for different disease states |
| Ligand | Receptor | LRpair | Pathway | Tissue | Disease Stage |
| Page: 1 |
Top |
Single-cell gene regulatory network inference analysis |
| Find out the significant the regulons (TFs) and the target genes of each regulon across cell types for different disease states |
| TF | Cell Type | Tissue | Disease Stage | Target Gene | RSS | Regulon Activity |
| ∗The dot plots of a searched regulon are shown for all cell subpopulations in each disease state of each tissue based on the regulon specific score inferred using pySCENIC and by calculating the average expression. |
| Page: 1 |
Top |
Somatic mutation of malignant transformation related genes |
| Annotation of somatic variants for genes involved in malignant transformation |
| Hugo Symbol | Variant Class | Variant Classification | dbSNP RS | HGVSc | HGVSp | HGVSp Short | SWISSPROT | BIOTYPE | SIFT | PolyPhen | Tumor Sample Barcode | Tissue | Histology | Sex | Age | Stage | Therapy Types | Drugs | Outcome |
| USE1 | SNV | Missense_Mutation | rs189793505 | c.662N>A | p.Arg221His | p.R221H | Q9NZ43 | protein_coding | deleterious(0) | probably_damaging(0.999) | TCGA-A2-A04R-01 | Breast | breast invasive carcinoma | Female | <65 | I/II | Chemotherapy | taxol | SD |
| USE1 | SNV | Missense_Mutation | novel | c.272C>A | p.Ala91Asp | p.A91D | Q9NZ43 | protein_coding | tolerated(0.07) | probably_damaging(0.96) | TCGA-A7-A6VY-01 | Breast | breast invasive carcinoma | Female | <65 | I/II | Chemotherapy | cyclophosphamide | CR |
| USE1 | SNV | Missense_Mutation | novel | c.664N>G | p.Leu222Val | p.L222V | Q9NZ43 | protein_coding | deleterious(0) | probably_damaging(1) | TCGA-AA-A02J-01 | Colorectum | colon adenocarcinoma | Female | >=65 | III/IV | Unknown | Unknown | PD |
| USE1 | SNV | Missense_Mutation | novel | c.627N>A | p.Asp209Glu | p.D209E | Q9NZ43 | protein_coding | tolerated(0.1) | possibly_damaging(0.841) | TCGA-AG-A014-01 | Colorectum | rectum adenocarcinoma | Male | >=65 | I/II | Unknown | Unknown | SD |
| USE1 | SNV | Missense_Mutation | novel | c.560N>T | p.Thr187Ile | p.T187I | Q9NZ43 | protein_coding | tolerated(0.2) | possibly_damaging(0.479) | TCGA-AP-A051-01 | Endometrium | uterine corpus endometrioid carcinoma | Female | >=65 | I/II | Unknown | Unknown | SD |
| USE1 | SNV | Missense_Mutation | rs201641941 | c.518N>T | p.Ala173Val | p.A173V | Q9NZ43 | protein_coding | deleterious(0) | probably_damaging(0.964) | TCGA-AX-A05S-01 | Endometrium | uterine corpus endometrioid carcinoma | Female | >=65 | III/IV | Unspecific | Carboplatin & Paclitaxel | PD |
| USE1 | SNV | Missense_Mutation | rs757389318 | c.721N>A | p.Val241Ile | p.V241I | Q9NZ43 | protein_coding | deleterious(0) | probably_damaging(0.964) | TCGA-AX-A0J1-01 | Endometrium | uterine corpus endometrioid carcinoma | Female | >=65 | I/II | Unknown | Unknown | SD |
| USE1 | SNV | Missense_Mutation | novel | c.529N>A | p.Leu177Ile | p.L177I | Q9NZ43 | protein_coding | tolerated(0.09) | possibly_damaging(0.615) | TCGA-AX-A2HD-01 | Endometrium | uterine corpus endometrioid carcinoma | Female | >=65 | III/IV | Unknown | Unknown | SD |
| USE1 | SNV | Missense_Mutation | c.547C>T | p.Leu183Phe | p.L183F | Q9NZ43 | protein_coding | deleterious(0) | probably_damaging(0.998) | TCGA-B5-A11E-01 | Endometrium | uterine corpus endometrioid carcinoma | Female | <65 | I/II | Unknown | Unknown | SD | |
| USE1 | SNV | Missense_Mutation | c.178G>A | p.Glu60Lys | p.E60K | Q9NZ43 | protein_coding | deleterious(0.01) | probably_damaging(0.936) | TCGA-B5-A11R-01 | Endometrium | uterine corpus endometrioid carcinoma | Female | <65 | I/II | Chemotherapy | paclitaxel | SD |
| Page: 1 2 3 |
Top |
Related drugs of malignant transformation related genes |
| Identification of chemicals and drugs interact with genes involved in malignant transfromation |
| (DGIdb 4.0) |
| Entrez ID | Symbol | Category | Interaction Types | Drug Claim Name | Drug Name | PMIDs |
| Page: 1 |

Copyright 2023-Present -The University of Texas Health Science Center at Houston |